|
|
|
|
|
|
|
|
I won't back down
Hey baby, there ain't no easy way out
I won't back down
Hey, I will stand my ground
And I won't back down
I won't back down
Hey baby, there ain't no easy way out
I won't back down
Hey, I will stand my ground
And I won't back down
No, I won't back down
Tom Petty
I have been quite concerned about the potential fallout with the tariff war, in fact much more than most other participants in the US markets. Nobody wins tariff wars. China has been slowly letting their currency weaken in response to the proposed tariffs and earlier today the PBOC imposed a reserve requirement of 20% on trading of foreign exchange forward contracts. Immediately the Yuan spiked and the US futures shot up. Was China backing down? Nope. A little while later they announced $60 billion worth of tariffs to counter
President Trump's proposed tariffs. Larry Kudlow was on Bloomberg TV saying the President won't back down. The equity market yawns for now as the tariffs are focused on commodities like soybeans, corn, wheat, and liquor. There isn't crude or other energy commodities on the list yet. What if they decide to go after high tech products like iPhones, semiconductors, software etc? That might get the market's attention.
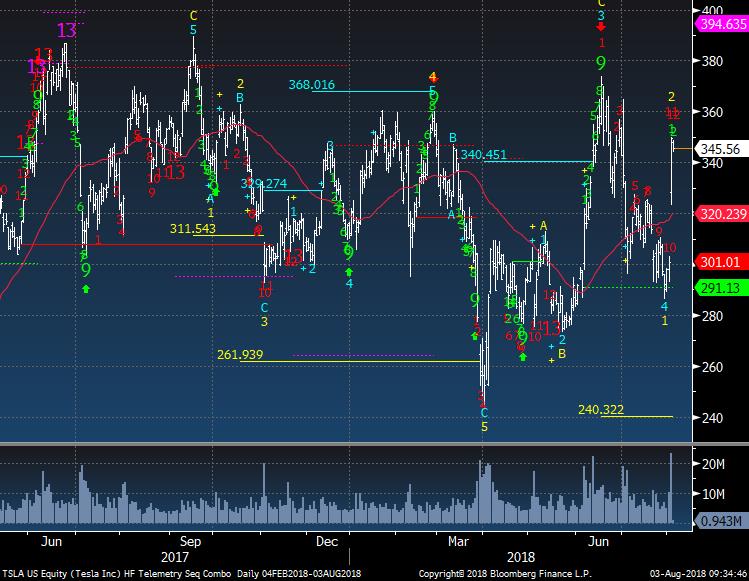
Yesterday, I watched Tesla gap up from 325-348. My short entry was previously at 348. Giving back gains like that honestly hurt and if I expected that type of continued move I would have covered and moved to cash. Looking back in hindsight is easy but I had a plan and it was to wait for the upside daily exhaustion signal as it is on day 12 of 13 today as the record using the indicator on both the upside and downside is pretty good. Nothing has changed with the fundamentals (except they have become worse)
and if this wasn't on day 12/13 I'd probably risk manage and cover to wait for a signal. It is the nature of this risky speculative stock.
Today's note has a couple charts of the US jobs data that I overlaid some DeMark Indicators that have worked well in the past. These are longer term in nature but for some of my clients who allocate longer term to different strategies they really find them useful.
I hope everyone has a great weekend and thank you for all your support.
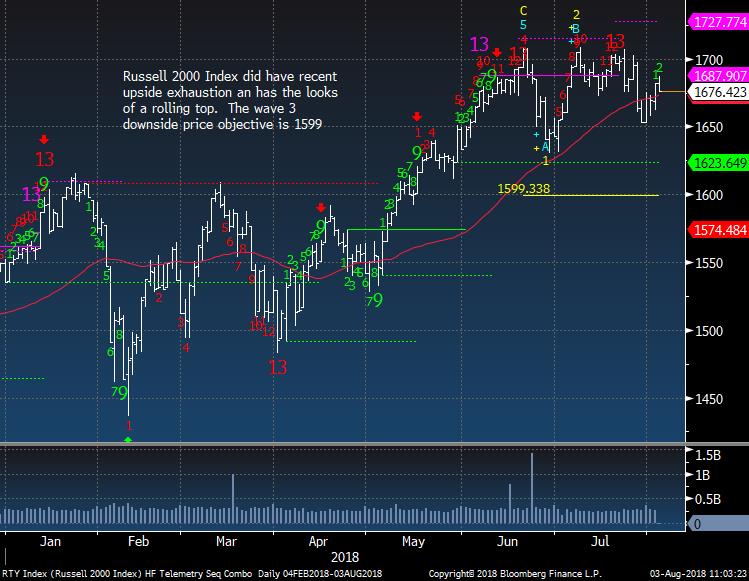
- US Markets - Sentiment, Daily and 60 minute tactical views - still in elevated sentiment range, rolling top on Russell
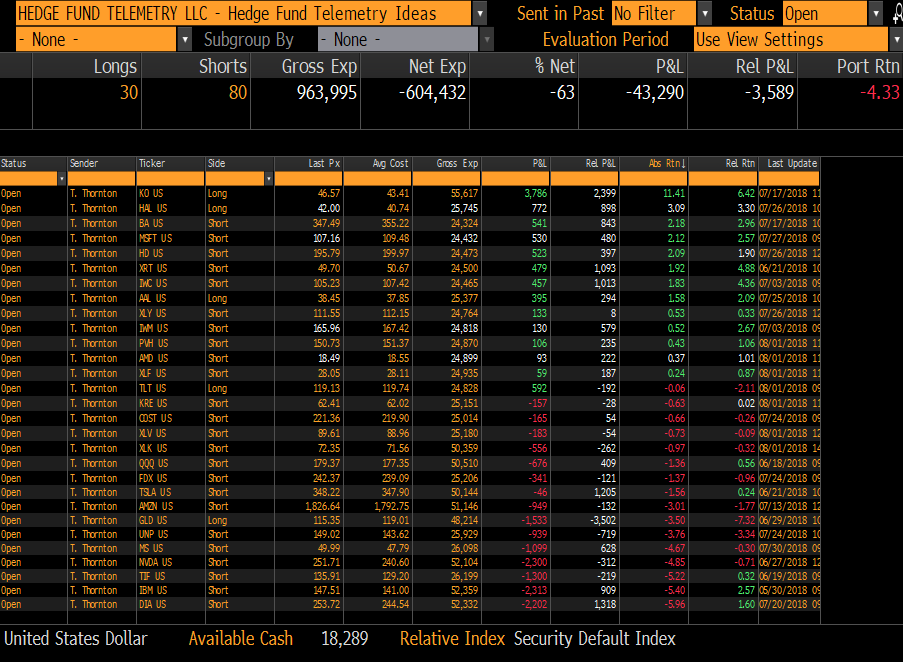
- Hedge Fund Telemetry Trade Ideas - No changes
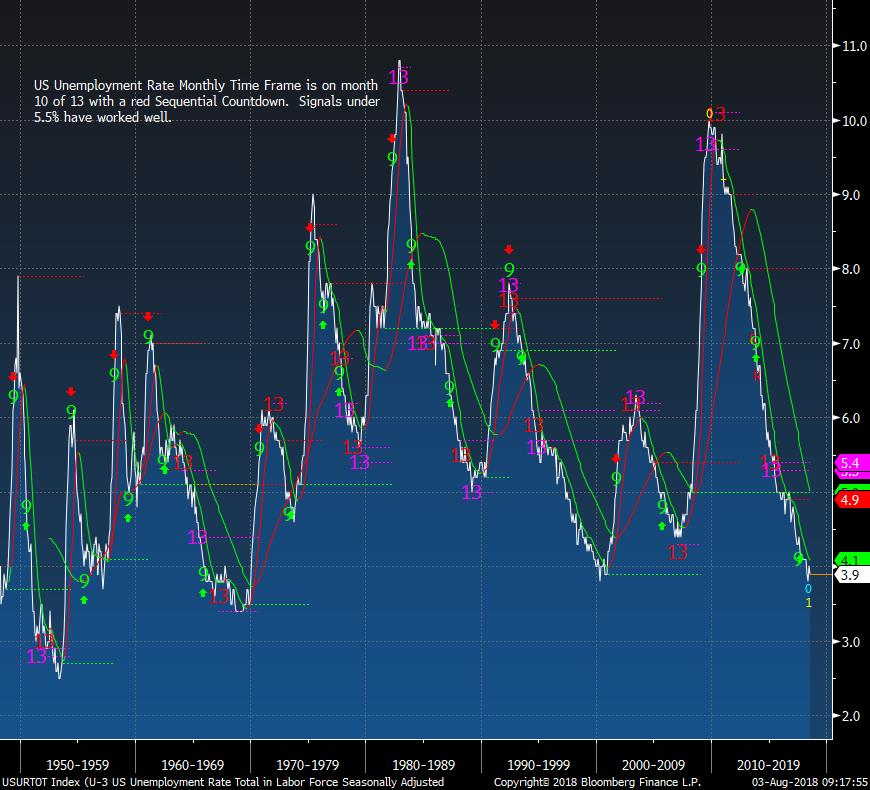
- US Unemployment
Rate and "Hard to Fill" Jobs data - Long term view
- F' Tesla - On day 12 of 13 with upside Countdown
- Currency Update - USD and major crosses still in range but Yuan downside daily exhaustion today
- European Market Update - Just can't seem to get momentum to turn up
- Global Market Update - Vanguard ex US Index still looks terrible
- Asian Market Update - Downside exhaustion in FXI - Going to add to trade ideas soon
- Crude Update - Sideways action but sentiment is extreme
- Gold Update - Gold Futures finally got the downside red Countdown exhaustion with bullish sentiment at 6%
- Bond Update - Some mixed messages
- DeMark Screens - Daily, Weekly, Monthly upside/downside exhaustion signals within the S&P 1500 and Euro Stoxx 600
|
|
|
|
|
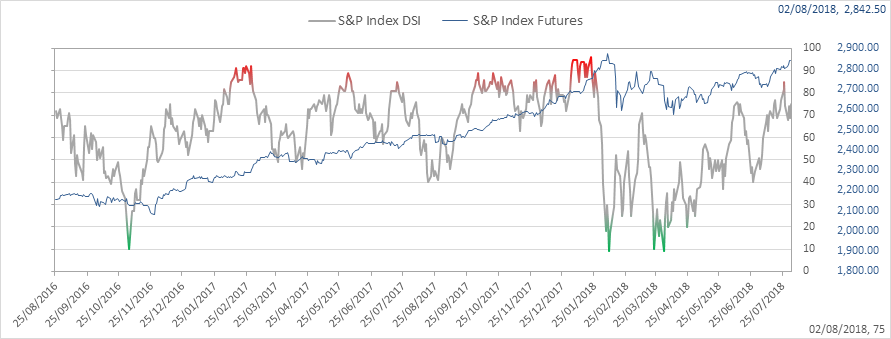
Here's a link to the Hedge Fund Telemetry market sentiment page with 40 charts of sentiment including equities, bonds, currencies, and commodities updated each day.
SPX bullish sentiment is at 75% and remains elevated (70%-79% elevated zone)
|
|
|
|
|
SPX daily drifting sideways and is now on day 9/13 so a little more nominal upside is expected
|
|
|
|
|
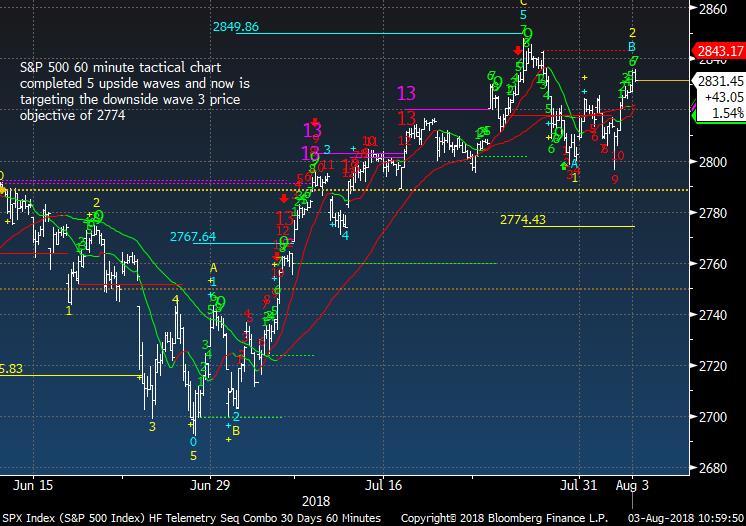
SPX 60 minute tactical time frame has made a lower high and potential for a dip back to 2800 could happen... maybe even a little lower.
|
|
|
|
|
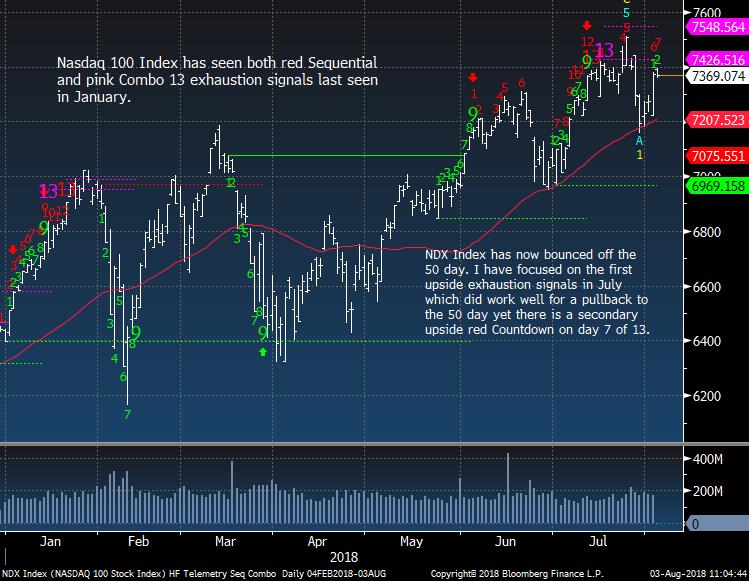
Nasdaq bullish sentiment is at 73%
|
|
|
|
|
NDX Index has a secondary countdown on day 7/13. The previous July upside exhaustion pulled back to the 50 day and that was all we got similar to all of 2017
|
|
|
|
|
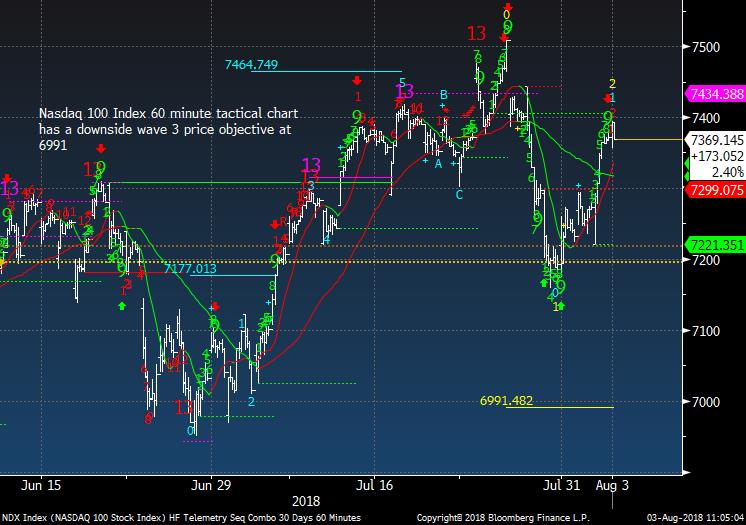
NDX 60 minute time frame stalling out at 7400 with the green Setup 9 and now with potential for downside to 7000
|
|
|
|
|
Russell 2000 did have recent upside exhaustion
|
|
|
|
|
|
|
Hedge Fund Telemetry Trade Ideas
|
|
|
Trade Ideas - No changes today. I am likely going to add FXI soon as a long. Some chatter (on a Friday) of activist interest in IBM.
|
|
|
|
|
|
|
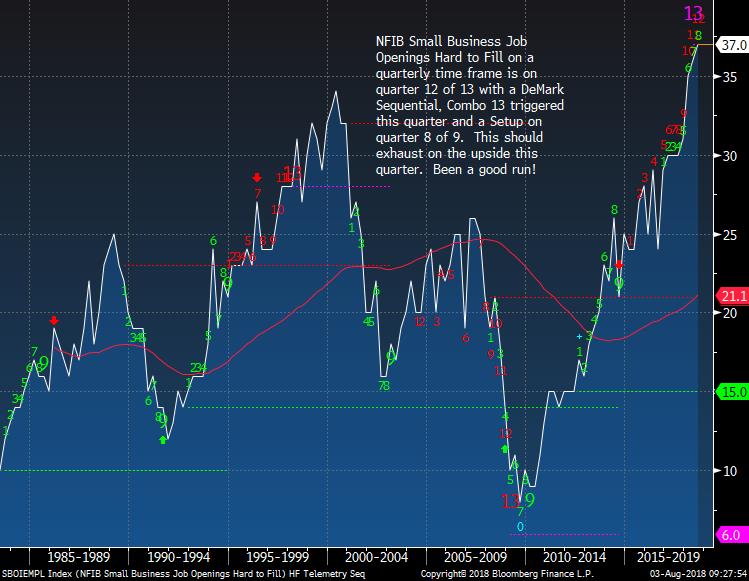
US Unemployment Long Term View and "Hard to Fill"
|
|
|
The US Unemployment chart on a monthly time frame has been pretty good on both spotting tops and bottoms. This has been a very long recovery when unemployment peaked in early 2010 similar to the downward move seen in the 80's and 90's. It is not uncommon to see a false exhaustion midway but the signals on the bottom tend to work well under 5.5%. Unfortunately when this turns up a recession is dead ahead. The next chart is the close up with the current
Countdown
|
|
|
|
|
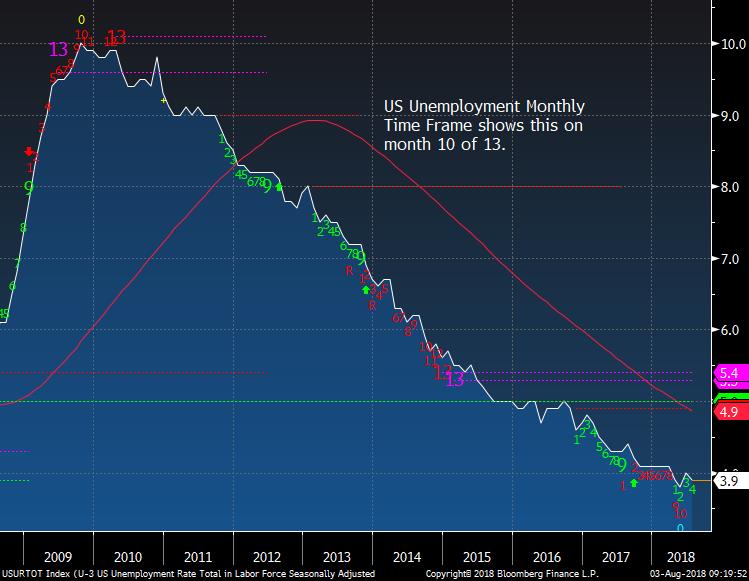
Here is the monthly from 2010 to present. This remains on month 10 of 13 with the second downside Countdown. This could have a downside exhaustion by the end of the year.
|
|
|
|
|
Small business "Hard to Fill" job openings on a quarterly time frame has now a pink Combo 13 and is on quarter 12 of 13 on the upside. This could start to roll in the coming quarters.
|
|
|
|
|
|
|
|
|
Tesla is on day 12 of 13 today with an upside Countdown. Previous daily upside and downside Countdown 13's have worked well at inflection points. Setup 9's worked well too and I shorted the last 2 upside Setup 9's
|
|
|
|
|
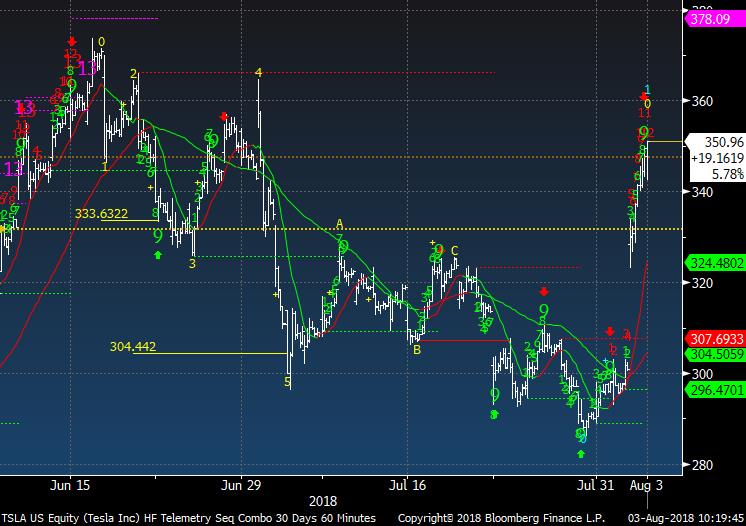
Here's the 60 min time frame and it is on 13 too by the time you are reading this.
|
|
|
|
|
|
|
|
|
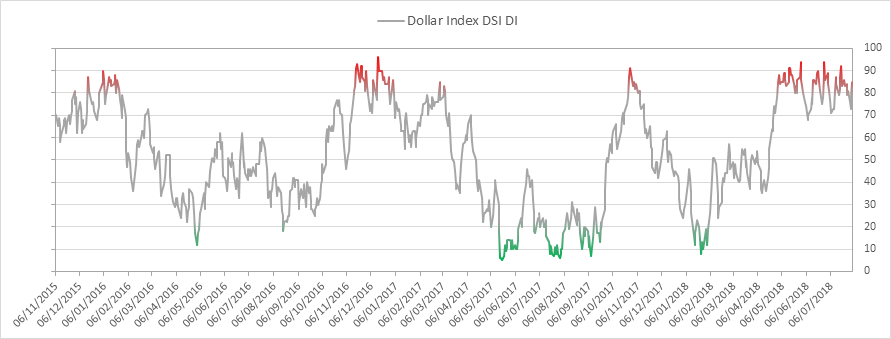
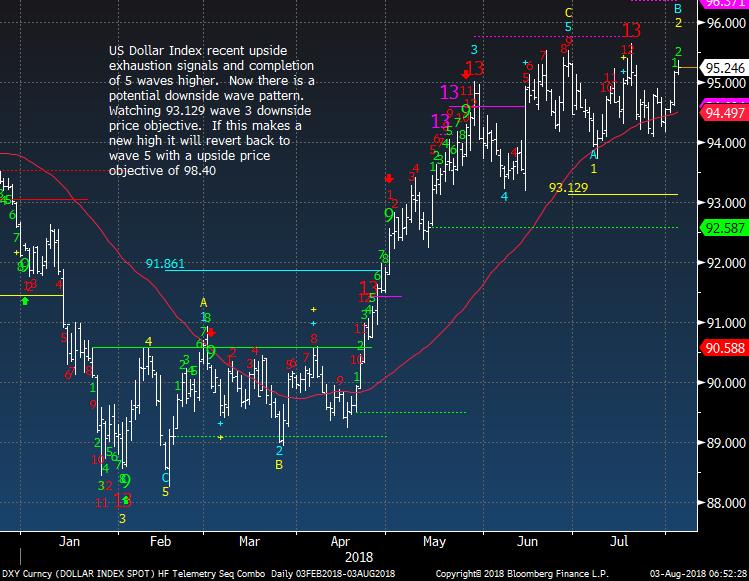
US Dollar bullish sentiment is at 85% and remains extreme.
|
|
|
|
|
US Dollar Index still is in a range and has backed off to 95 now
|
|
|
|
|
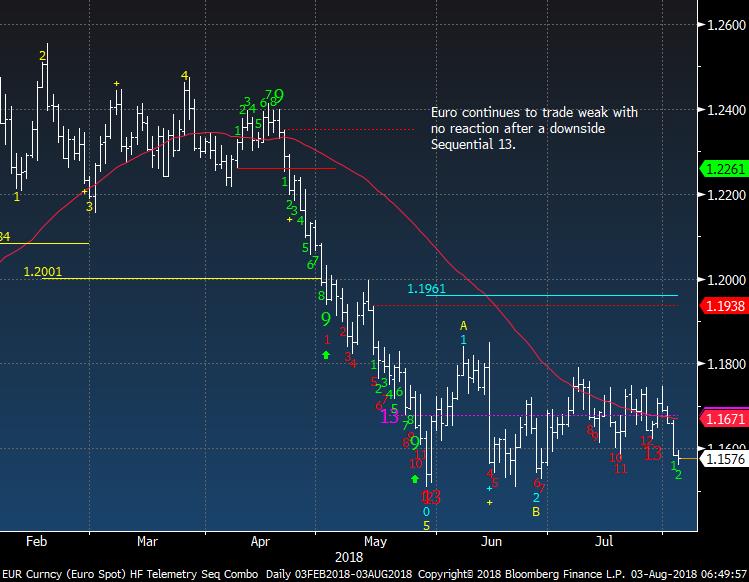
Euro bullish sentiment is at 31% and has been dipping
|
|
|
|
|
Euro Spot did not get a reaction after the downside 13 and is testing the lower end of the recent range
|
|
|
|
|
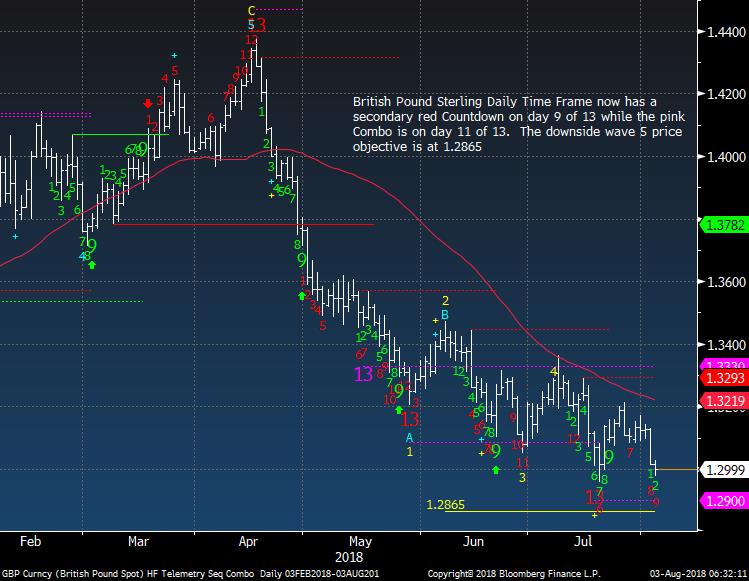
British Pound is on day 9 of 13 with a secondary Countdown
|
|
|
|
|
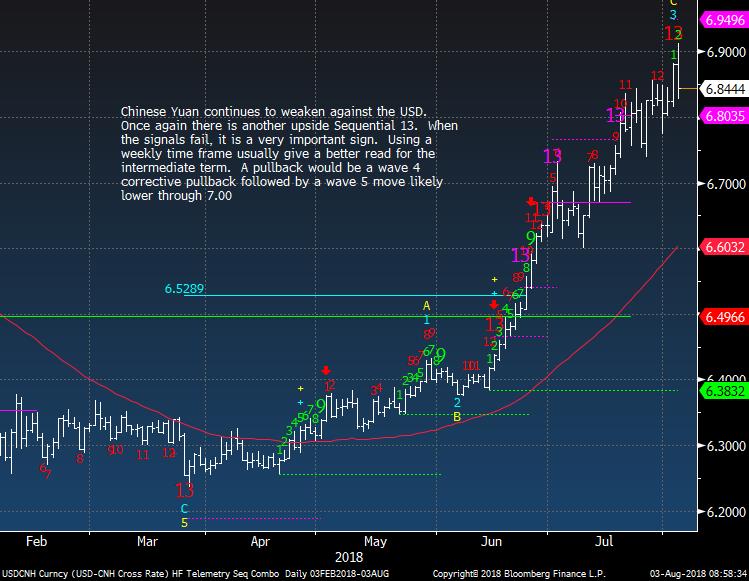
Chinese Yuan moved under 6.90 today and bounced after the PBOC news
|
|
|
|
|
|
|
|
|
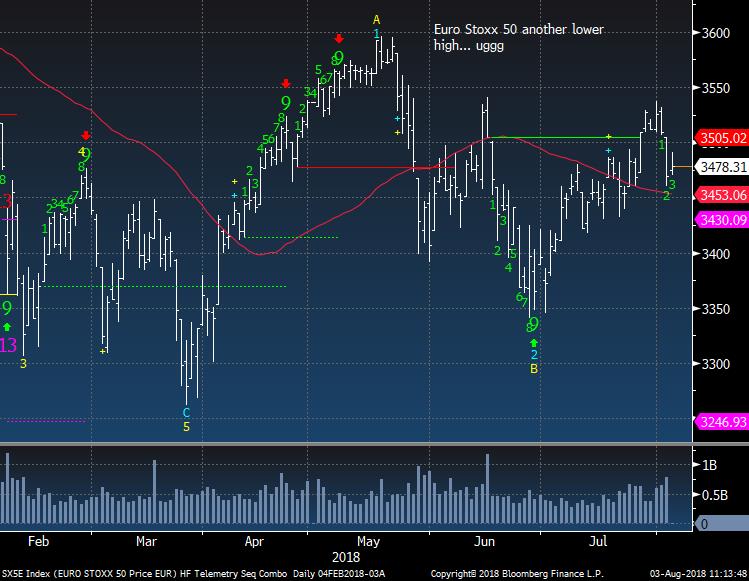
Euro Stoxx 50 up slightly today but well off highs. Let's see if it can hold the 50 day.
|
|
|
|
|
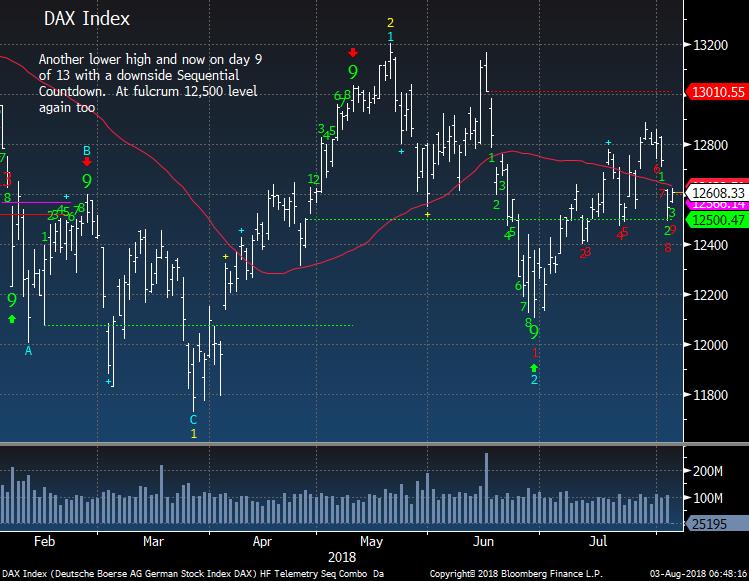
German DAX did break the 50 day and is on day 9 of 13 with a downside Countdown
|
|
|
|
|
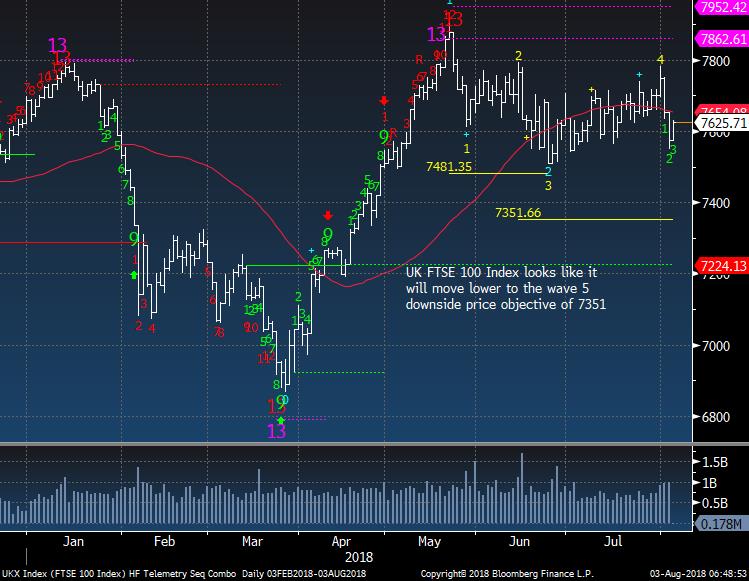
UK FTSE up today but below yesterday's high Still looks lower
|
|
|
|
|
|
|
|
|
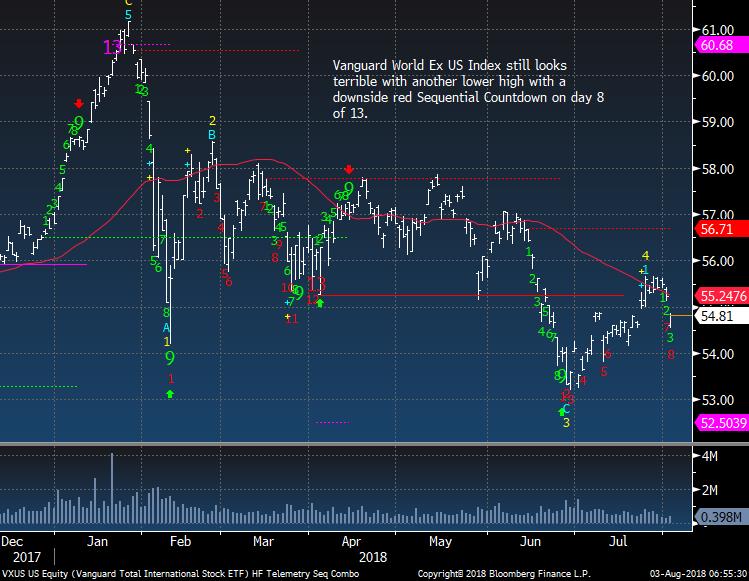
Vanguard World (ex US) still looks terrible
|
|
|
|
|
|
|
|
|
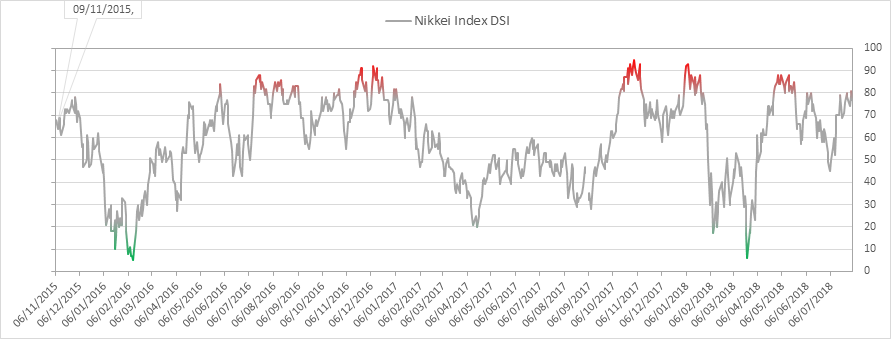
Nikkei bullish sentiment is at 77%
|
|
|
|
|
Nikkei sideways despite the upside red Countdown.
|
|
|
|
|
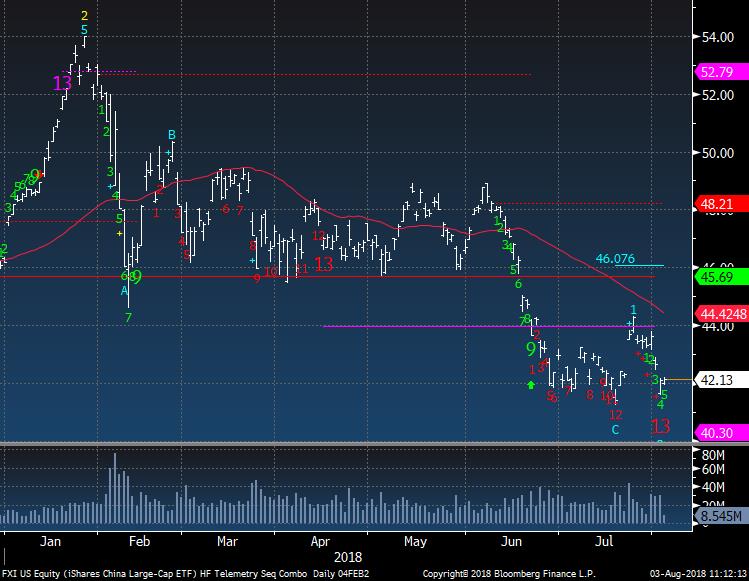
FXI Hong Kong / China ETF has a downside exhaustion Countdown 13 and I am soon going to make a call to buy a 2.5% sized position.
|
|
|
|
|
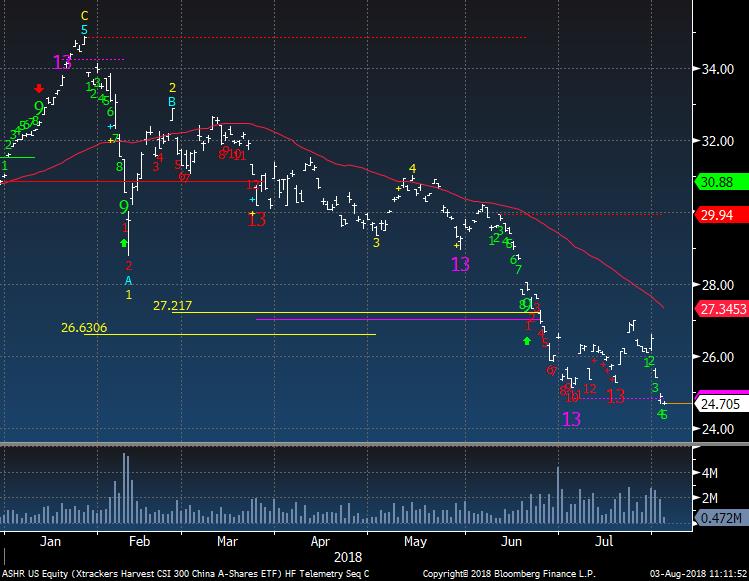
China A Share ETF a new low and struggling
|
|
|
|
|
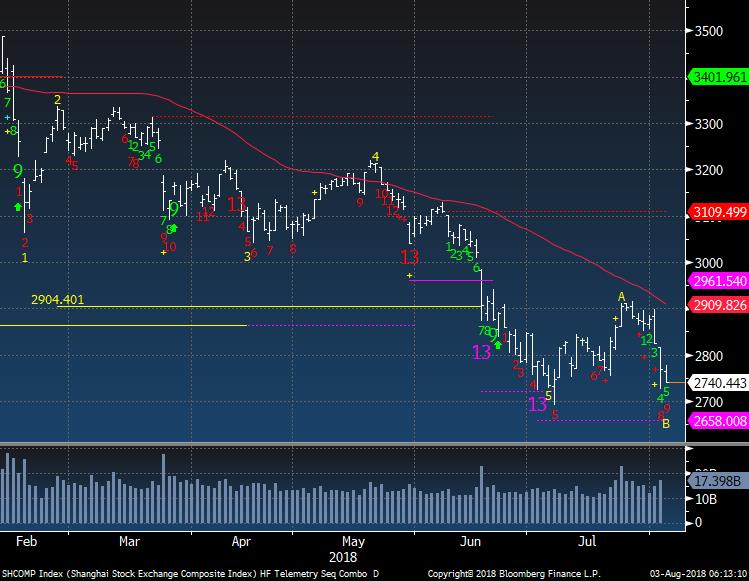
Shanghai Composite did get a downside red 13 however, Tom DeMark has a rule that I adjusted for this chart for the 5 vs 8. Essentially if the 5th bar is lower than the 8th bar the little +'s show up until this moves under the 5th bar close. It just is another interpretation. Bottom line for you is that this is getting close to a bottom
|
|
|
|
|
|
|
|
|
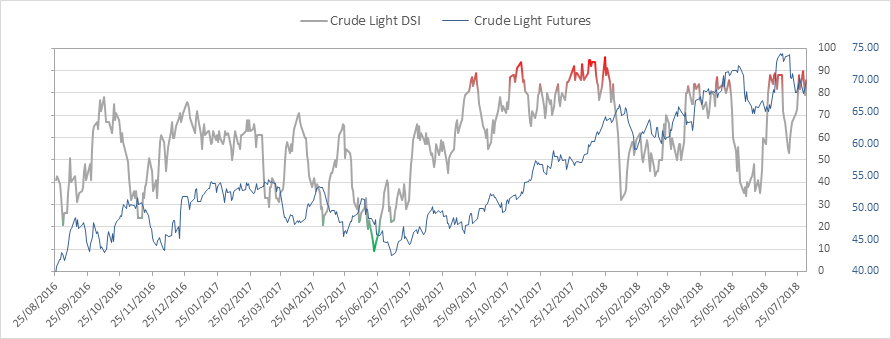
Crude bullish sentiment is at 86% and is extreme
|
|
|
|
|
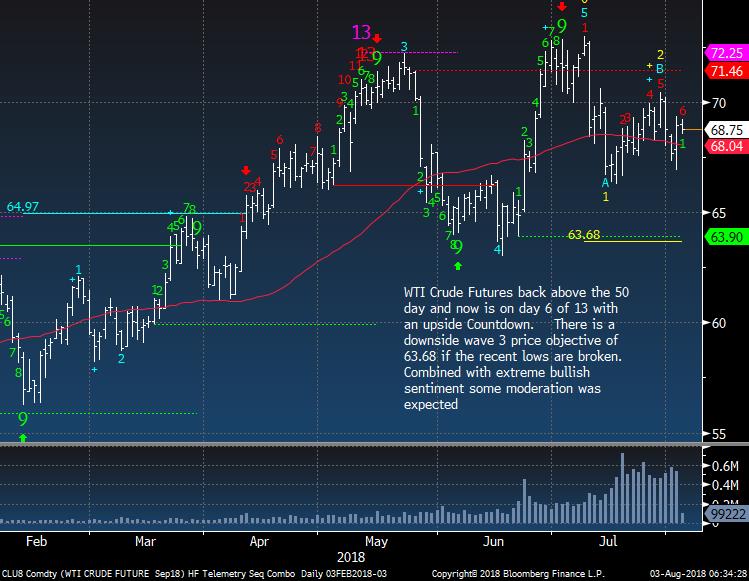
Crude has been going sideways near the 50 day. Potential for a break to the wave 3 price objective of 63.68
|
|
|
|
|
|
|
|
|
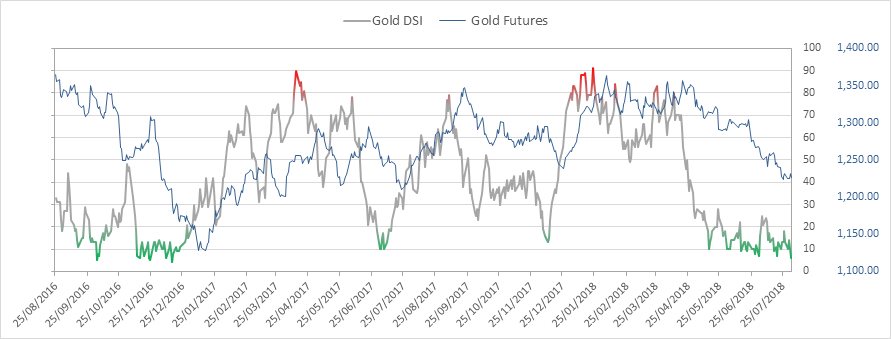
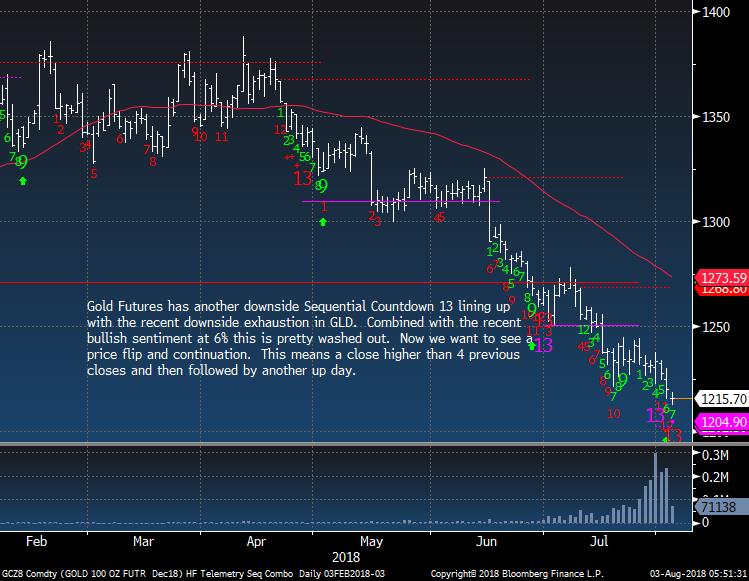
Gold bullish sentiment is at 6% and this is the lowest reading since 4% 12/15/16
|
|
|
|
|
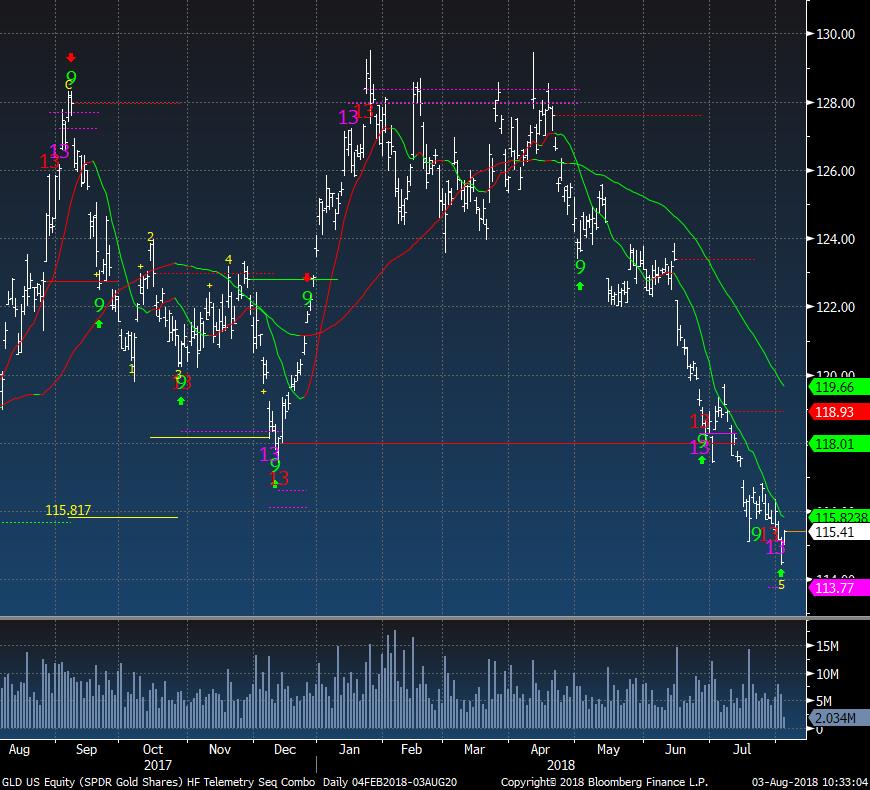
Gold Futures did get the downside Countdown 13 today
|
|
|
|
|
GLD had the exhaustion signals last week. It is trading up 70 bps today
|
|
|
|
|
|
|
|
|
Bond bullish sentiment is at 48% and remains near the mid point
|
|
|
|
|
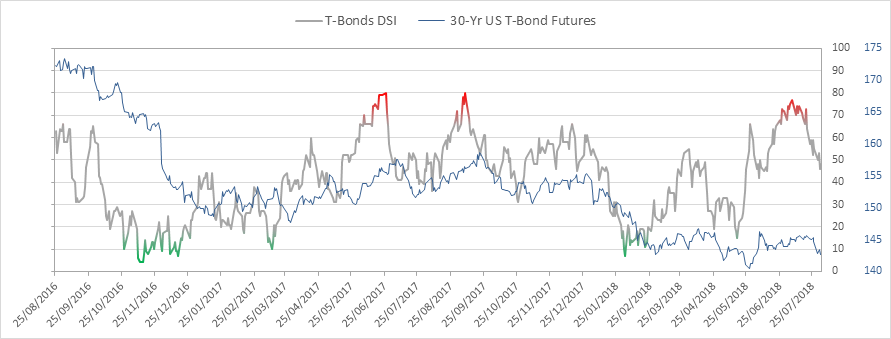
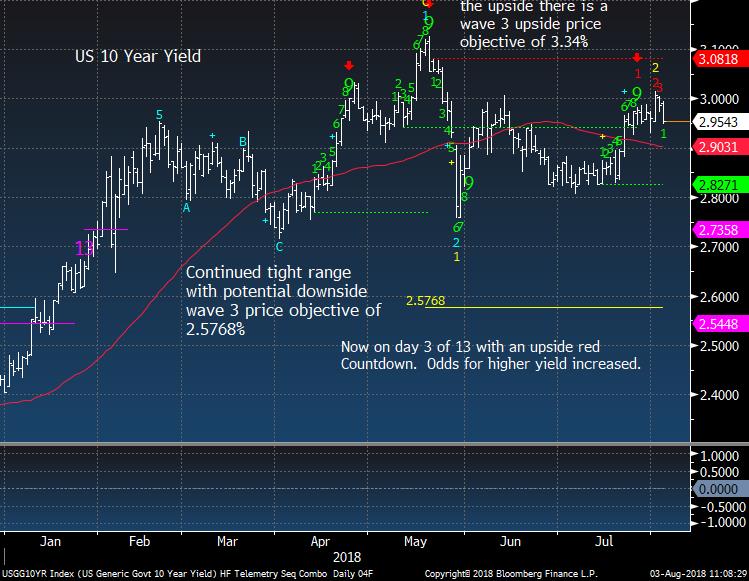
US 10 year yield has some mixed signals. Upside red Countdown on day 3 of 13 but a price flip down today (green 1) There is also a huge COT speculator short positioning that makes me believe that bonds could rally. I need more time to see how this plays out to make a solid call
|
|
|
|
|
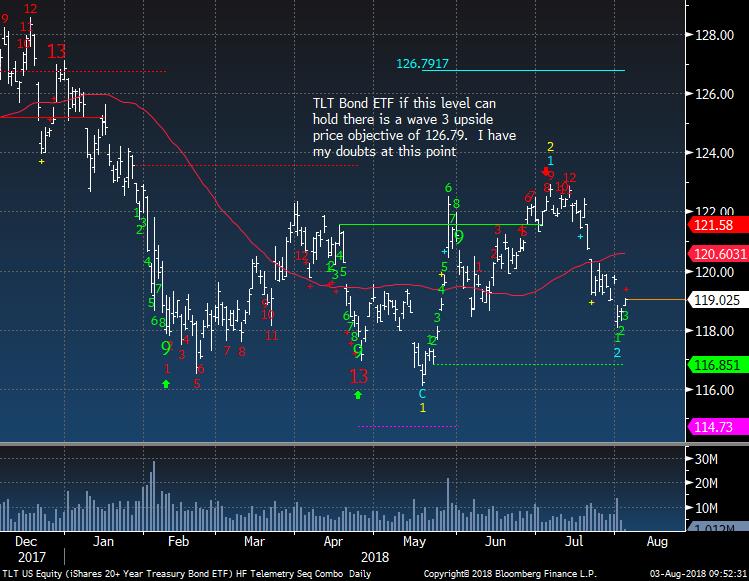
TLT Bond ETF is up today and might be trying to make a higher low.
|
|
|
|
|
|
|
DEMARK SCREENS - Daily, Weekly, Monthly Upside/Downside Exhaustion Signals
|
|
|
Daily/Weekly DeMark upside/downside exhaustion signals (Sequential) weekly updated on Monday's and monthly on the first day of the new month. Price flips occur when a stock closes higher/lower than four previous closes and increases conviction of a price turn.
The upside 13's are sell signals and downside 13's are buy signals. Price flip's are confirmation signals that increases potential for a price trend change. For example, if you are long a stock and there is an upside 13, you will want to take cautious action by selling down or out of a position. If initiating a short sale with the upside 13's, we tend to start with a 1/2 size and add with the downside price flip. The opposite is true for when there are downside 13's. Take a 1/2 size position
and add with the upside price flip. The DeMark Indicators are designed to assist the user with buying into weakness and selling into strength to anticipate trend exhaustion. Selling into a rally and buying into a decline often afford the opportunity to exit a trade without too serious a loss if wrong.
S&P 1500 Universe:
DAILY UPSIDE 13: BMY, INDB, KRG, LQDT, LSI, PG, RMD, TTMI
DAILY DOWNSIDE 13: SNX, SPN
DAILY UPSIDE WITH PRICE FLIP REVERSAL DOWN: ENDP, FTI, PRGO, UFCS, VVI, WEC
DAILY DOWNSIDE WITH PRICE FLIP REVERSAL UP: AREX, FL, MCK, QEP, SNX, SPAR, TCBI, UMBF, WY
Updated: 7/30/18
WEEKLY UPSIDE 13: AIN, AME, AVAV, AXP, COST, FARO, GIII, HRC, KO, LGND, NBTB, NTRS, POL, PRI, RBC, SHW, TSS, WTS
WEEKLY DOWNSIDE 13: GFF, HOG, LB
Updated: 8/1/18
MONTHLY UPSIDE 13: AIZ, ATR, BIO, CBU, CDNS, CMS, CSX, DGX, EE, FCN, FIX, GTY, HAE, HAS, IDXX, IEX, KSU, MA, NI, NPK, PTC, RLI, ROL, WEC
MONTHLY DOWNSIDE 13: CIR, HIBB
Euro Stoxx 600 Universe:
DAILY UPSIDE 13: NONE
DAILY DOWNSIDE 13: BAS GR, BKT SM, NK FP, WEIR LN
DAILY UPSIDE WITH PRICE FLIP REVERSAL DOWN: DG FP, DNB NO, ISAT LN, MF FP, SAN FP, SEBA SS, SESG FP
DAILY DOWNSIDE WITH PRICE FLIP REVERSAL UP: NONE
Updated: 7/30/18
WEEKLY UPSIDE 13: ALFA SS, KGF LN, NESTE FH, NZYMB DC
WEEKLY DOWNSIDE 13: ABF LN, GNK LN
Updated:
8/1/18
MONTHLY UPSIDE 13: TEMN SW
MONTHLY DOWNSIDE 13: CO FP, GETIB SS,
RXL FP, TALK LN
|
|
|
Unsubscribe me from Hedge Fund Telemetry
Hedge Fund Telemetry LLC, P.O. Box 4675, Greenwich, CT 06861, United States
CONFIDENTIALITY NOTE and DISCLAIMER: This message is for the named person's use only. It may contain confidential, proprietary or legally privileged material. No confidentiality or privilege is waived by any accidental or unintentional transmission. If you receive this message in error, please immediately delete it and all copies of it from your system, destroy any hard copies and notify the sender. You must not, directly or indirectly, use, disclose,
distribute, print or copy any part of this message if you are not the intended recipient. Hedge Fund Telemetry LLC. cannot guarantee the confidentiality of the material transmitted; therefore, information of a sensitive or confidential nature should not be transmitted. There is risk in trading markets. Hedge Fund Telemetry LLC reports are based on information gathered from various sources and believed to be reliable, but are not guaranteed as to accuracy and completeness. The information is subject to change without notice and Hedge Fund Telemetry LLC has no obligation to provide any updates or changes. Hedge Fund Telemetry LLC is providing this data for informational and educational purposes and does not believe that it is sufficient to base an investment decision on. This information should not be regarded as a solicitation or recommendation of any particular security or to engage in any trading strategy. One should always check with your licensed financial
advisor to determine suitability of any investments.
|
|
|
|
|