|
|
|
|
|
|
|
|
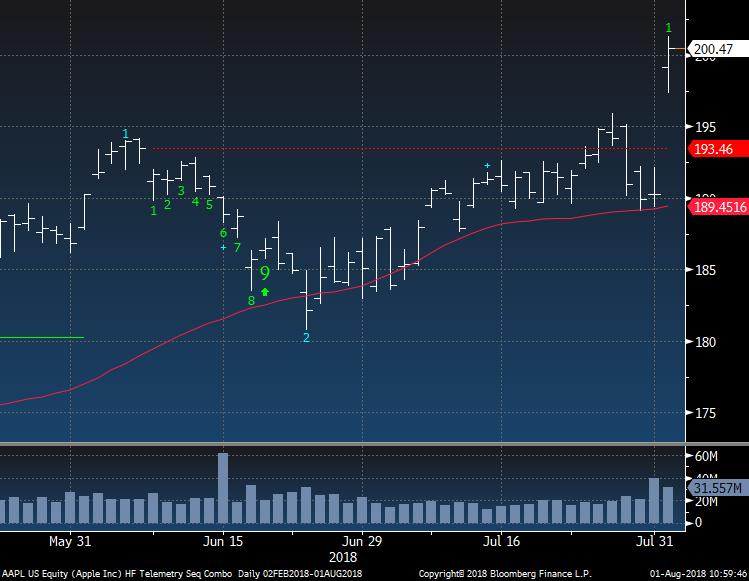
Apple delivered a better than expected earnings report and the stock lifted 5%. It used to be a product driven company full of sizzle but today it's a value, buyback, dividend story and now is has a $1 trillion dollar market cap. One Trillion Dollars! Perhaps this is the Trillion Dollar Market Top. I didn't expect such a good report although I didn't expect a miss. I covered my Apple short with a 5% loss. I then moved into XLK Technology ETF as overall the group has been
showing signs of weakness. I did the same covering Citi and rolled into XLF Financials ETF short. I could be covering at the high but would rather diversify as I do not like the action in the market headed into the weaker seasonal period.
The potential bigger news today is how the US 10 year yield lifted above 3% again but is now a touch below. I've leaned long bonds but had upside and downside targets if the recent range breaks. Be sure to get to the bond section below. Today the Fed will likely not make any changes to the Fed Funds Rate but at the press conference Fed Chairman Powell could make it clear they will continue to raise and perhaps he'll have words that show more urgency. I don't think the market will react well if that happens. Lastly, the tariff concerns are not going away any time soon with Trump and China throwing back and forth some more threats. The ISM Manufacturing report today missed expectations with respondents saying they were concerned about tariffs. Stay nimble as this is a potential huge issue.
- US Markets - Sentiment, Daily and 60 minute tactical views - still seeing some stalling action
- Hedge Fund Telemetry Trade Ideas - Made a bunch of changes and adds today
- Quantitative
Tightening Schedule
- Apple $1 Trillion Dollars
- Sectors I am watching very close
- A few recent trade ideas
- Currency Update
- European Market Update
- Global Market Update
- Asian Market Update
- Crude Update
- Gold Update
- Bond Update
- DeMark Screens - Daily, Weekly, Monthly upside/downside exhaustion signals within the S&P 1500 and Euro Stoxx 600
|
|
|
|
|
Here's a link to the Hedge Fund Telemetry market sentiment page with 40 charts of sentiment including equities, bonds, currencies, and commodities updated each day.
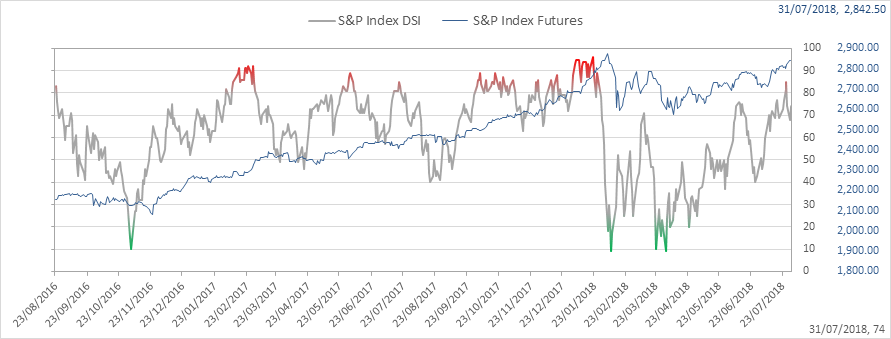
SPX bullish sentiment is at 74% and remains elevated
|
|
|
|
|
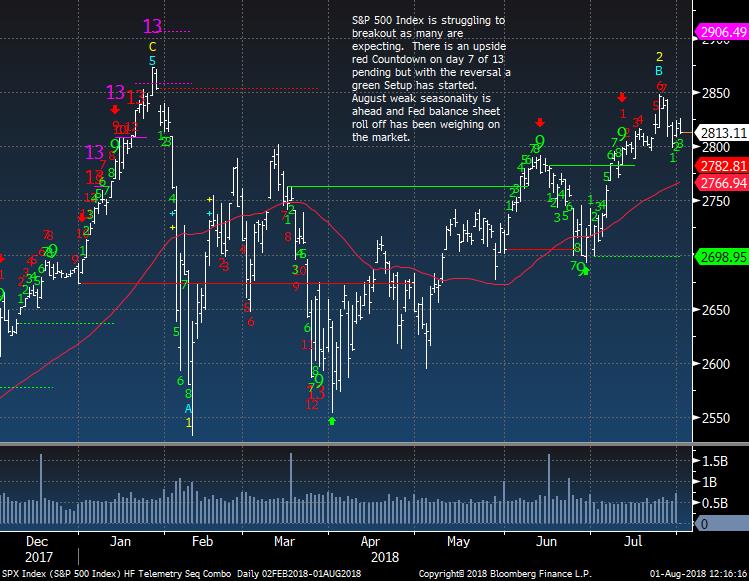
SPX daily has stopped going up and still holds 2800
|
|
|
|
|
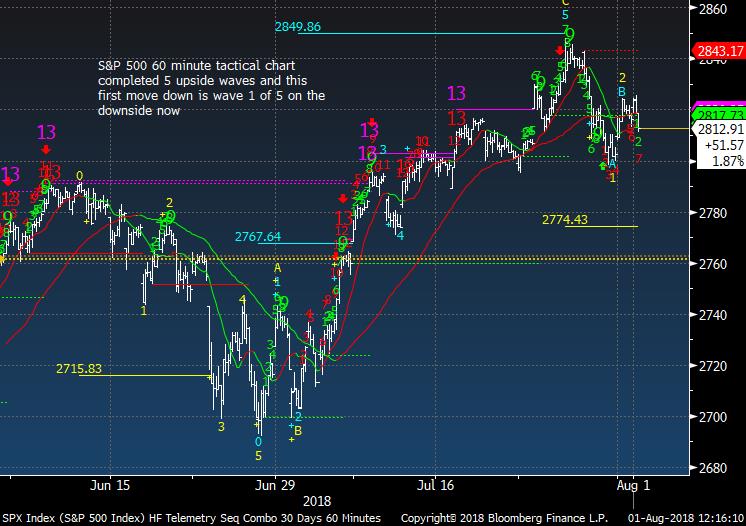
SPX 60 minute tactical time frame peaked a few days ago and has a downside wave 3 price objective of 2774
|
|
|
|
|
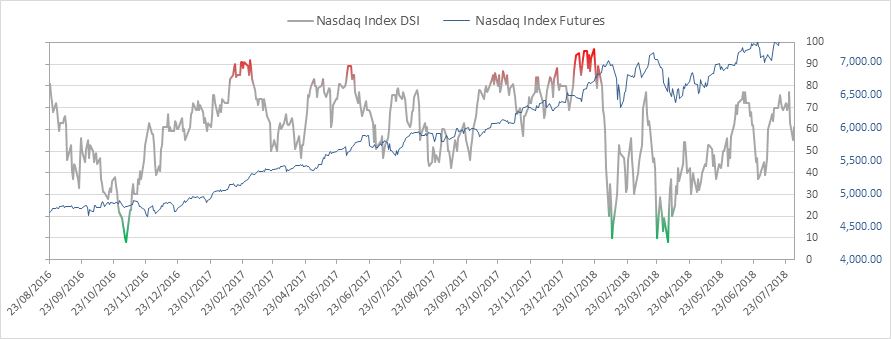
Nasdaq bullish sentiment is at 61%
|
|
|
|
|
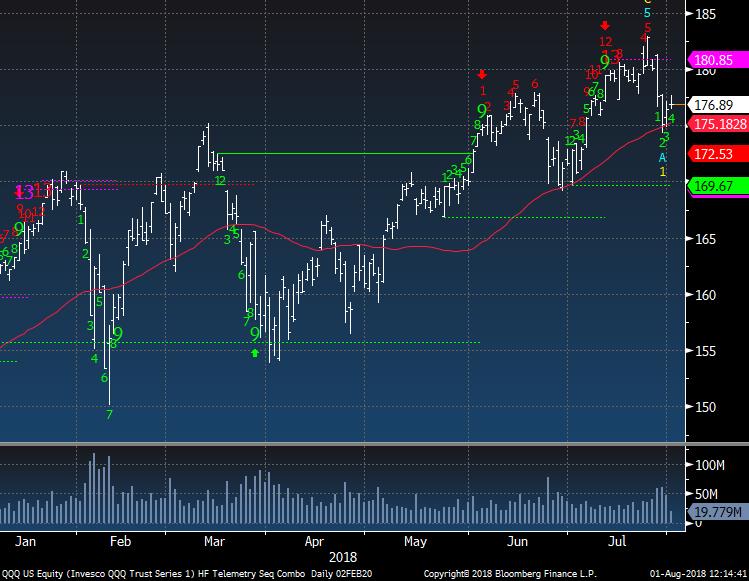
QQQ is holding the 50 day and despite Apple's big move not much progress on the upside
|
|
|
|
|
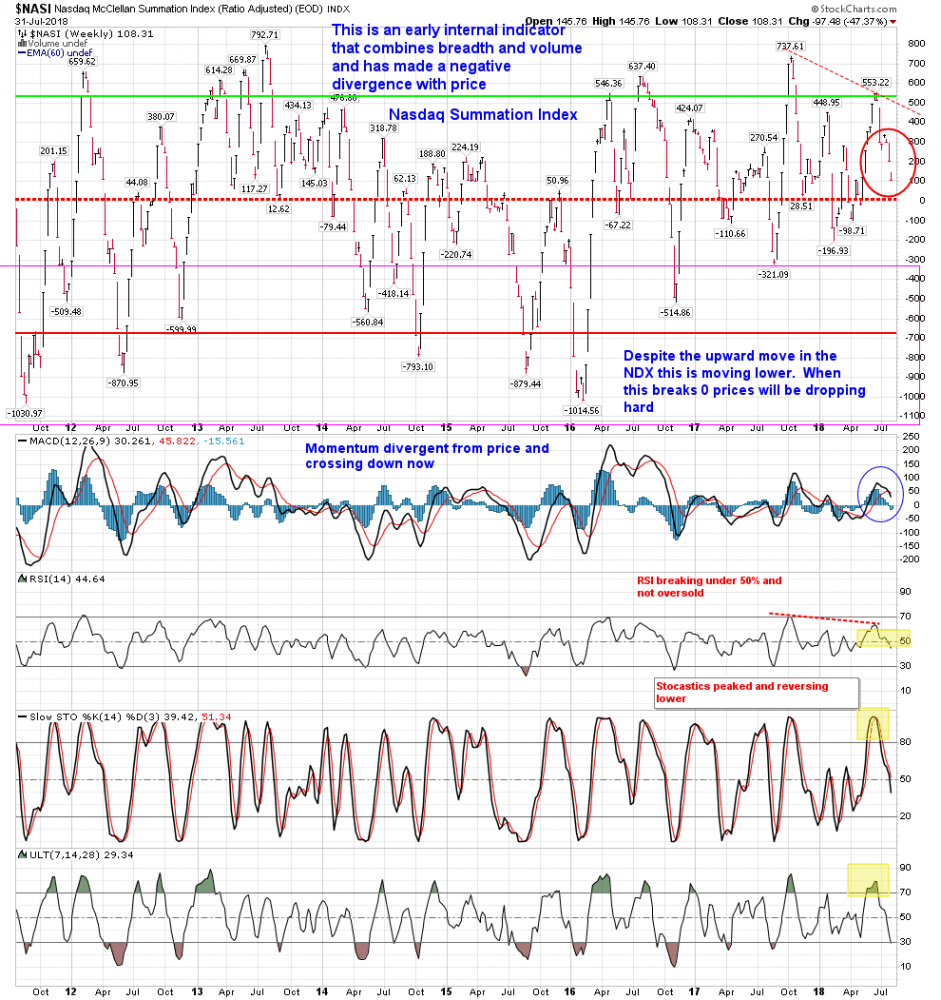
Nasdaq Summation Index continues to drop. When this breaks zero it will be pretty clear the markets are at risk to the downside
|
|
|
|
|
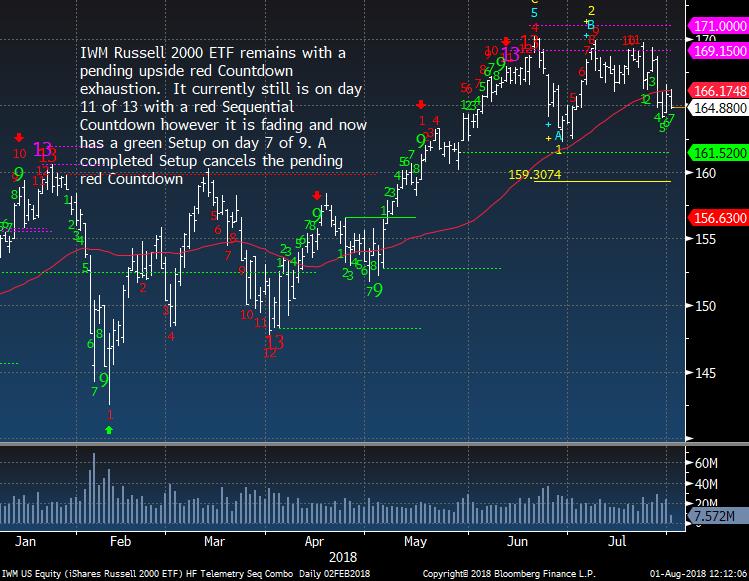
IWM Russell 2000 on today's lows and still is under the 50 day. There is a wave 3 downside price objective of 159.30
|
|
|
|
|
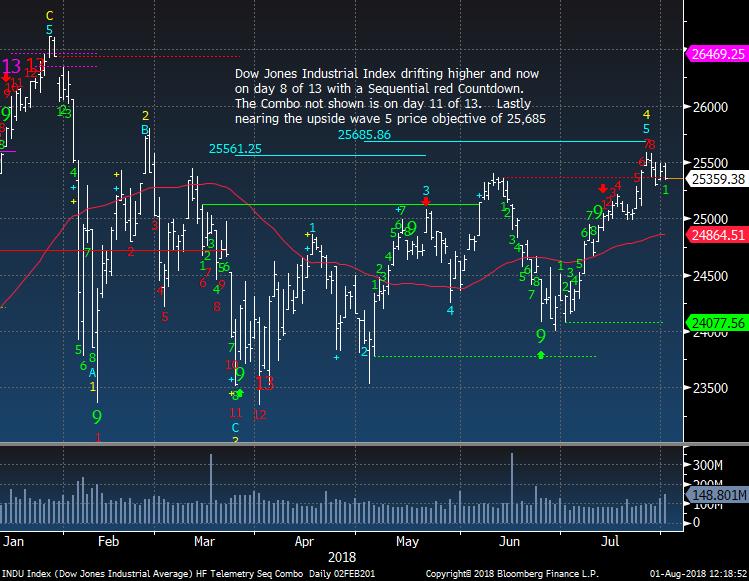
Dow Jones still has an upside red Countdown but today the index is trading lower than 4 previous days and that's a price flip down. (green 1)
|
|
|
|
|
|
|
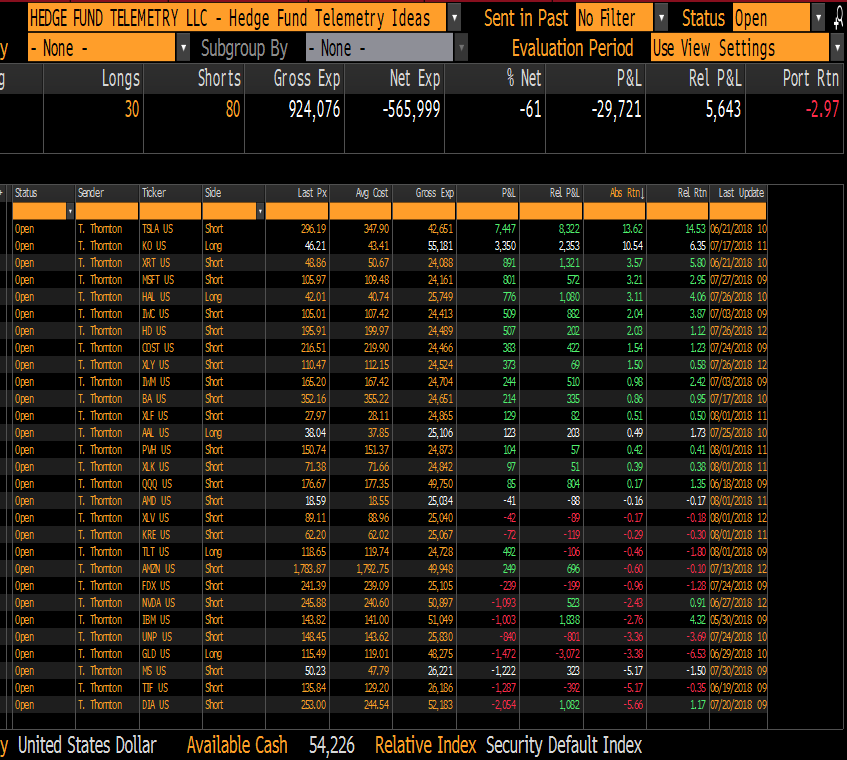
Hedge Fund Telemetry Trade Ideas
|
|
|
Trade Ideas - closed GT long +6.5%, LULU short +6%, C short -9%, AAPL short -5%, GOOGL short +2%. Added short PVH, AMD, XLV, KRE, XLF, XLK 2.5% size
|
|
|
|
|
|
|
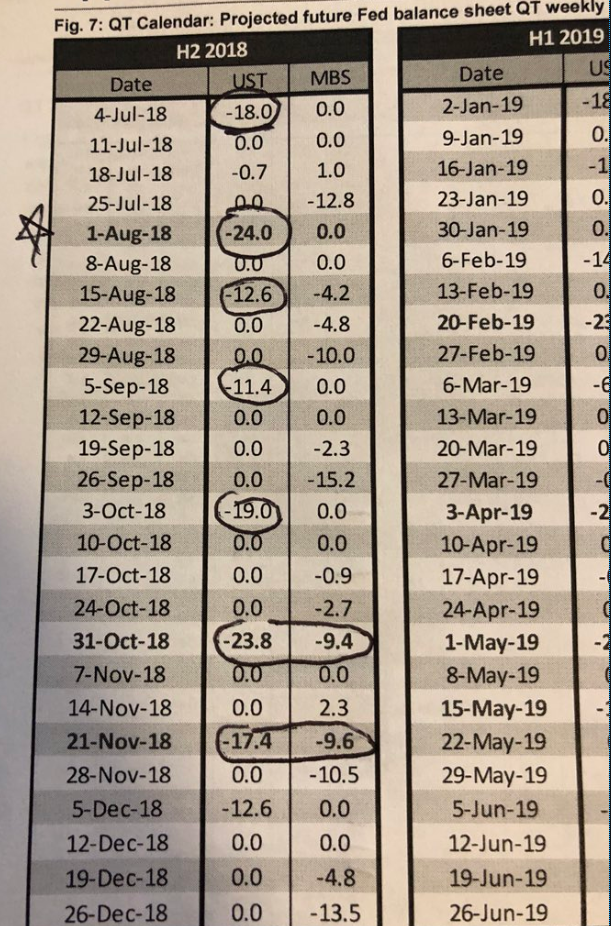
Quantitative Tightening Schedule
|
|
|
This was sent to me by my Goldman derivative trader with a schedule of QT. Markets potentially have been selling off late in the month due to this
|
|
|
|
|
|
|
|
|
Apple gapped up and I covered. No need to fight this despite believing this will likely fade in the coming days
|
|
|
|
|
|
|
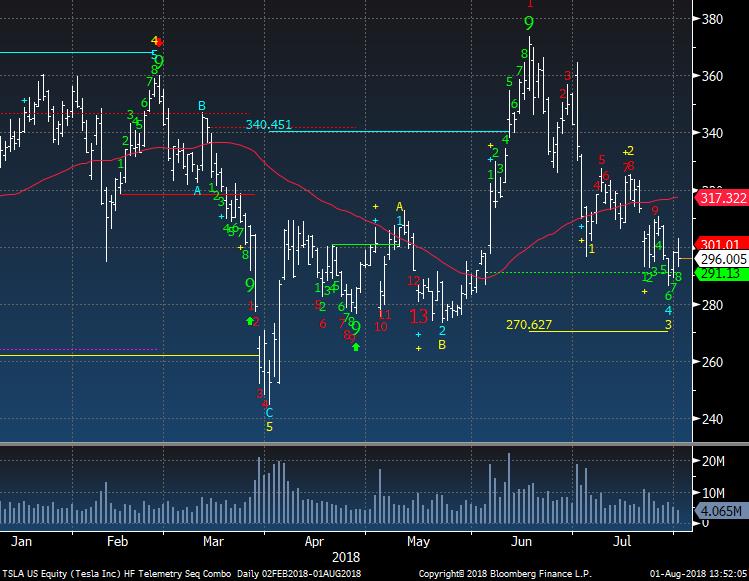
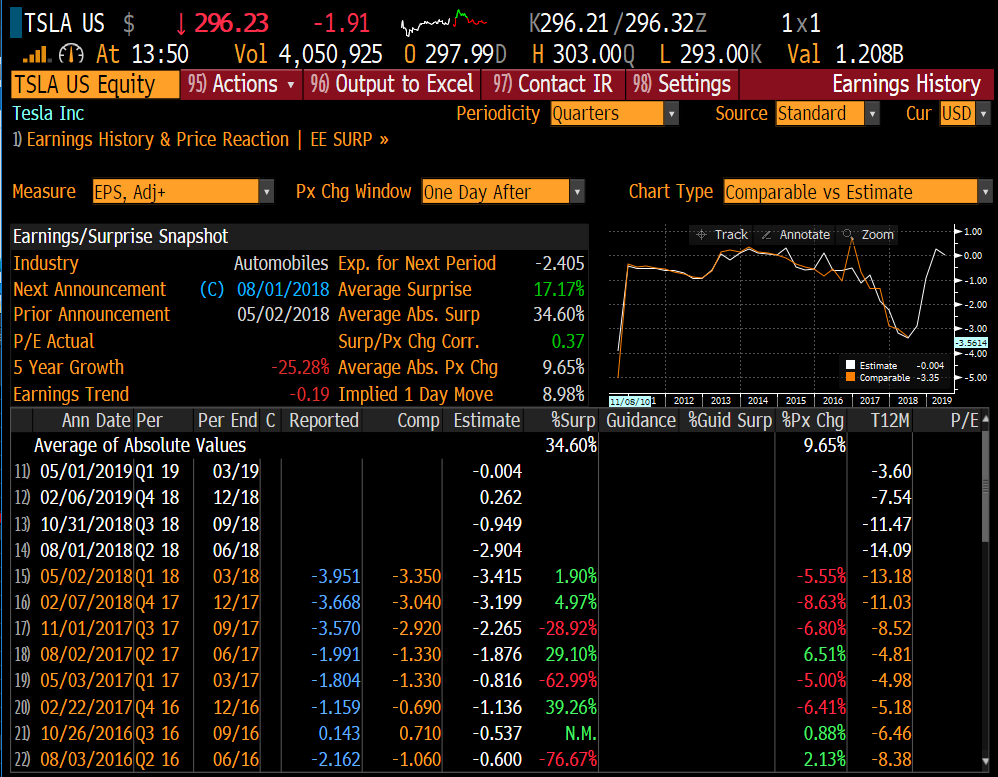
Tesla Ahead of earnings today
|
|
|
Tesla reports this afternoon with a conference call followed at 5:30. The stock has been under pressure with all of the crazy stuff happening with the CEO erratic behavior, production problems and cash constraints. Will this be the quarter that breaks the stock or will there be some good news? I am not covering my full 5% weighted short from 347.
|
|
|
|
|
Tesla has an implied move of 9% and they have seen the stock drop after earnings 6/8 last quarters.
|
|
|
|
|
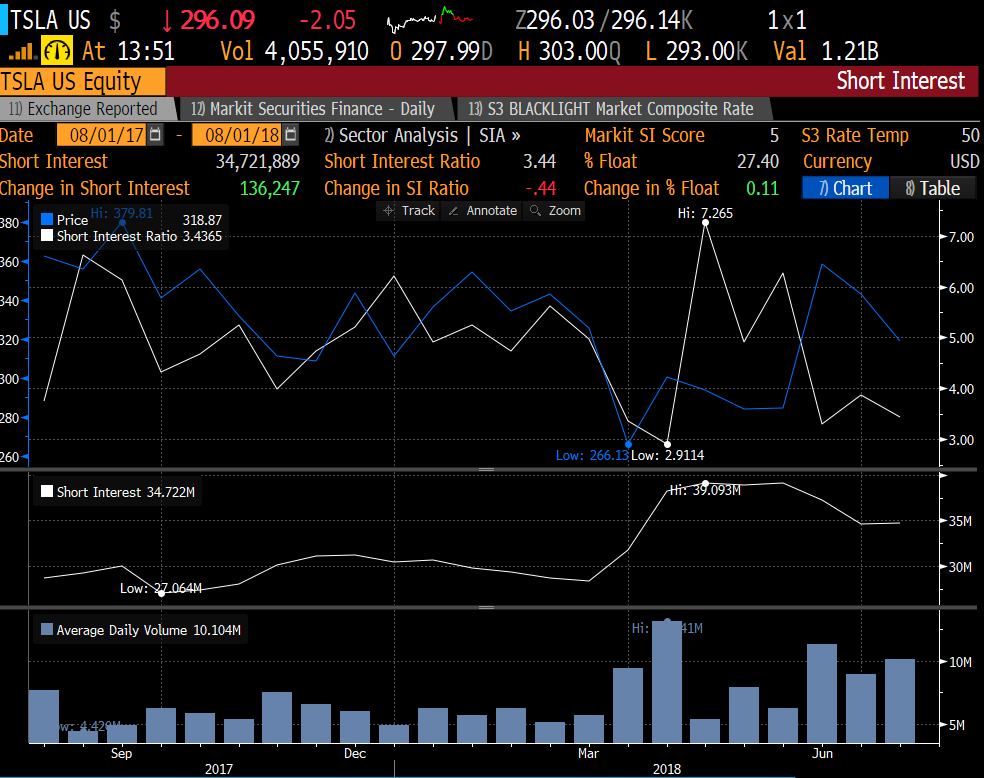
Tesla short interest is down from last quarter and the short interest ratio is much lower too. There still is a huge amount of the float short at 27%.
|
|
|
|
|
|
|
Sectors I'm watching very close
|
|
|
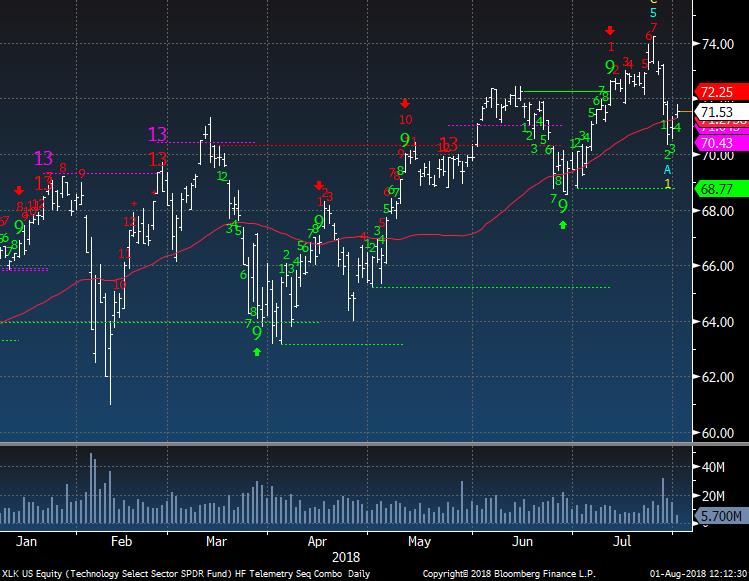
XLK Technology is not making much progress after Apple's gain. I rotated into this vs Apple as I am seeing more stocks in the sector weakening
|
|
|
|
|
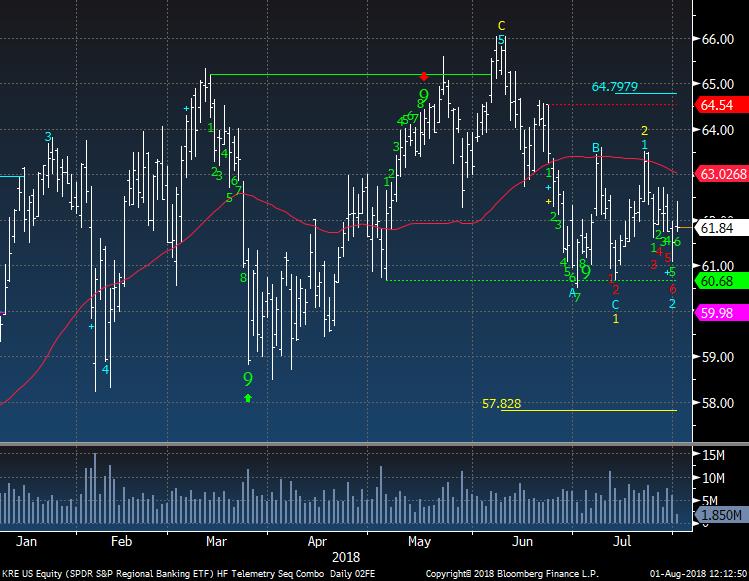
KRE Regional Banks is at risk of dropping below 60 and there is a downside red Countdown on day 6 of 13
|
|
|
|
|
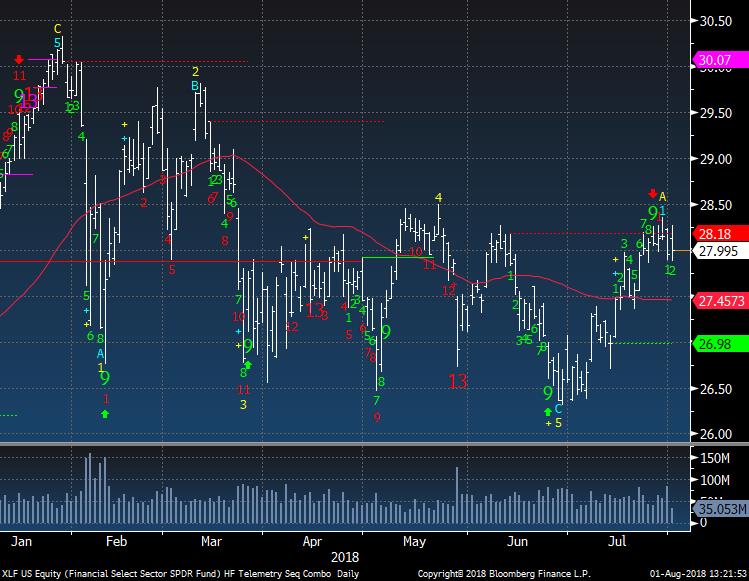
XLF Financials is at resistance with a recent Setup 9. If this moves higher above this resistance I will cover. With the recent price flip down I think we could retest the lower levels
|
|
|
|
|
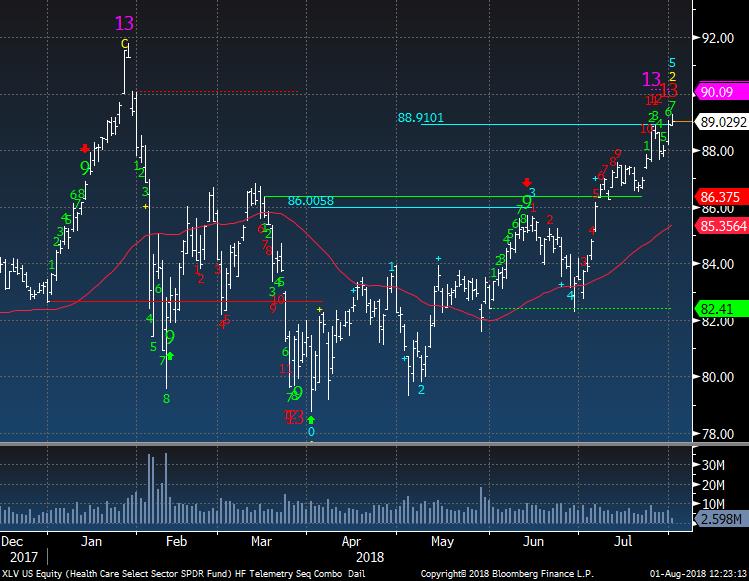
XLV Heathcare. In May I highlighted healthcare as a good place to be long as seasonality was good in the Summer. With the recent upside exhaustion signals in wave 5 I would sell if long and I'm also adding a 2.5% sized short today
|
|
|
|
|
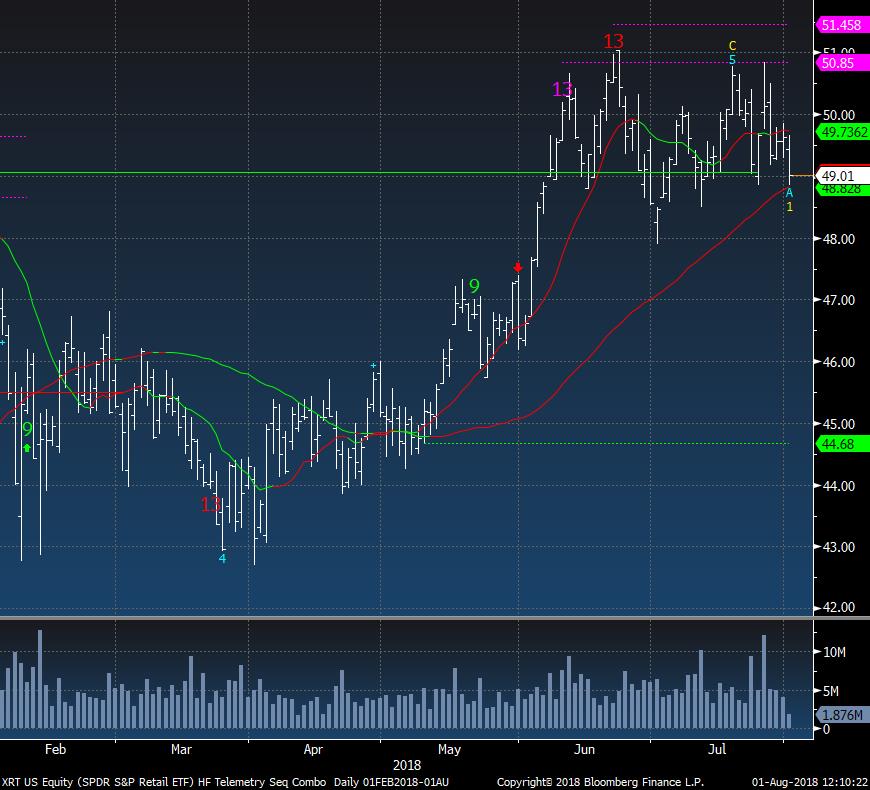
XRT Retail is at support and the 50 day moving average. I think this breaks lower and I'm short already about 3.5% higher
|
|
|
|
|
|
|
|
|
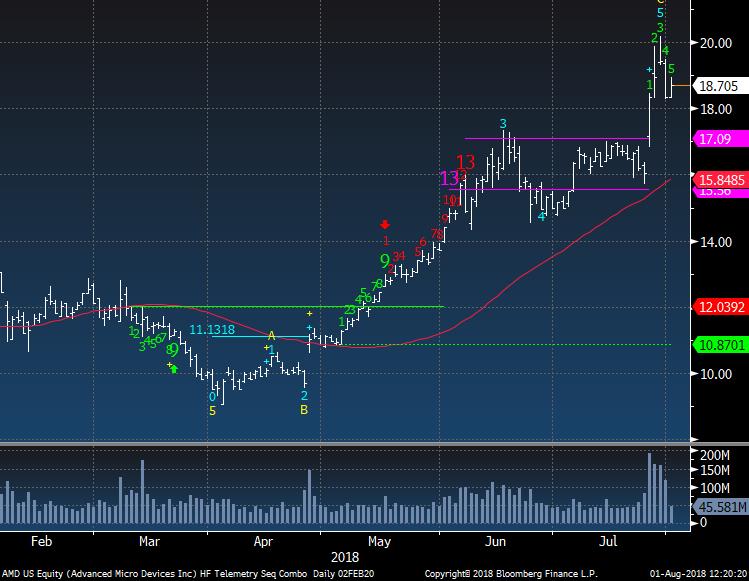
AMD is the most overbought Semiconductor on my PPO monitor at 19% above the 50 day moving average. I think there is a lot of money chasing this one and now that it is below the vwap from the earnings gap up, a little more downside and traders will sell quickly.
|
|
|
|
|
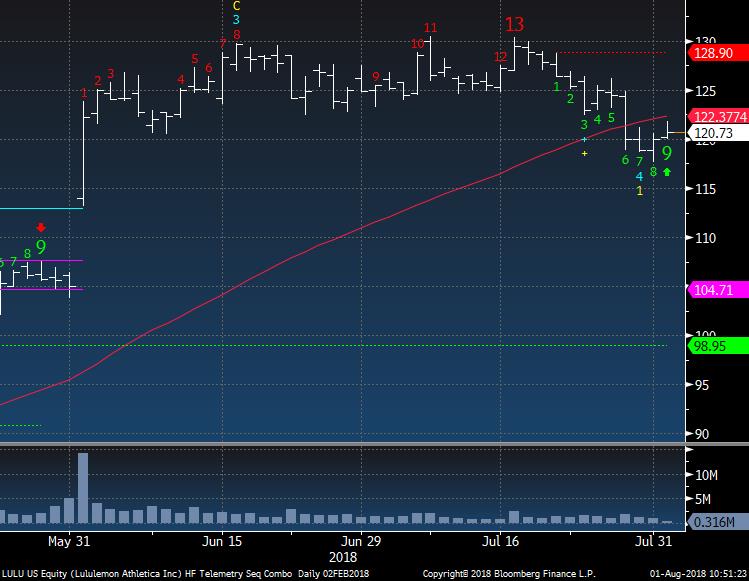
LULU was a short at the upside 13 and I took it off today with the green Setup 9. It was a nice 6% gain. I might go lower but I moved into PVH below
|
|
|
|
|
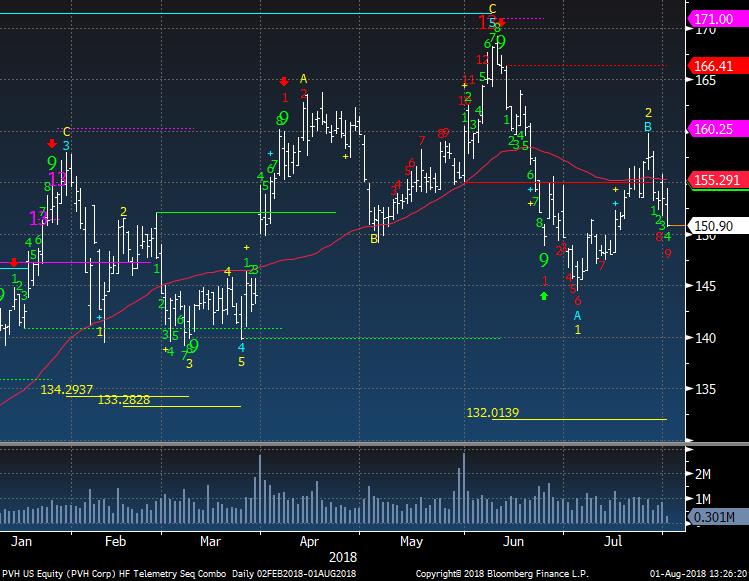
PVH made a recent lower high and has a downside red Countdown on day 9 of 13. There is a downside wave 3 price objective of 132.
|
|
|
|
|
|
|
|
|
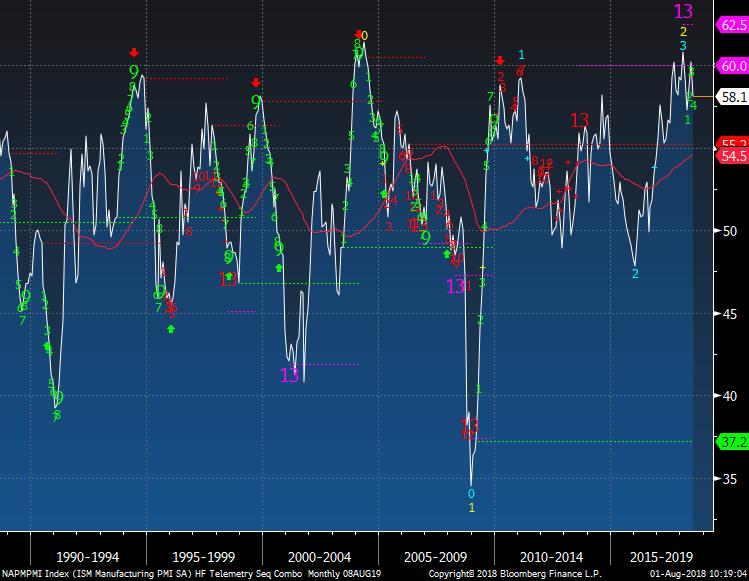
The ISM Manufacturing Survey came out today a little lighter than expectations. Bank in January this had a Combo 13 and now it has a downside green Setup on month 4 of 9.
|
|
|
|
|
|
|
|
|
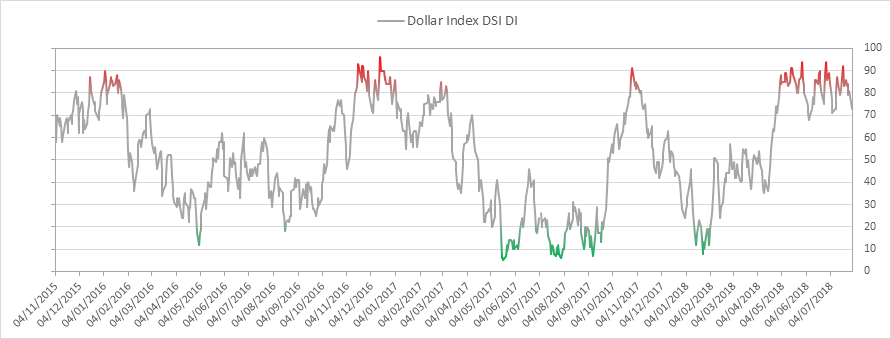
US Dollar bullish sentiment is at 73% and is the lowest since 7/10
|
|
|
|
|
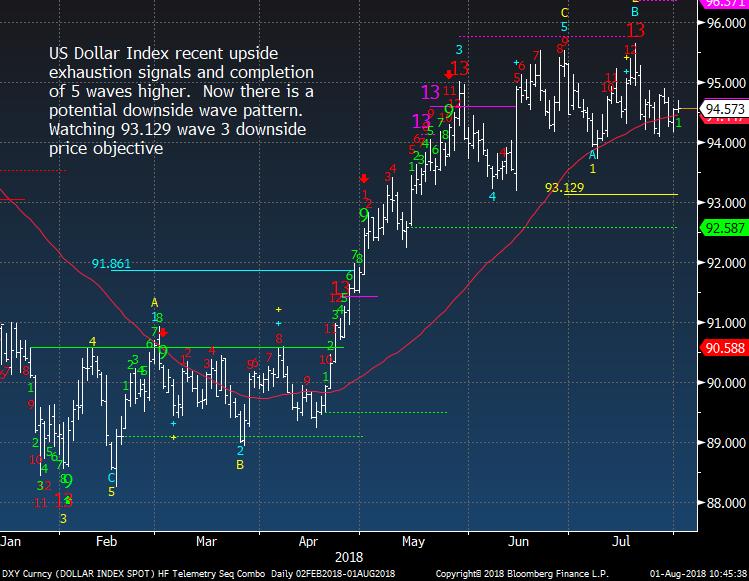
US Dollar Index remains in this range.
|
|
|
|
|
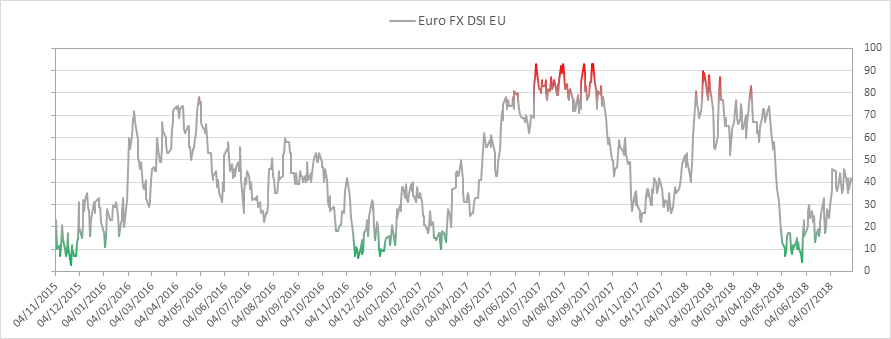
Euro bullish sentiment is at 41%
|
|
|
|
|
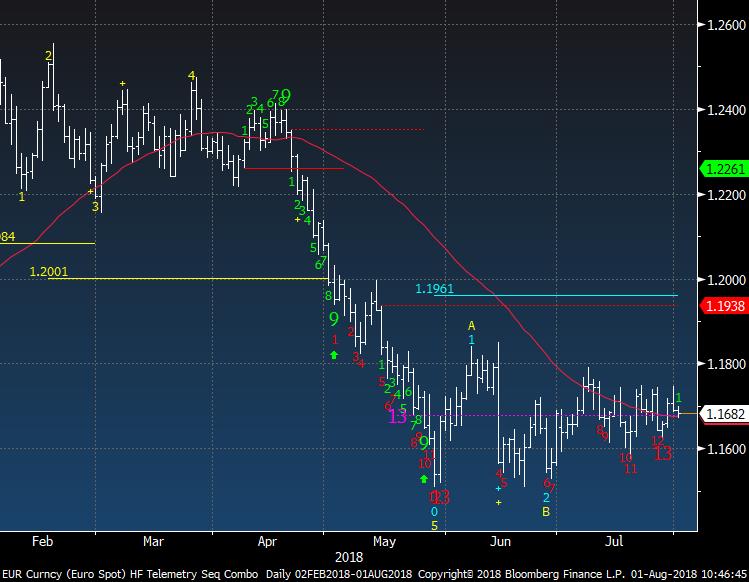
Euro Spot did get the downside Countdown 13 but has not been able to turn up.
|
|
|
|
|
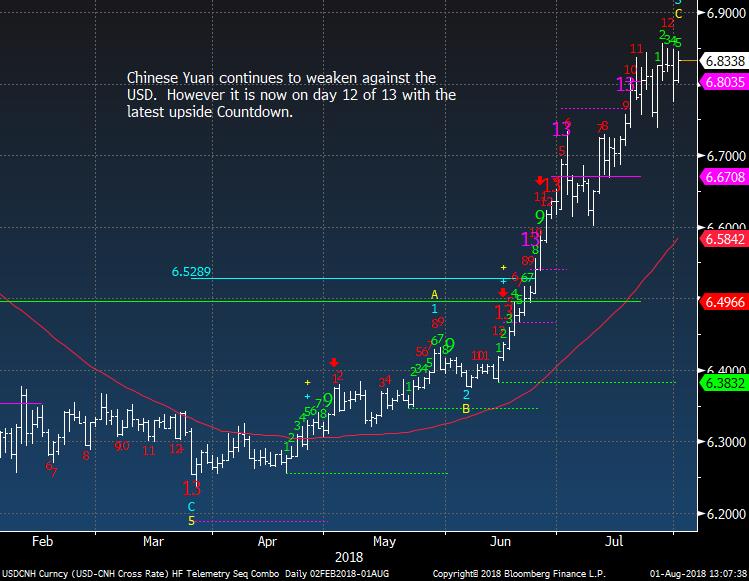
No real changes to the Yuan Countdown
|
|
|
|
|
|
|
|
|
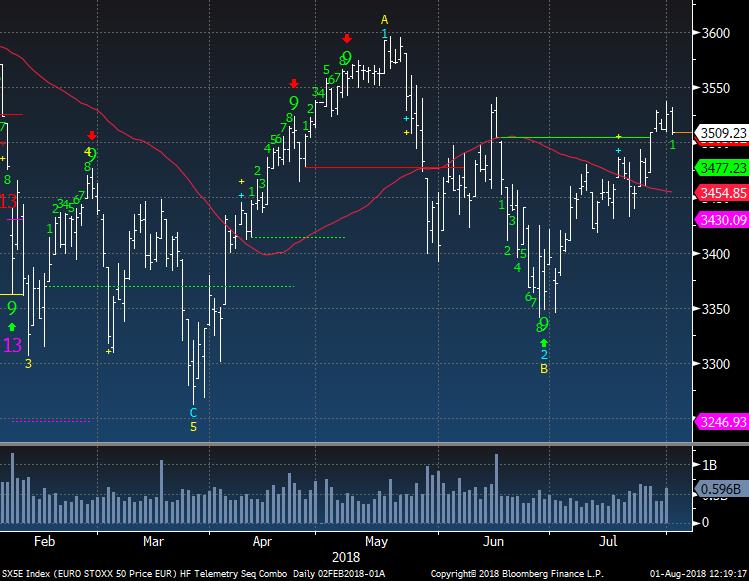
Euro Stoxx 50 reversed giving back 4 days of gains. I have tried to become more positive on this index and will remain so unless the 50 day breaks
|
|
|
|
|
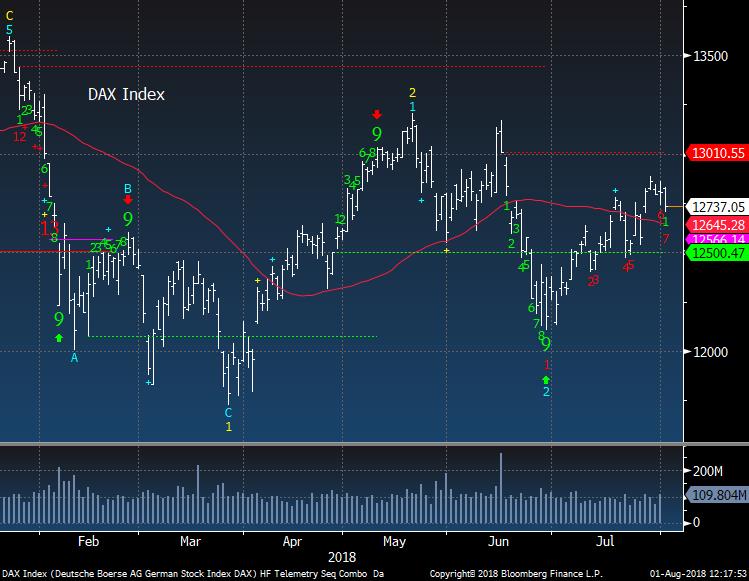
German DAX makes me concerned for the long Euro Stoxx bias as there is a downside red Countdown on day 7 of 13.
|
|
|
|
|
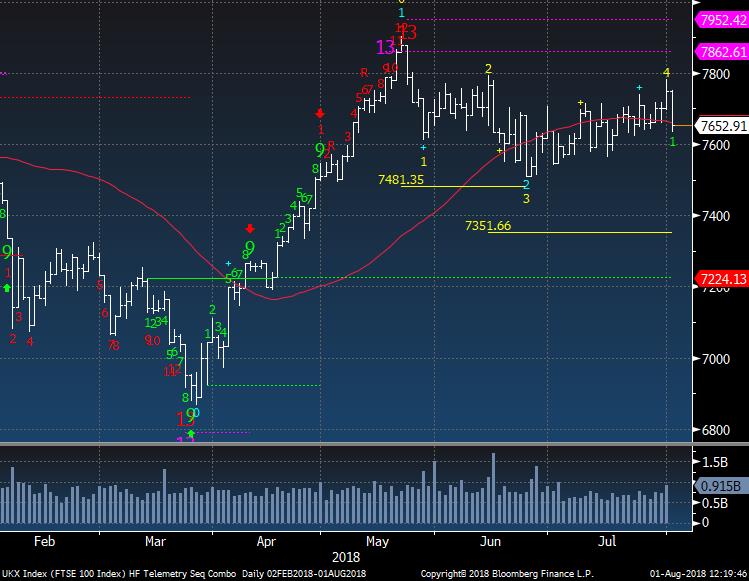
UK FTSE 100 big reversal today down and needs to hold 7600. There is a downside wave 5 price objective of 7351. The wave 3 was spot on
|
|
|
|
|
|
|
|
|
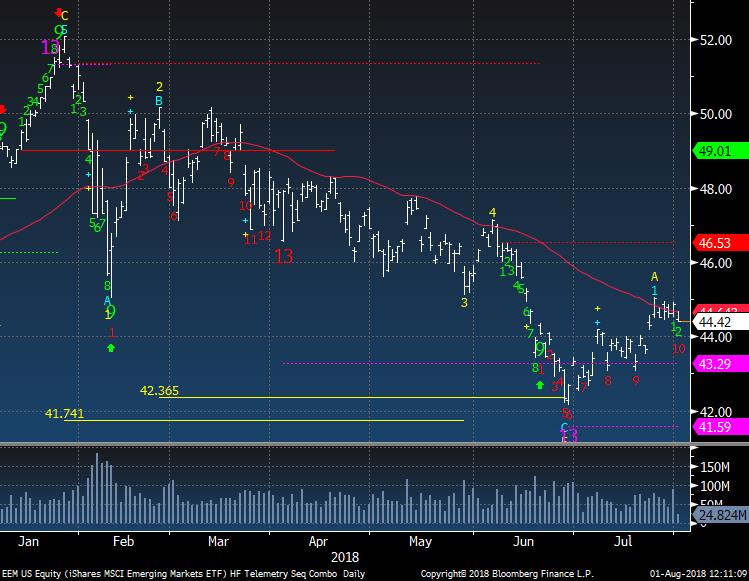
EEM Emerging Markets ETF still going sideways and now is on day 10 of 13 with a downside Countdown. Keep in mind for the 13 to trigger it has to occur under the 8th red bar's close or low
|
|
|
|
|
|
|
|
|
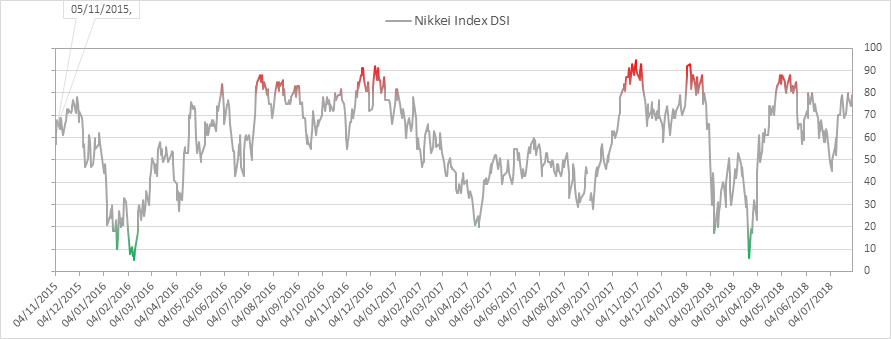
Nikkei bullish sentiment is at 79% and is nearing extreme zone again
|
|
|
|
|
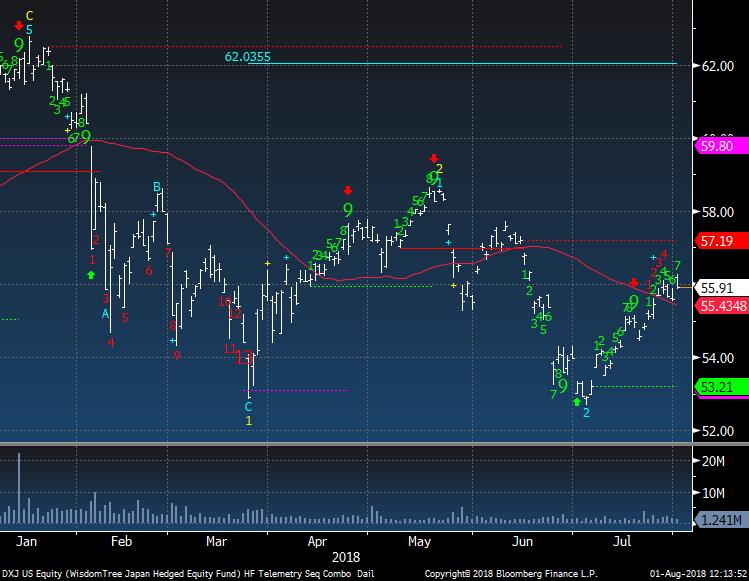
DXJ Japan ETF has made a series of lower highs and is on day 7 of 9 with a green Setup 9 and day 4 of 13 with an upside red Sequential Countdown. I would give this a try on the long side if it can hold the 50 day. Not a high conviction call
|
|
|
|
|
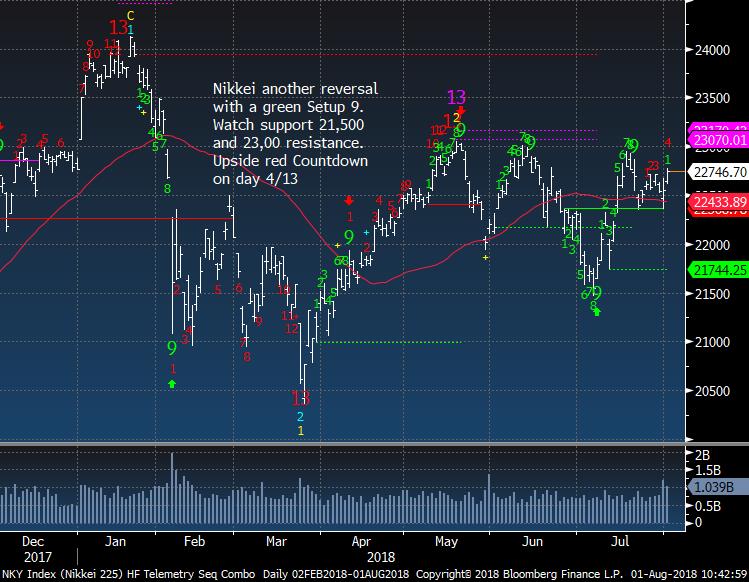
Nikkei shows how it had a nice day yesterday but the DXJ is reacting after the US markets are week.
|
|
|
|
|
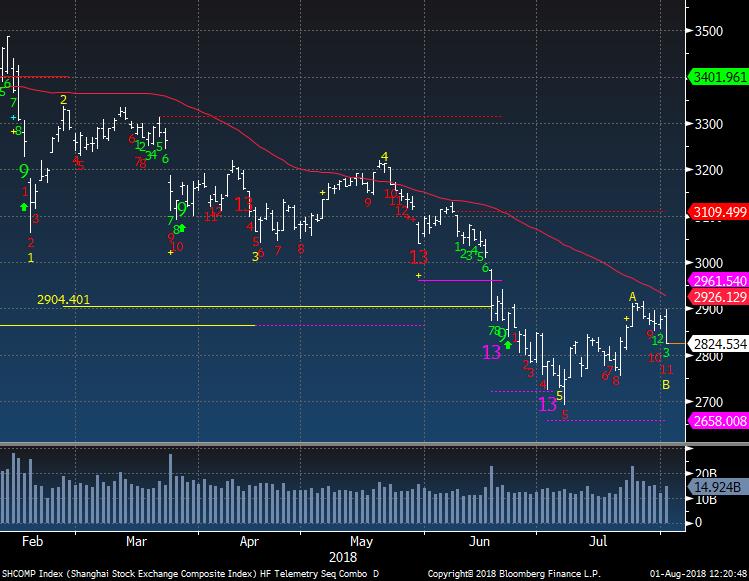
Shanghai A Shares is now on day 11 of 13 with a downside Countdown
|
|
|
|
|
|
|
|
|
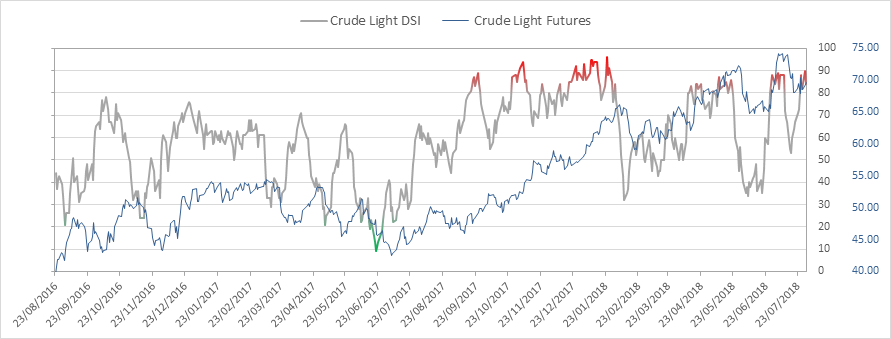
Crude bullish sentiment is at 84% and down from the previous day's extreme 90% level
|
|
|
|
|
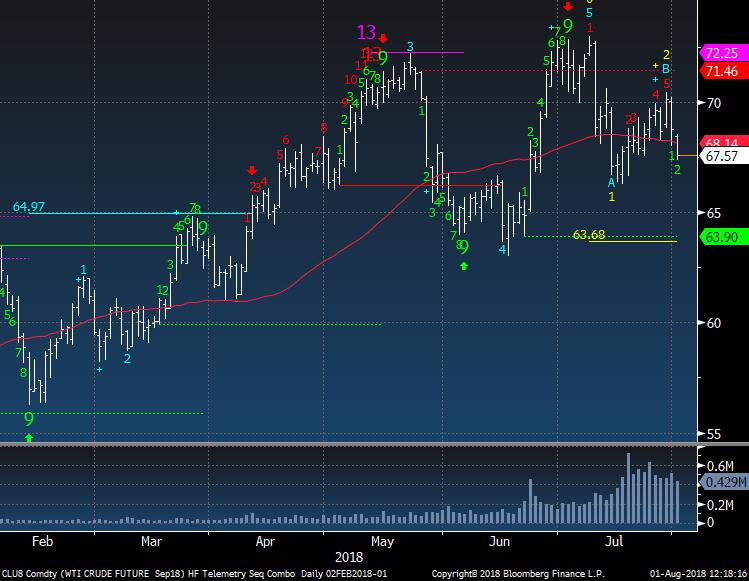
Crude has price flipped down and looks like it can break the recent lows at 66
|
|
|
|
|
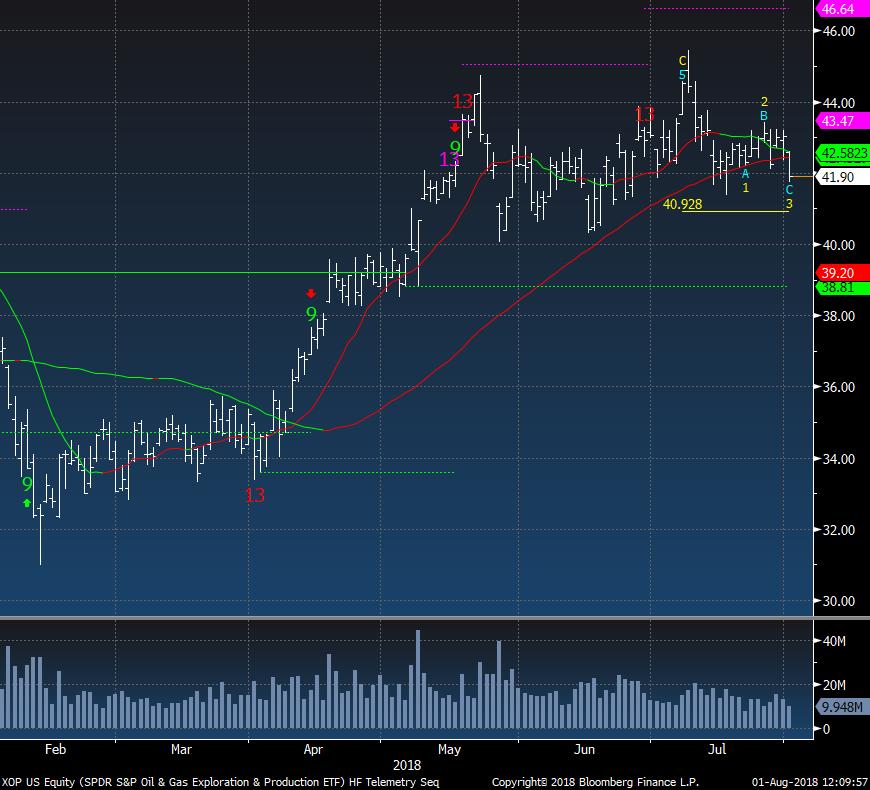
XOP Energy ETF has been going sideways since May but is now under some moving averages. A little more weakness and this could see a rather large drop without any support
|
|
|
|
|
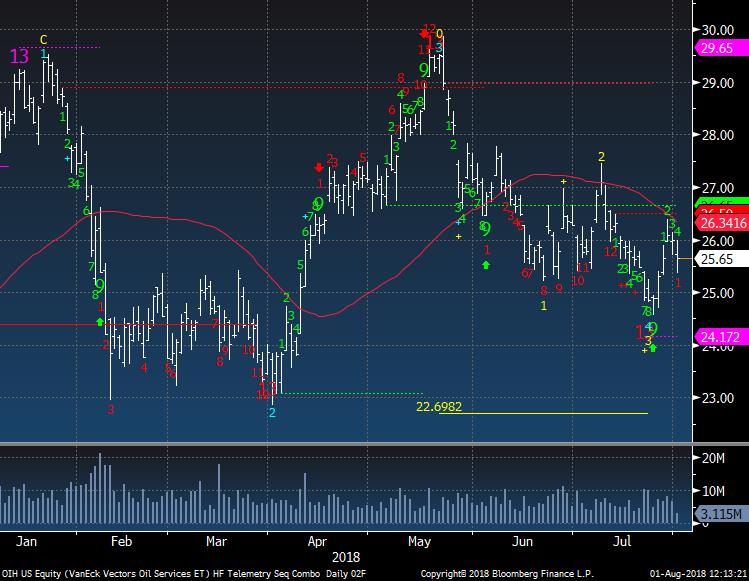
OIH Oil Service did get the downside exhaustion 13 but it happened in wave 3 and the bounce is going to be a short lived corrective wave 4 followed by a deeper wave 5. I am long HAL as my proxy and am moving the stop to 41.25 to ensure a gain.
|
|
|
|
|
|
|
|
|
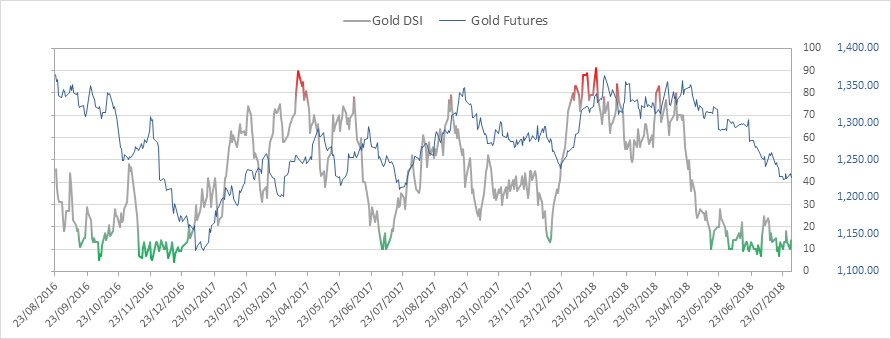
Gold bullish sentiment is at 14% and no change here
|
|
|
|
|
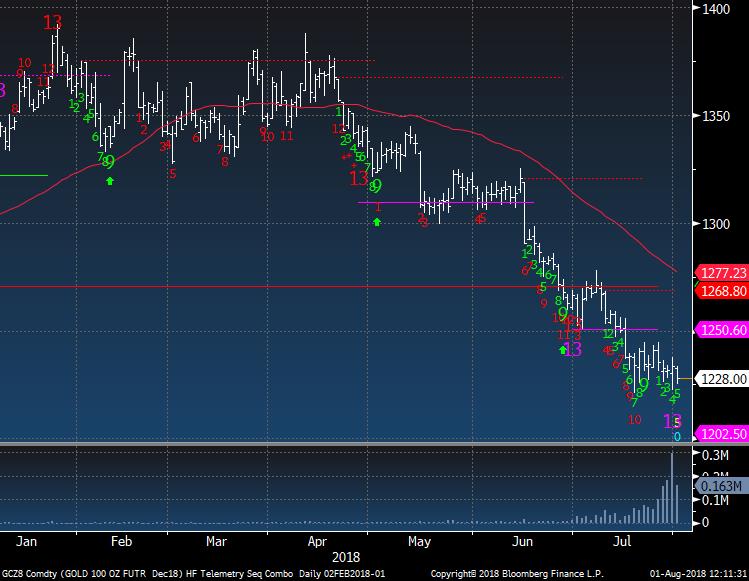
Gold Futures did get the pink Combo but still needs a little lower for the red Sequential 13
|
|
|
|
|
|
|
|
|
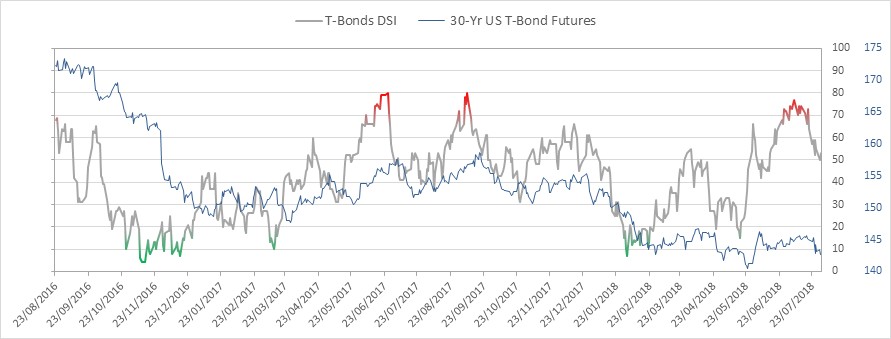
Bond bullish sentiment is at 53%
|
|
|
|
|
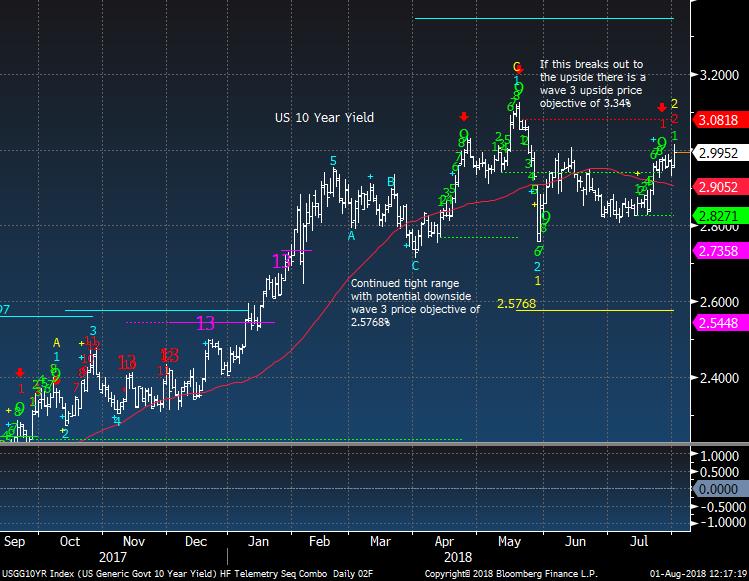
US 10 year yield has been in tight range and today there is a red 2 of 13 with an upside Countdown. I have been leaning on yields lower before higher but this could change my bias
|
|
|
|
|
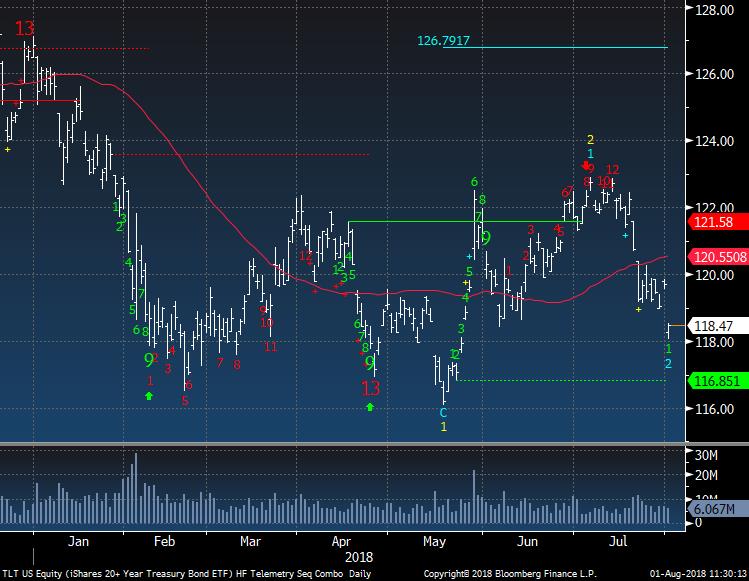
TLT Bond ETF gapped down today as it went Ex Dividend today and the bond market weakness. If this can't hold I will sell it likely tomorrow. Let's see what the Fed does
|
|
|
|
|
|
|
DEMARK SCREENS - Daily, Weekly, Monthly Upside/Downside Exhaustion Signals
|
|
|
Daily/Weekly DeMark upside/downside exhaustion signals (Sequential) weekly updated on Monday's and monthly on the first day of the new month. Price flips occur when a stock closes higher/lower than four previous closes and increases conviction of a price turn.
The upside 13's are sell signals and downside 13's are buy signals. Price flip's are confirmation signals that increases potential for a price trend change. For example, if you are long a stock and there is an upside 13, you will want to take cautious action by selling down or out of a position. If initiating a short sale with the upside 13's, we tend to start with a 1/2 size and add with the downside price flip. The opposite is true for when there are downside 13's. Take a 1/2 size position
and add with the upside price flip. The DeMark Indicators are designed to assist the user with buying into weakness and selling into strength to anticipate trend exhaustion. Selling into a rally and buying into a decline often afford the opportunity to exit a trade without too serious a loss if wrong.
S&P 1500 Universe:
DAILY UPSIDE 13: AGN, BKS, EQR, FORR, FRAN, MAA, MLI, UDR, UHT, WEC
DAILY DOWNSIDE 13: TCBI, UMBF
DAILY UPSIDE WITH PRICE FLIP REVERSAL DOWN: AES, AKS, APC, CMG, COR, COST, IPAR, WAGE
DAILY DOWNSIDE WITH PRICE FLIP REVERSAL UP: GVA, STT
Updated: 7/30/18
WEEKLY UPSIDE 13: AIN, AME, AVAV, AXP, COST, FARO, GIII, HRC, KO, LGND, NBTB, NTRS, POL, PRI, RBC, SHW, TSS, WTS
WEEKLY DOWNSIDE 13: GFF, HOG, LB
Updated: 8/1/18
MONTHLY UPSIDE 13: AIZ, ATR, BIO, CBU, CDNS, CMS, CSX, DGX, EE, FCN, FIX, GTY, HAE, HAS, IDXX, IEX, KSU, MA, NI, NPK, PTC, RLI, ROL, WEC
MONTHLY DOWNSIDE 13: CIR, HIBB
Euro Stoxx 600 Universe:
DAILY UPSIDE 13: TSCO LN
DAILY DOWNSIDE 13: BOL SS, UTDI GR
DAILY UPSIDE WITH PRICE FLIP REVERSAL DOWN: CBG LN, COLOB DC, SOBI SS, WDH DC, WDI GR, ZAL GR
DAILY DOWNSIDE WITH PRICE FLIP REVERSAL UP: BOL SS, FRES LN
Updated: 7/30/18
WEEKLY UPSIDE 13: ALFA SS, KGF LN, NESTE FH, NZYMB DC
WEEKLY DOWNSIDE 13: ABF LN, GNK LN
Updated: 8/1/18
MONTHLY UPSIDE 13: TEMN SW
MONTHLY DOWNSIDE 13: CO FP, GETIB SS, RXL FP, TALK
LN
|
|
|
Unsubscribe me from Hedge Fund Telemetry
Hedge Fund Telemetry LLC, P.O. Box 4675, Greenwich, CT 06861, United States
CONFIDENTIALITY NOTE and DISCLAIMER: This message is for the named person's use only. It may contain confidential, proprietary or legally privileged material. No confidentiality or privilege is waived by any accidental or unintentional transmission. If you receive this message in error, please immediately delete it and all copies of it from your system, destroy any hard copies and notify the sender. You must not, directly or indirectly, use, disclose,
distribute, print or copy any part of this message if you are not the intended recipient. Hedge Fund Telemetry LLC. cannot guarantee the confidentiality of the material transmitted; therefore, information of a sensitive or confidential nature should not be transmitted. There is risk in trading markets. Hedge Fund Telemetry LLC reports are based on information gathered from various sources and believed to be reliable, but are not guaranteed as to accuracy and completeness. The information is subject to change without notice and Hedge Fund Telemetry LLC has no obligation to provide any updates or changes. Hedge Fund Telemetry LLC is providing this data for informational and educational purposes and does not believe that it is sufficient to base an investment decision on. This information should not be regarded as a solicitation or recommendation of any particular security or to engage in any trading strategy. One should always check with your licensed financial
advisor to determine suitability of any investments.
|
|
|
|
|