|
|
|
|
|
|
|
|
I'll admit I'm a big fan of the Mission Impossible films. Tom Cruise is simply awesome as Ethan Hunt who can jump from building to building or to hang on to outside of a plane when it's taking off vertically and at the end he saves the world. Here is the plot for the new one: When an
IMF mission ends badly, the world is faced with dire consequences. As Ethan Hunt takes it upon himself to fulfill his original briefing, the CIA begins to question his loyalty and his motives. Hunt finds himself in a race against time, hunted by assassins and former allies while trying to prevent a global catastrophe.
I've changed it to reflect the current market environment: When the FANG stocks mania ends badly, the world is faced with dire consequences. As Ethan Hunt takes it upon himself to sell out of all of his long holdings in FANG, CNBC begins to question his loyalty and his motives. Hunt finds himself in a race against time, as the first day down didn't seem that bad but Amazon has faded off the highs and could close down on the day. Meanwhile all of the buy the dip people continue to lever up to prevent a global catastrophe.
I've been showing the narrow attribution from various time frames with the Nasdaq 100 for some time. This year has become even more narrow with the top 5 stocks have attributed about 74% of the gains. It has been around 40%-50% on other years and that's why I'm
quite concerned. A lot of people who are bullish have referenced breadth being great and this is very different from what I'm talking about. They have shown equal weight indexes hitting new highs which I do not dispute. Below I have some various ratio charts that illustrate the out sized gains with the FANG's. If these continue to fade, expect a much deeper pullback than what we saw in February.
Have a great weekend and thank you for your continued support. Please tell a friend! We are expanding and had a great month with many new clients signing up.
- US Markets - Sentiment, Daily and 60 minute tactical views. Market sentiment reached extremes and now reversing with a lot of room on the downside before oversold
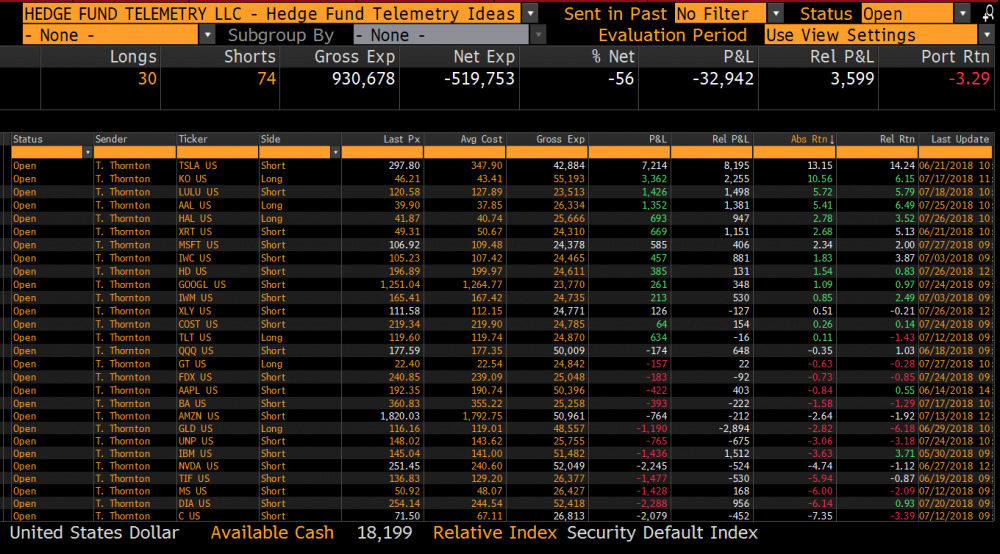
- Hedge Fund Telemetry Trade Ideas - Took profits in NEM, DIS, Added long GT, short MSFT
- Fun with Ratios - A look at how much has FANG and AMZN out performed
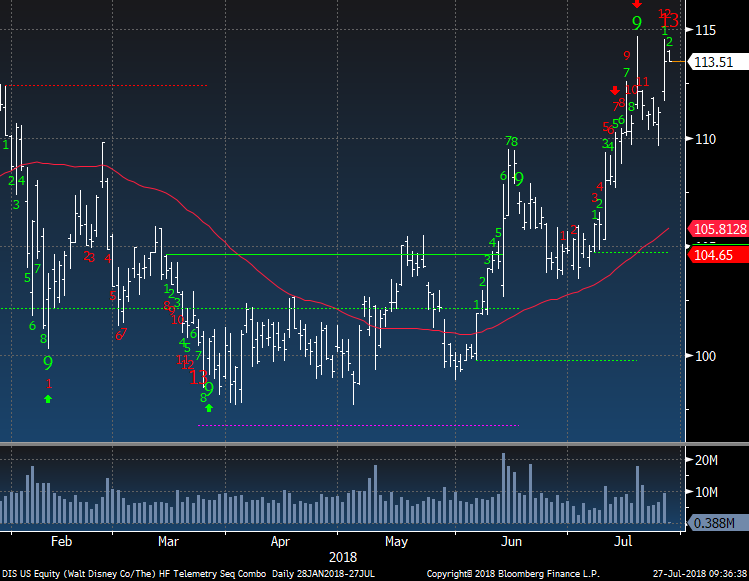
- Disney - Take profits on the upside Countdown 13
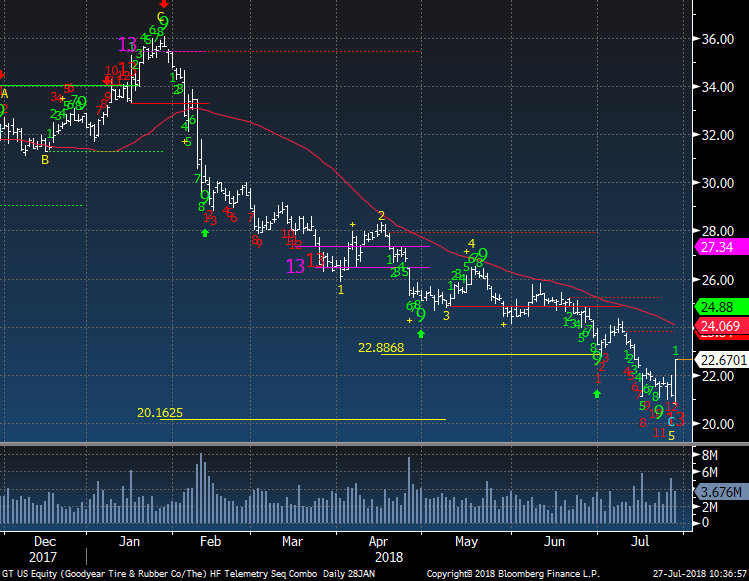
- Goodyear - New long idea - I am trying my best to find long ideas to balance out bias
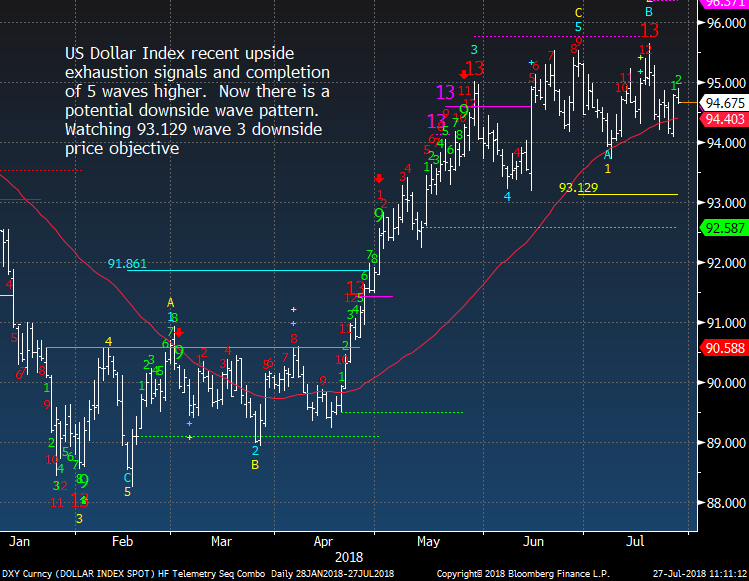
- Currency Update - Euro with downside DeMark Countdown 13. Yuan another new low today
- European Market Update - DAX continues sneaky lift
- Global Market Update - EEM vs SPY continued up turn
- Crude and Energy ETF Update
- Gold Update - GLD has a downside DeMark Countdown 13 today but gold futures not yet
- Bond Update
- DeMark Screens - Daily, Weekly, Monthly upside/downside exhaustion signals within the S&P 1500 and Euro Stoxx 600
|
|
|
|
|
Here's a link to the Hedge Fund Telemetry market sentiment page with 40 charts of sentiment including equities, bonds, currencies, and commodities updated each day.
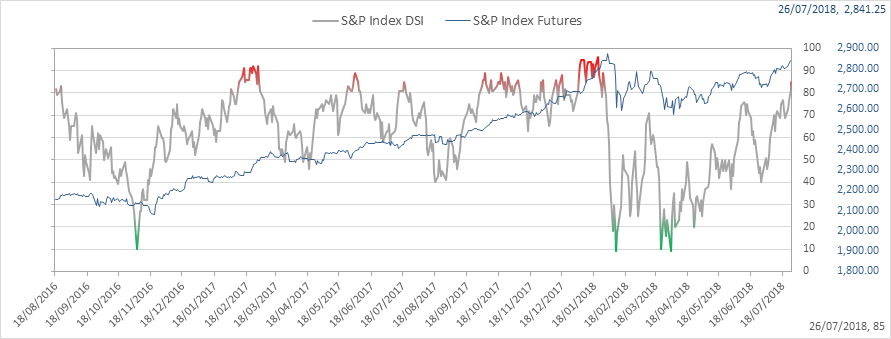
SPX bullish sentiment is at 82% and still extreme. Expect a large drop on today's action later
|
|
|
|
|
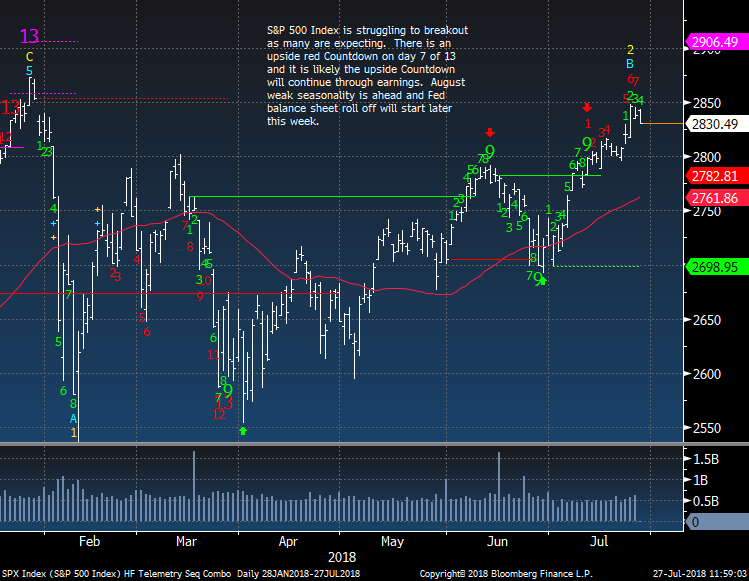
SPX daily is down more since I pulled this chart. 2800 will be the first level people will be watching only because that was the resistance and now it's support
|
|
|
|
|
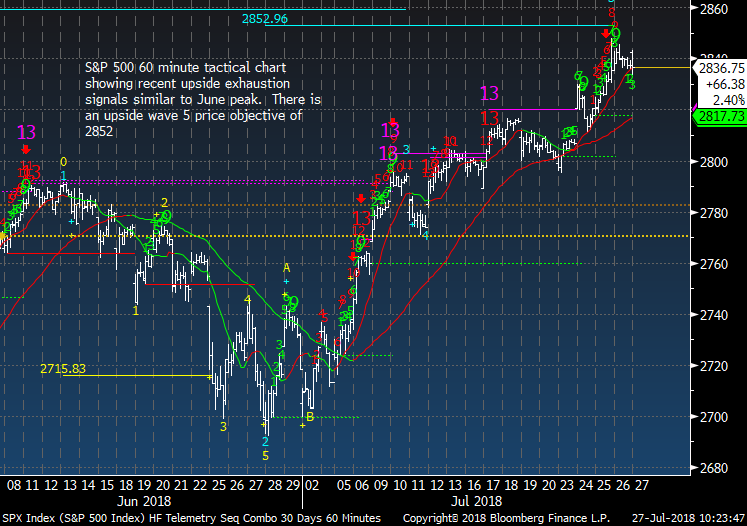
SPX 60 minute tactical time frame hit the upside wave 5 price objective and now reversing
|
|
|
|
|
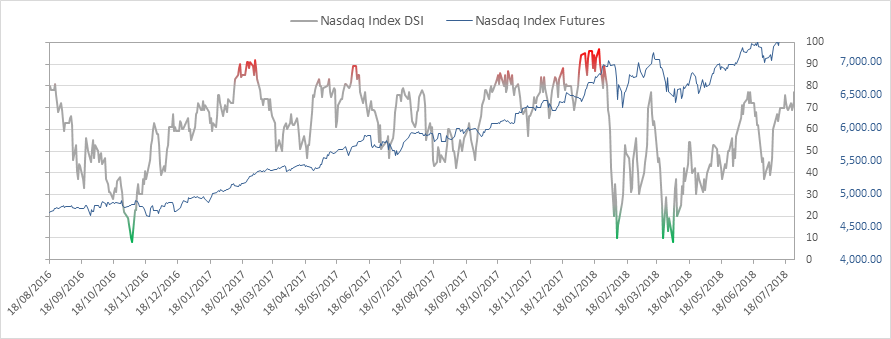
Nasdaq bullish sentiment is at 73%
|
|
|
|
|
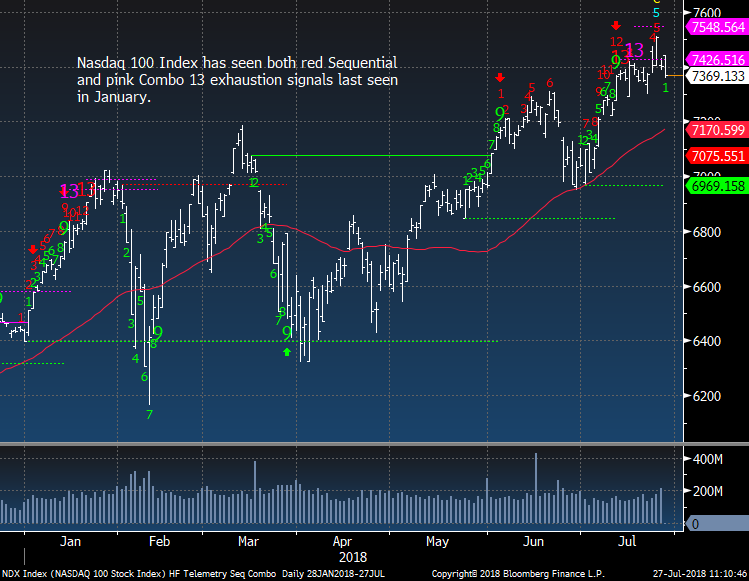
NDX Index reversing hard today
|
|
|
|
|
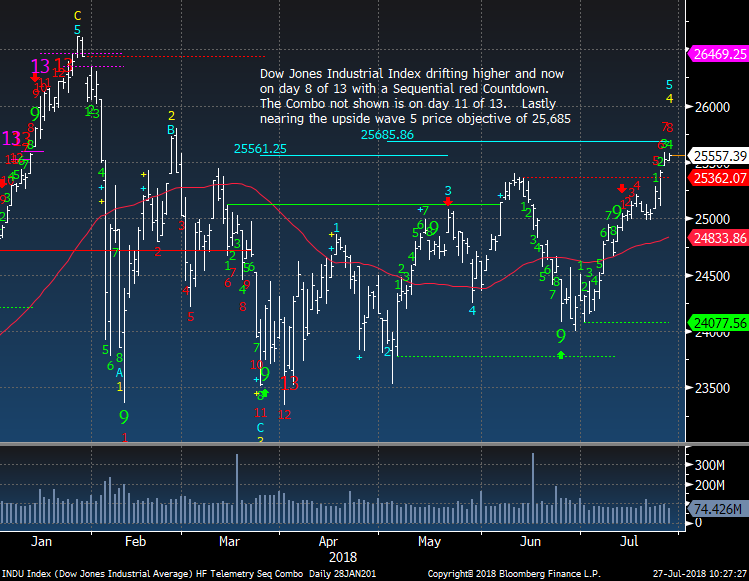
Dow Jones Industrial Average drifting up. Key is watching BA for a reversal
|
|
|
|
|
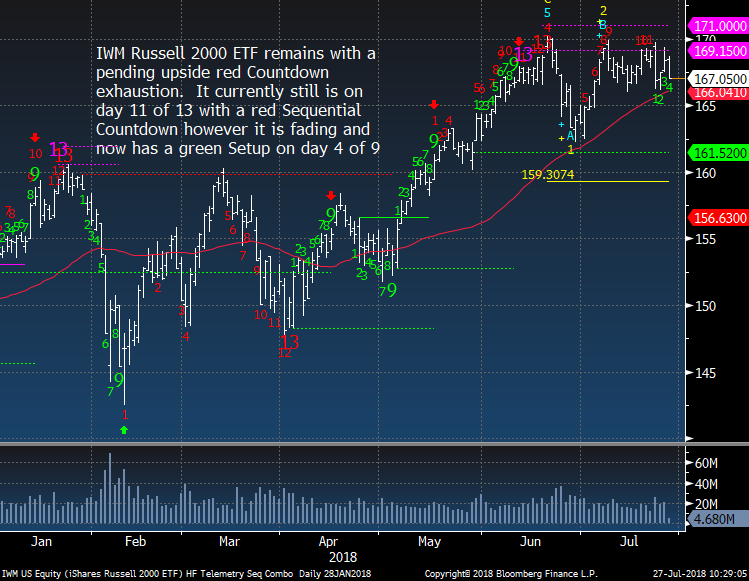
IWM Russell 2000 down very hard today
|
|
|
|
|
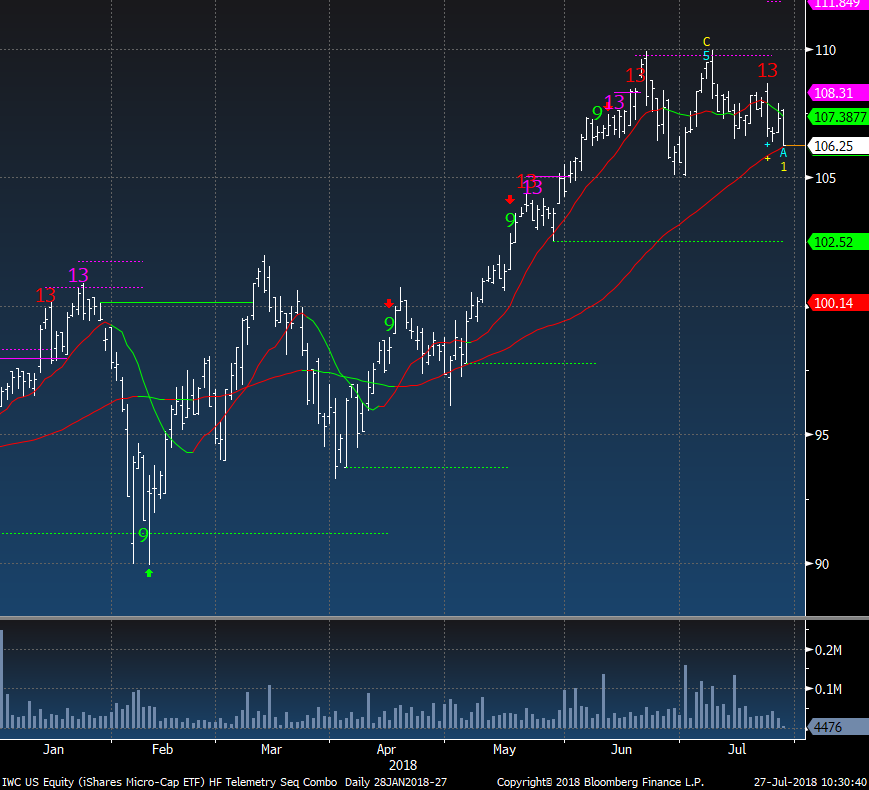
Micro Cap ETF looks like a rounding top
|
|
|
|
|
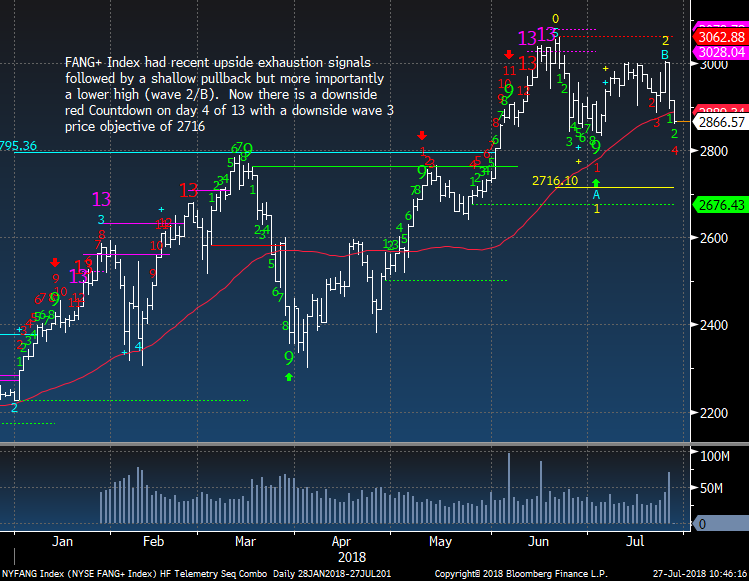
FANG + Index didn't make a new high this month and has a downside Countdown on day 4 of 13
|
|
|
|
|
|
|
Hedge Fund Telemetry Trade Ideas
|
|
|
Trade Ideas - Sold NEM long DIS long, Added GT long 2.5% size. Added MSFT short 2.5% size
|
|
|
|
|
|
|
|
|
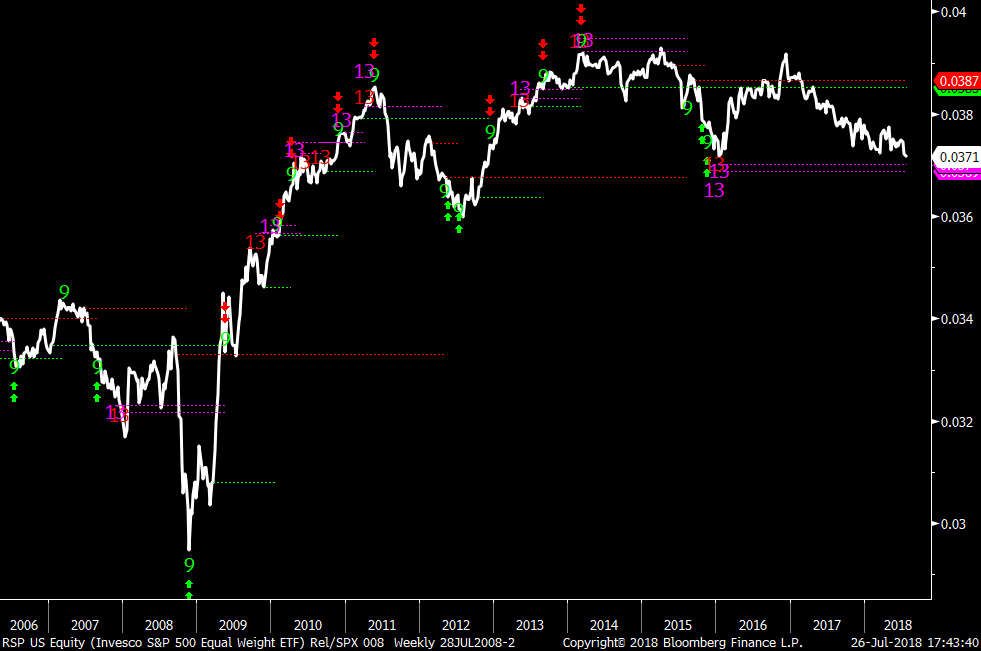
RSP S&P equal weight vs SPX Index ratio is making a 6 year relative low.
|
|
|
|
|
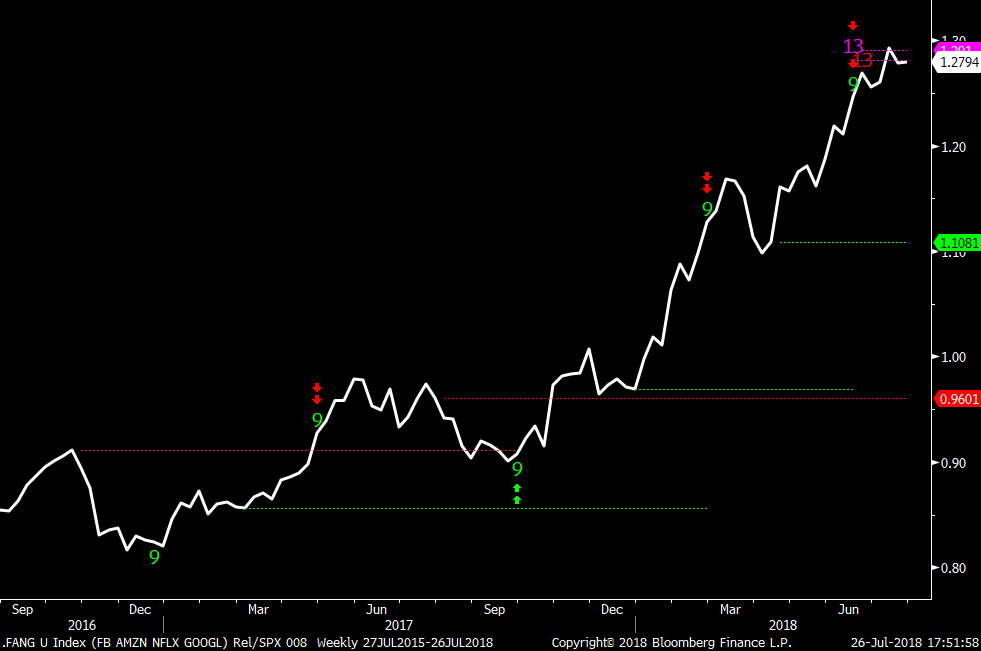
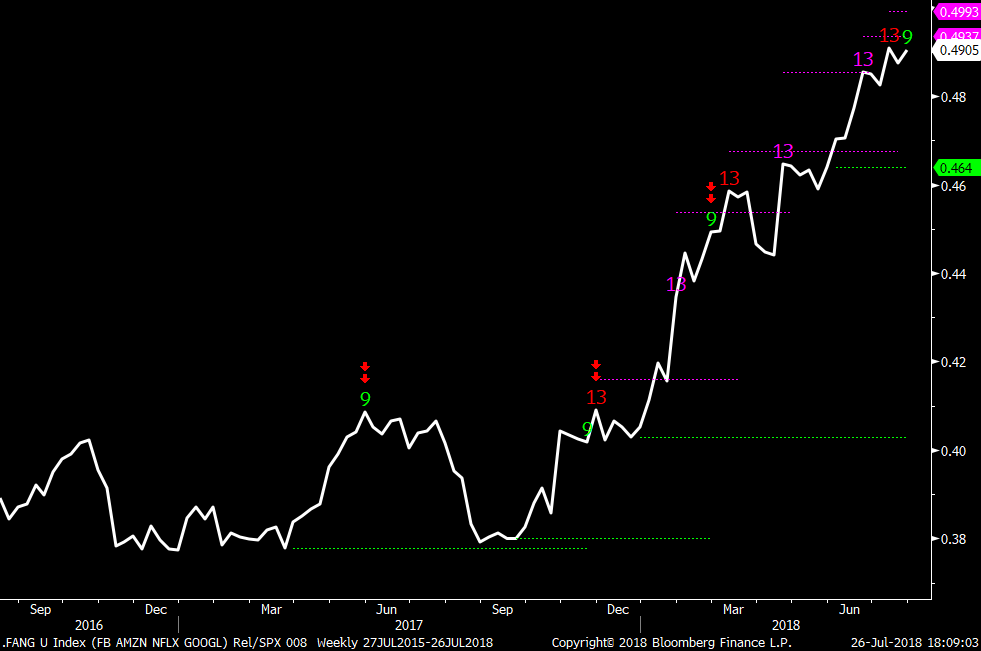
FANG vs SPX this is pronounced outperformance
|
|
|
|
|
FANG vs NDX is worse as it shows how much attribution is due to the FANGS
|
|
|
|
|
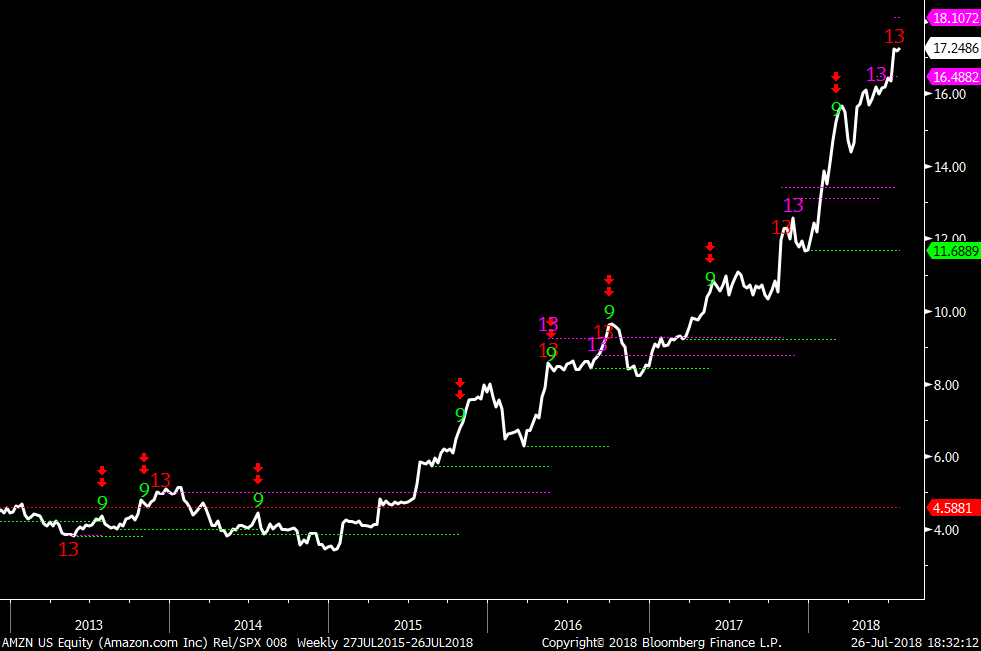
AMZN vs XLY Consumer Discretionary ETF ratio is just nuts
|
|
|
|
|
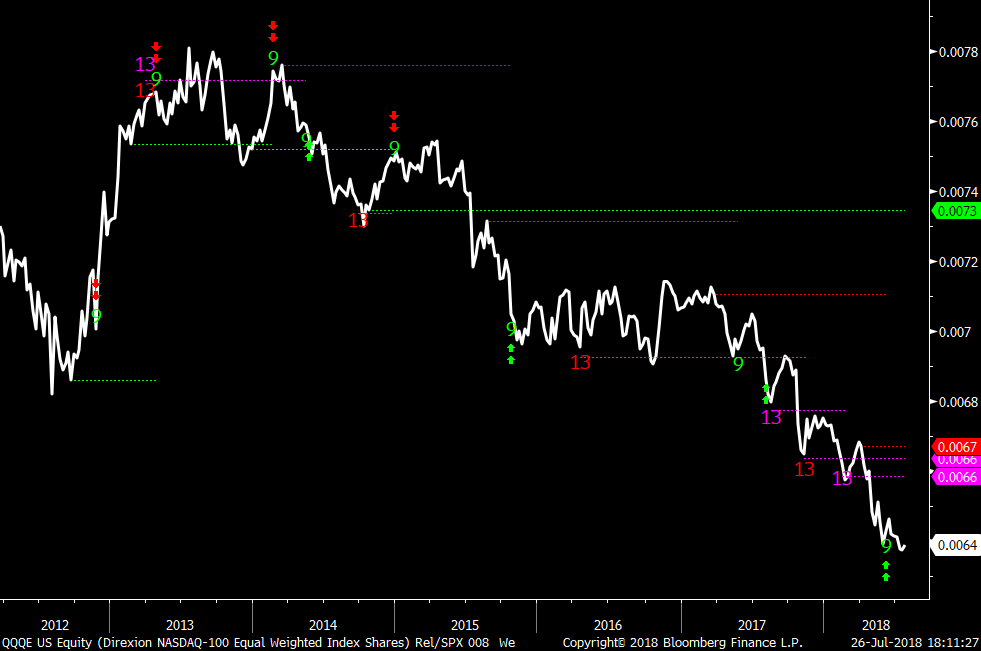
Nasdaq 100 equal weight vs NDX ratio shows how the equal weight index has under performed since 2013
|
|
|
|
|
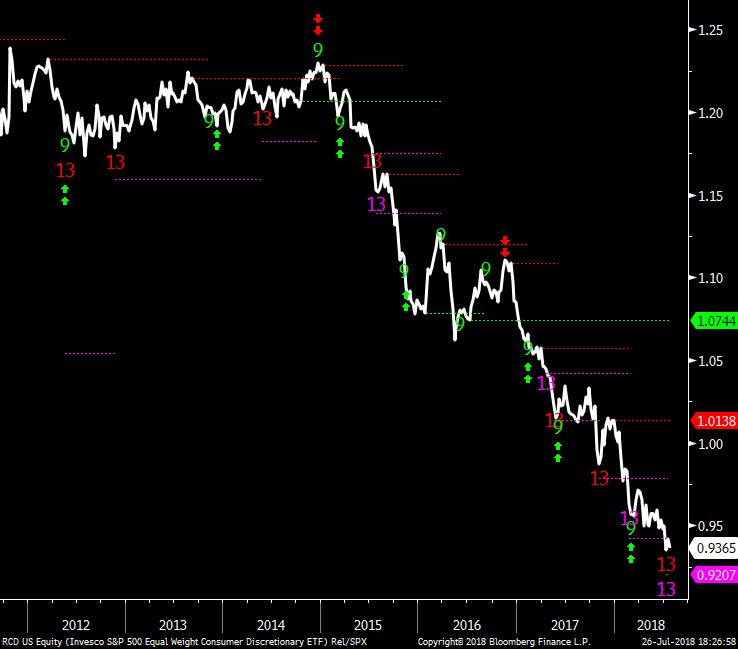
RCD Consumer Discretionary equal weight ETF vs XLY shows the Amazon effect and how it has massively under performed. What do you think is going to happen when Amazon and the other FANG's start to go down?
|
|
|
|
|
|
|
Disney - Selling long idea
|
|
|
Taking profits in DIS today with the upside Countdown 13.
|
|
|
|
|
|
|
|
|
When I ran the planes trains and automobiles report earlier this week, I spotted across the board very weak auto stocks and many had or were near downside exhaustion. Please understand, I am desperately looking for long ideas that offer good risk reward. Goodyear has been killed all year and they reported today and the stock is lifting with a downside red Countdown 13 today. It is NOT easy to buy oversold stuff in an overbought market but I like this and feel
you can buy a small size.
|
|
|
|
|
|
|
|
|
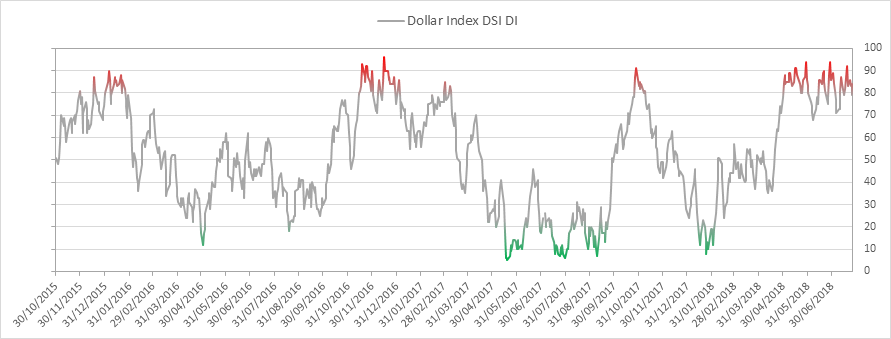
US Dollar bullish sentiment is at 84% and remains in the extreme zone.
|
|
|
|
|
US Dollar Index continues to stay in a range. The GDP report didn't move the dollar as many expected
|
|
|
|
|
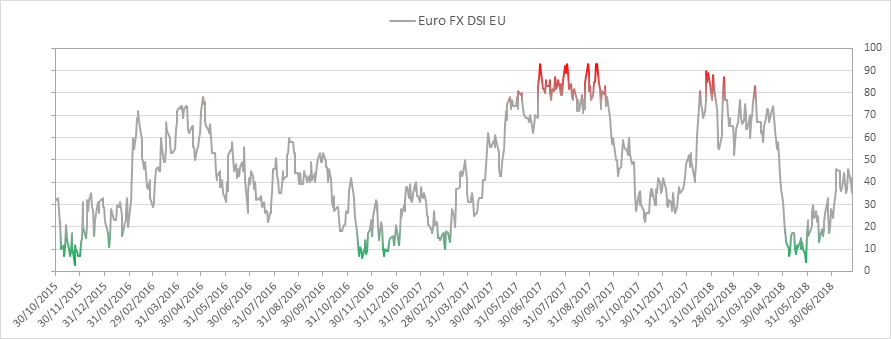
Euro bullish sentiment is at 35%
|
|
|
|
|
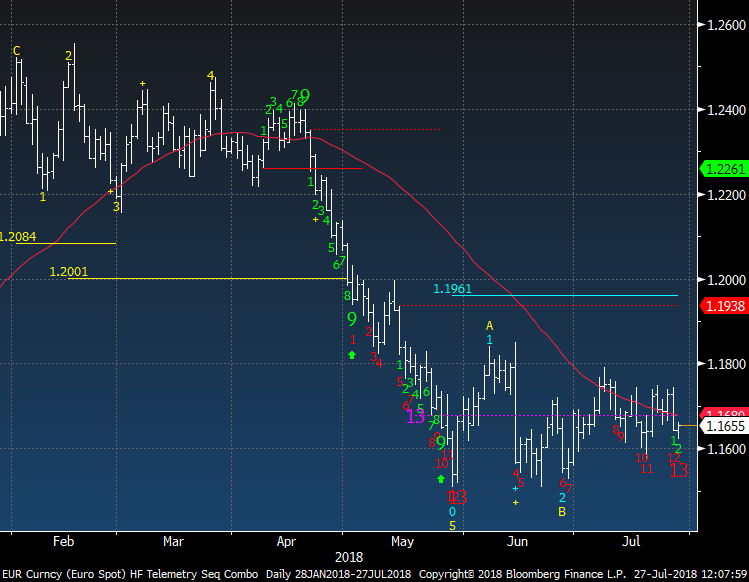
Euro Spot has another downside exhaustion Countdown 13 today
|
|
|
|
|
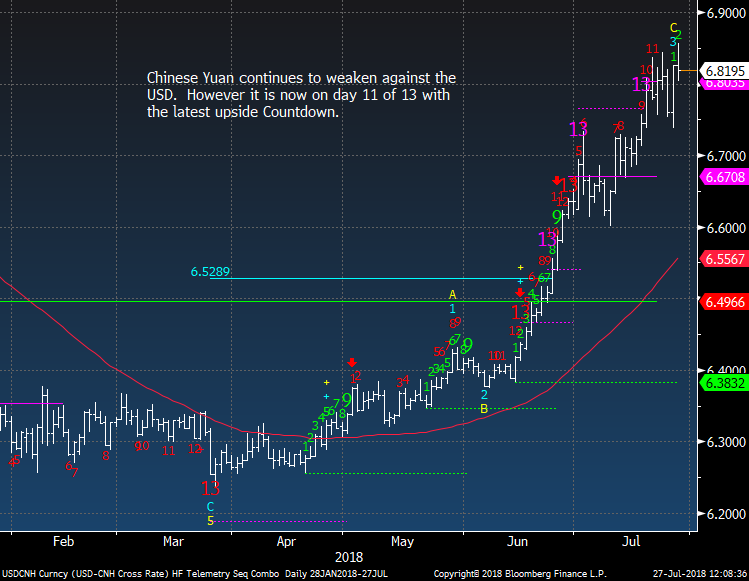
Another new low in the Chinese Yuan. This is a global market risk. At what level do alarm bells go off? I'm going to say 6.90
|
|
|
|
|
|
|
|
|
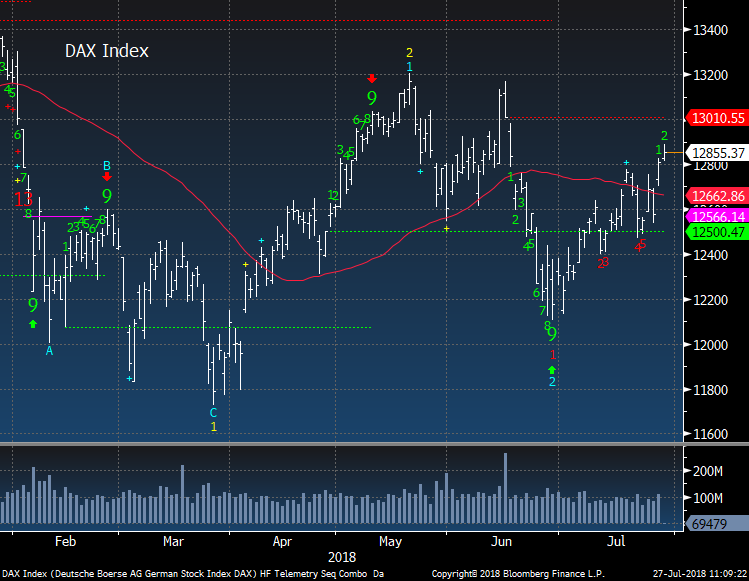
DAX had another good day. I will get more into European markets next week
|
|
|
|
|
|
|
|
|
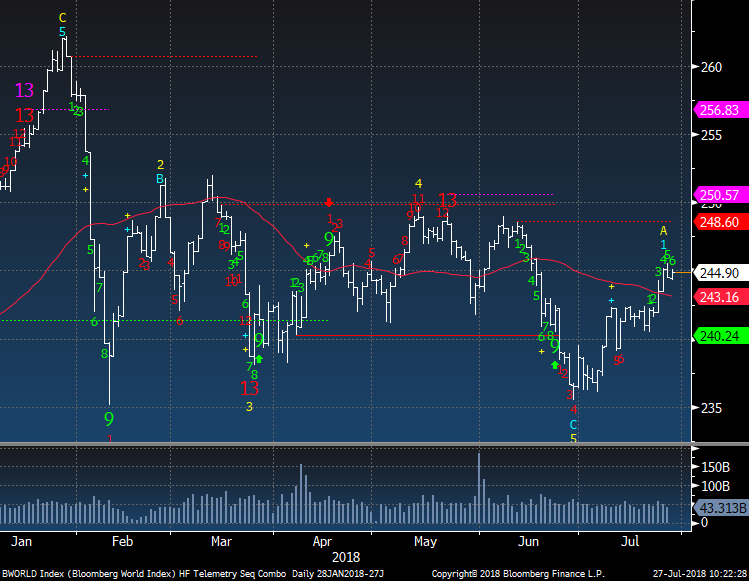
Bloomberg World Index stalling today.
|
|
|
|
|
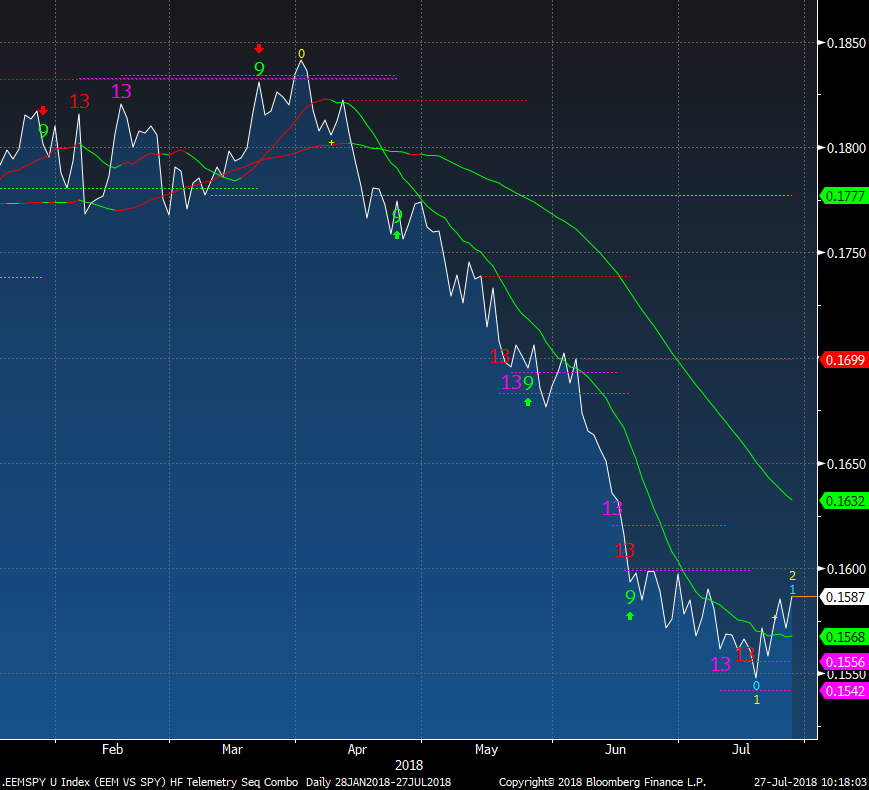
EEM Emerging Markets ETF vs SPX continues to turn up and I feel this is more risk to SPX rather than upside in EEM
|
|
|
|
|
|
|
Crude and Energy ETF Update
|
|
|
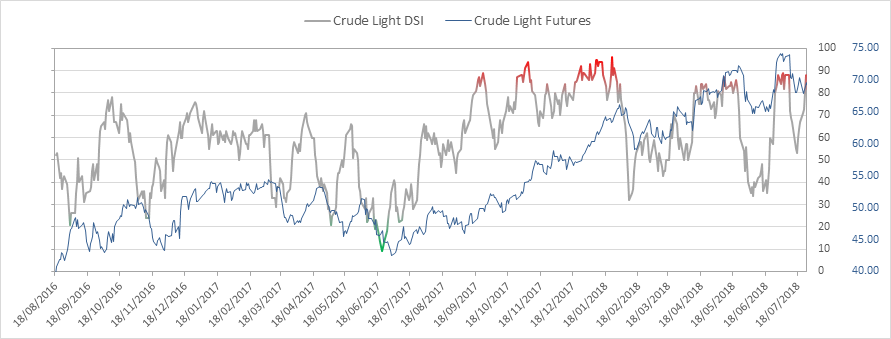
Crude bullish sentiment is at 88% and this is extreme. A limiting factor
|
|
|
|
|
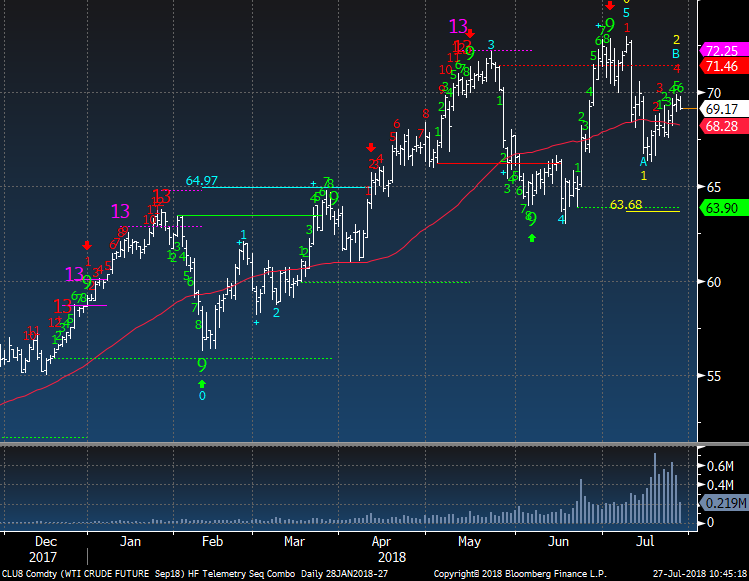
Crude is stalling today and has had a problem getting over 70. There still is an upside red Countdown on day 4 of 13 so I'll lean on the positive side of neutral (due to the extreme sentiment number)
|
|
|
|
|
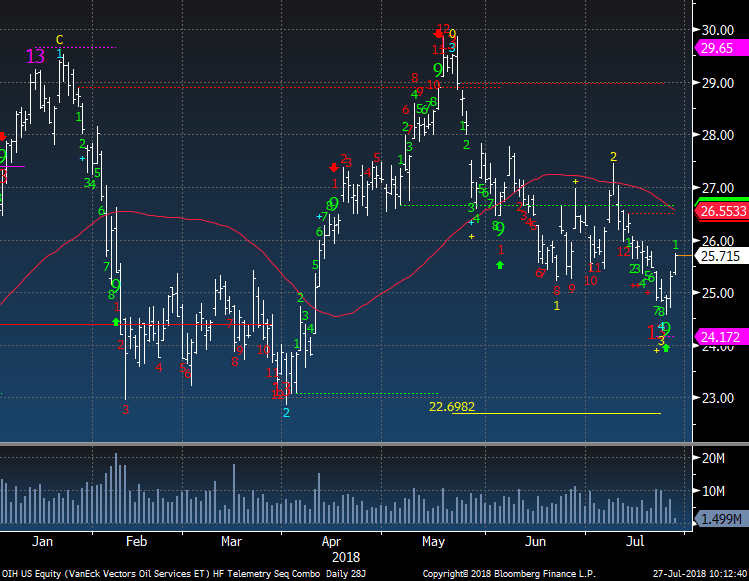
OIH Oil Service has been the most oversold on my PPO monitor and had a recent downside Countdown exhaustion 13. Halliburton also had a 13 and that is why I went long.
|
|
|
|
|
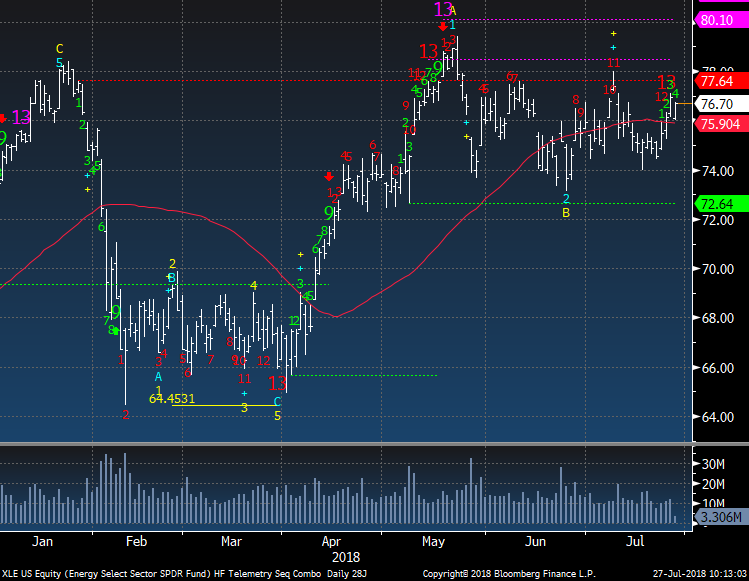
XLE had a recent upside Countdown 13 exhaustion and these have worked pretty well in the past on the upside and downside.
|
|
|
|
|
|
|
Gold Update and Silver Update
|
|
|
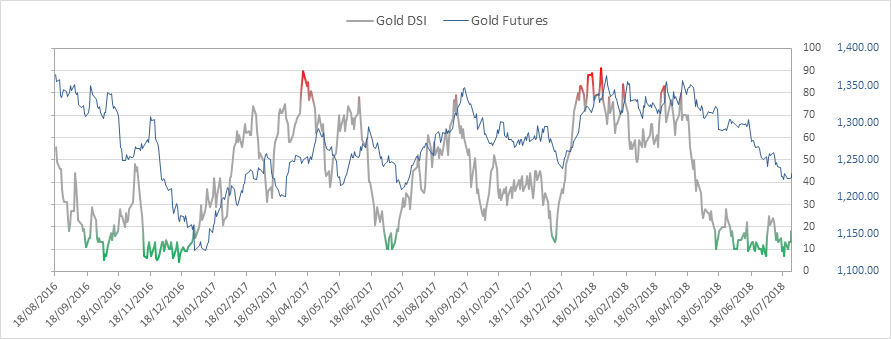
Gold bullish sentiment is at 13%
|
|
|
|
|
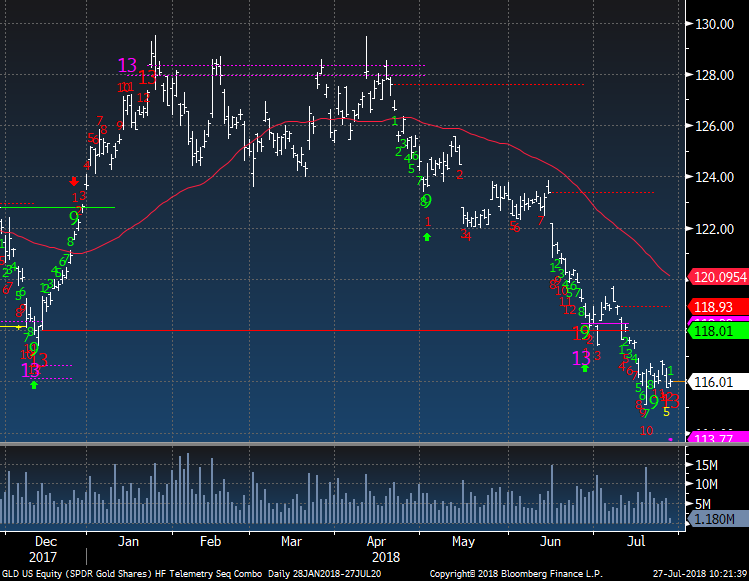
Gold GLD did get the downside 13 today while gold futures remains on day 11 of 13. I'd like to get both of these in sync. But this is a positive for sure
|
|
|
|
|
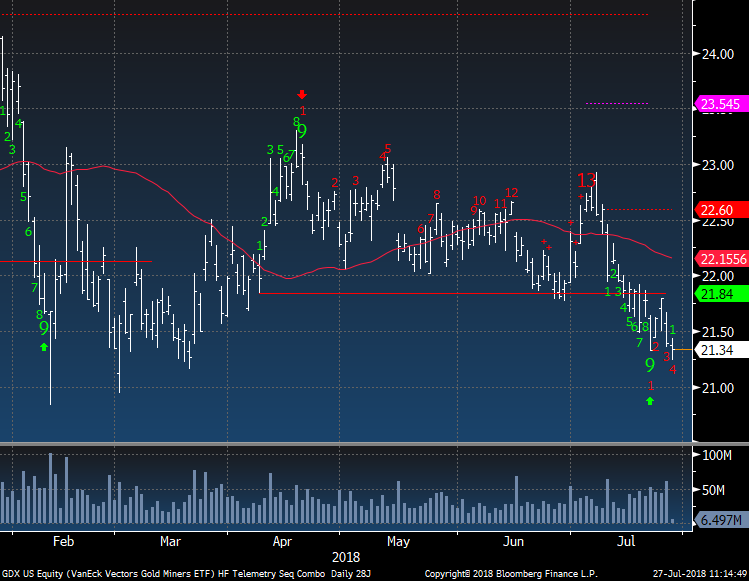
GDX Gold Miners ETF does not look great as this has a downside red Countdown on day 4 of 13. I had NEM as a long and I exited this late yesterday. I just don't like the action here with the Countdown
|
|
|
|
|
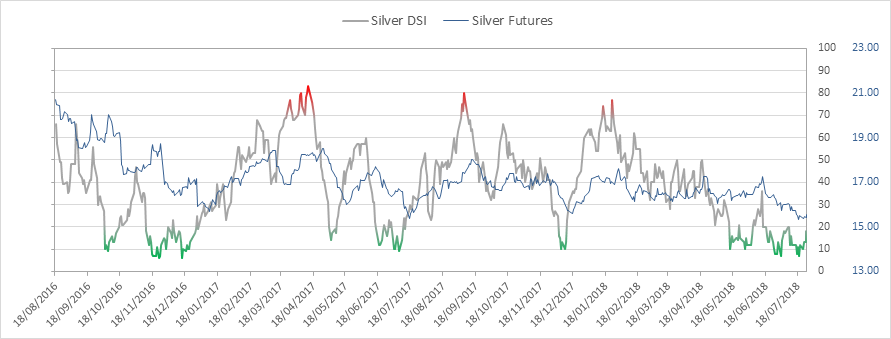
Silver bullish sentiment is at 13% and is oversold like gold
|
|
|
|
|
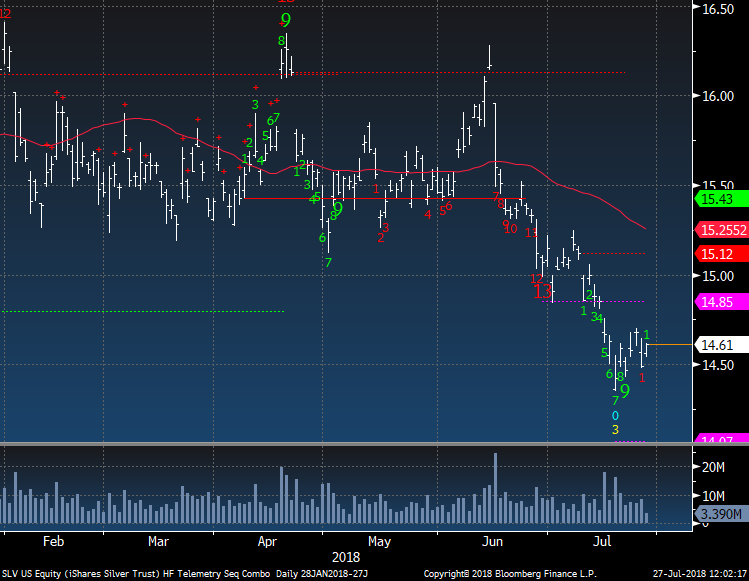
SLV had a green Setup 9 and is trying to bounce but this needs another few days higher to convince me
|
|
|
|
|
|
|
|
|
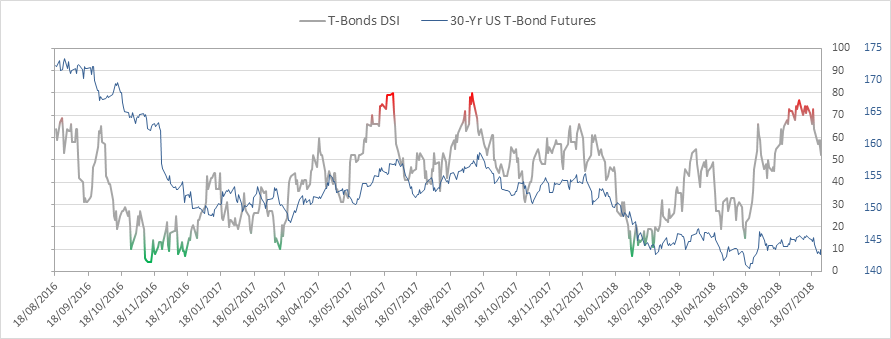
Bond bullish sentiment is at 52% and right at the mid point. It needs to bounce here.
|
|
|
|
|
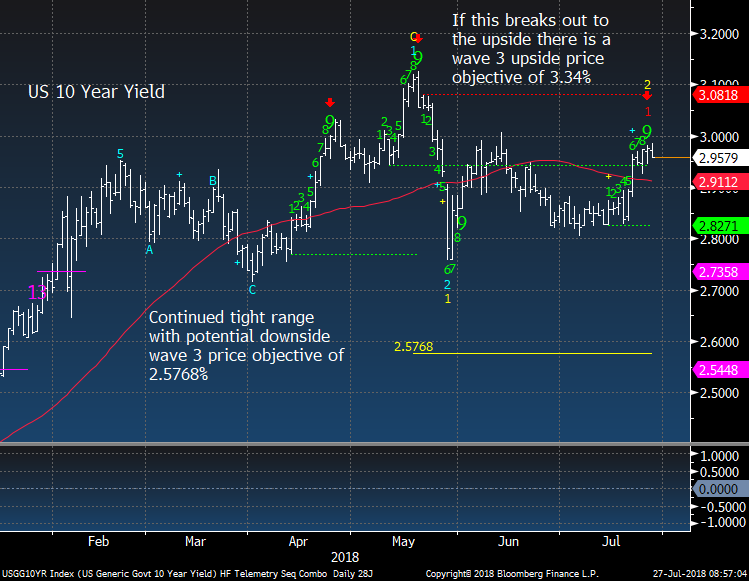
US 10 year yield has a green Setup 9 and have been good at inflection points recently. This needs to be lower on Monday.
|
|
|
|
|
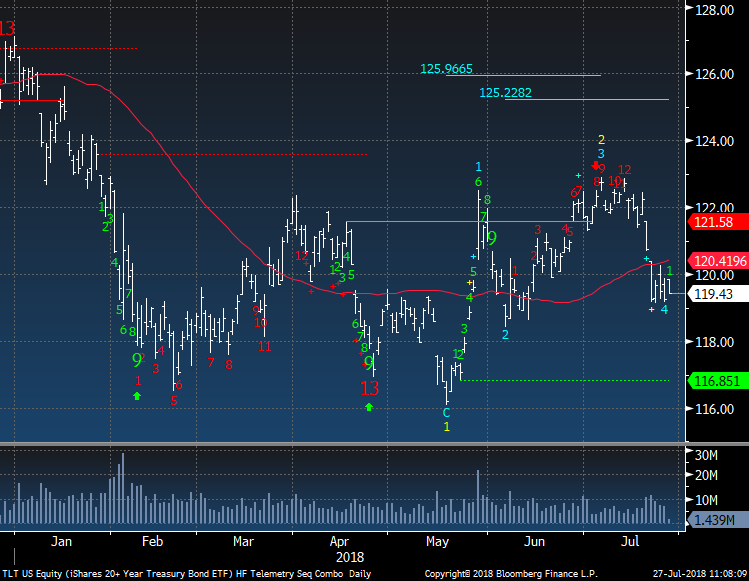
TLT Bond ETF is just stuck here. This needs to close up on Monday. More important than today.
|
|
|
|
|
|
|
DEMARK SCREENS - Daily, Weekly, Monthly Upside/Downside Exhaustion Signals
|
|
|
Daily/Weekly DeMark upside/downside exhaustion signals (Sequential) weekly updated on Monday's and monthly on the first day of the new month. Price flips occur when a stock closes higher/lower than four previous closes and increases conviction of a price turn.
The upside 13's are sell signals and downside 13's are buy signals. Price flip's are confirmation signals that increases potential for a price trend change. For example, if you are long a stock and there is an upside 13, you will want to take cautious action by selling down or out of a position. If initiating a short sale with the upside 13's, we tend to start with a 1/2 size and add with the downside price flip. The opposite is true for when there are downside 13's. Take a 1/2 size position
and add with the upside price flip. The DeMark Indicators are designed to assist the user with buying into weakness and selling into strength to anticipate trend exhaustion. Selling into a rally and buying into a decline often afford the opportunity to exit a trade without too serious a loss if wrong.
S&P 1500 Universe:
DAILY UPSIDE 13: AES, AIR, ALTR, CNP, DTE, EIX, EW, FCN, ITT, KR, NWE, PEP, TCO, UFCS
DAILY DOWNSIDE 13: AEIS, AOI, AREX, STT
DAILY UPSIDE WITH PRICE FLIP REVERSAL DOWN: BIIB, COF, FISV, FRT
DAILY DOWNSIDE WITH PRICE FLIP REVERSAL UP: HP, SEE, SLCA, STT, WIN
Updated: 7/23/18
WEEKLY UPSIDE 13: ABMD, ADP, AET, AMZN, ATR, BC, CROX, DECK, HAE, HPQ, ITT, KLIC, KWR, MSI, NTGR, RLI, THG, TMO, TRN
WEEKLY DOWNSIDE 13: CYH, FTD, TGI, VIAB, WIN
Updated: 7/1/18
MONTHLY UPSIDE 13: ADI, AEE, BAX, BCOR, ETFC, ICUI, ITG, MED, MOH, NEE, SMTC, THG, TTEK, TXN, VICR
MONTHLY DOWNSIDE 13: NONE
Euro Stoxx 600 Universe:
DAILY UPSIDE 13: KER FP
DAILY DOWNSIDE 13: COB LN, NOKIA FH
DAILY UPSIDE WITH PRICE FLIP REVERSAL DOWN: LOGN SW
DAILY DOWNSIDE WITH PRICE FLIP REVERSAL UP: EN FP, NHY NO, SPSN SW
Updated: 7/23/18
WEEKLY UPSIDE 13: AIR FP
WEEKLY DOWNSIDE 13: PUB FP
Updated: 7/1/18
MONTHLY UPSIDE 13: BLND LN, CDI FP, CRH ID, DCC LN, DOM LN, RACE IM, REL LN, RMS FP, SXS LN, WKL NA, ZAL GR
MONTHLY DOWNSIDE 13: BMPS
IM
|
|
|
Unsubscribe me from Hedge Fund Telemetry
Hedge Fund Telemetry LLC, P.O. Box 4675, Greenwich, CT 06861, United States
CONFIDENTIALITY NOTE and DISCLAIMER: This message is for the named person's use only. It may contain confidential, proprietary or legally privileged material. No confidentiality or privilege is waived by any accidental or unintentional transmission. If you receive this message in error, please immediately delete it and all copies of it from your system, destroy any hard copies and notify the sender. You must not, directly or indirectly, use, disclose,
distribute, print or copy any part of this message if you are not the intended recipient. Hedge Fund Telemetry LLC. cannot guarantee the confidentiality of the material transmitted; therefore, information of a sensitive or confidential nature should not be transmitted. There is risk in trading markets. Hedge Fund Telemetry LLC reports are based on information gathered from various sources and believed to be reliable, but are not guaranteed as to accuracy and completeness. The information is subject to change without notice and Hedge Fund Telemetry LLC has no obligation to provide any updates or changes. Hedge Fund Telemetry LLC is providing this data for informational and educational purposes and does not believe that it is sufficient to base an investment decision on. This information should not be regarded as a solicitation or recommendation of any particular security or to engage in any trading strategy. One should always check with your licensed financial
advisor to determine suitability of any investments.
|
|
|
|
|