|
|
|
|
|
|
|
|
A lot of negative news can't shake this market. Despite the lack of strong internals (% of stocks above the 50 day moving average diverging with S&P and Nasdaq prices as well negative breadth) the market is stayin alive. A few of the negatives, Trump tweets out this morning counter threats against Iran and against Amazon and Washington Post both owned by Jeff Bezos. Amazon is the most important stock in the markets today since it has attributed the most to the gains in the S&P and
overwhelmingly to the Nasdaq. The stock sold off and bounced back and is only down about a half percent now. The Wall Street Journal reported Tesla is asking suppliers for money back for parts they have already paid for and the stock is on only down 4%. This is clear evidence that they are in a severe cash crunch but the market takes it in stride. Financials are having a good day again with the yield on the US 10 year back above 2.94% which is really keeping the S&P in the green. Energy stocks were among the leaders with all of the sector ETF's showing the highest overbought readings on my PPO monitor back in May. Now the OIH Oil Service stocks are on the bottom and XLE is not far behind. The tech sector has been mixed since the March peak with the XLK up about 1% while the semiconductors which were the standout leaders in tech last year is down about 8%. The bottom line is that the market is stayin alive with the strength in Microsoft, Google and
the financials. If Google fails to gain after tonight's earnings it might be a different song tomorrow.
- US Markets - Sentiment, Daily and 60 minute tactical views
- Hedge Fund Telemetry Trade Ideas - No changes today
- The tweet is mightier than the sword
- Google ahead of tonight's report
- Tesla Update
- Tiffany Update
- Energy ETF's
- Currency Update
- European Market Update - Still looks like dead money
- Global Market Update - Sideways corrections continue
- Asian Market Update - Nikkei was hit last night and did you happen to notice Japan's bond market?
- Crude Update - A new
contract and Countdown
- Gold Update - No changes
- Bond Update - A big sell off in bonds today
- DeMark Screens - Daily, Weekly, Monthly upside/downside exhaustion signals within the S&P 1500 and Euro Stoxx
600
|
|
|
|
|
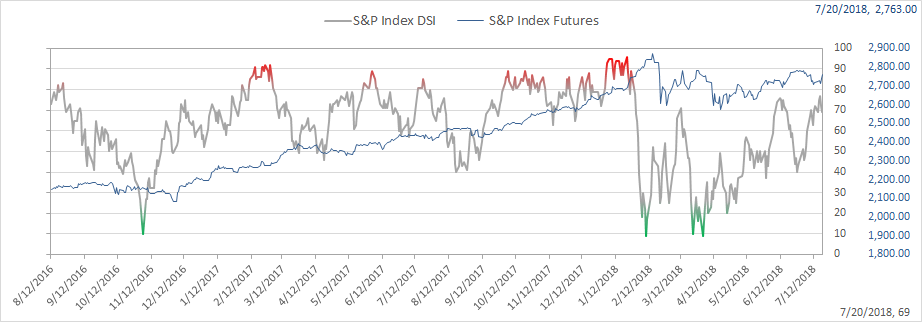
Here's a link to the Hedge Fund Telemetry market sentiment page with 40 charts of sentiment including equities, bonds, currencies, and commodities updated each day.
SPX bullish sentiment is at 69%
|
|
|
|
|
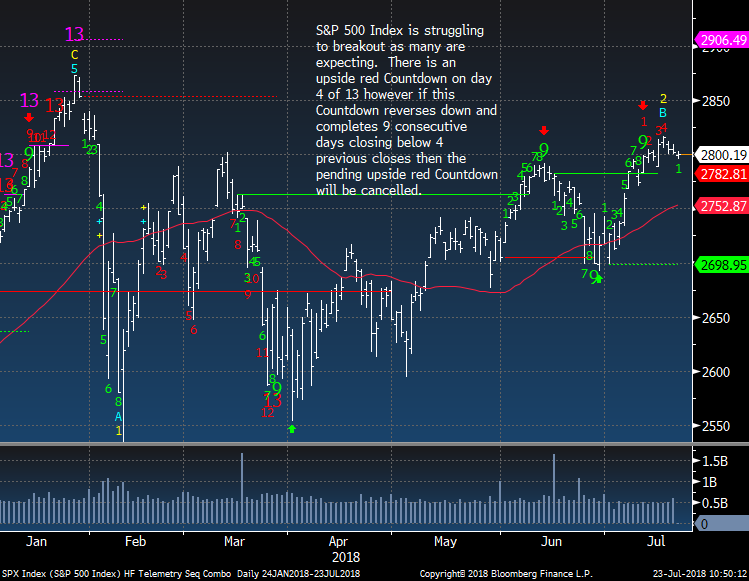
SPX daily holding the 2800 level. 2752 is the 50 day and if there is a pullback watch that level first
|
|
|
|
|
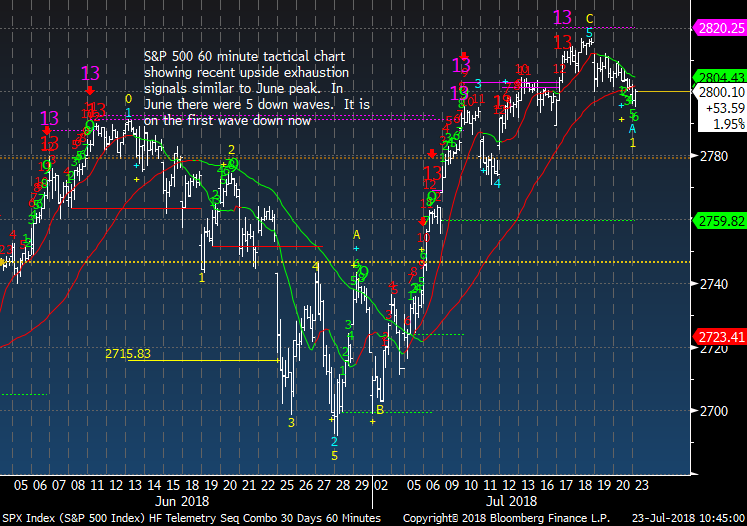
SPX 60 minute tactical time frame has seen some upside exhaustion signals
|
|
|
|
|
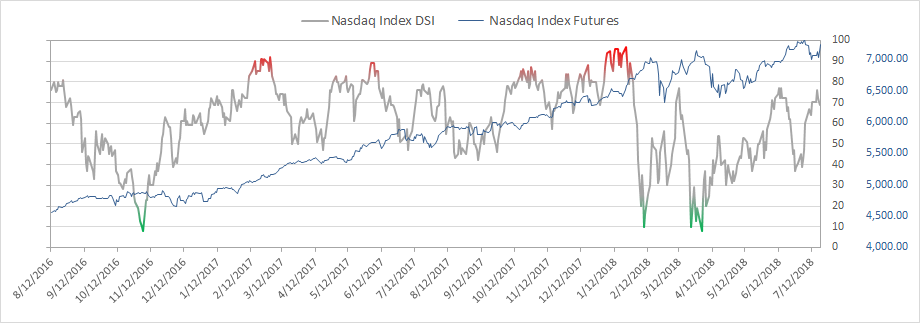
Nasdaq bullish sentiment is at 69%
|
|
|
|
|
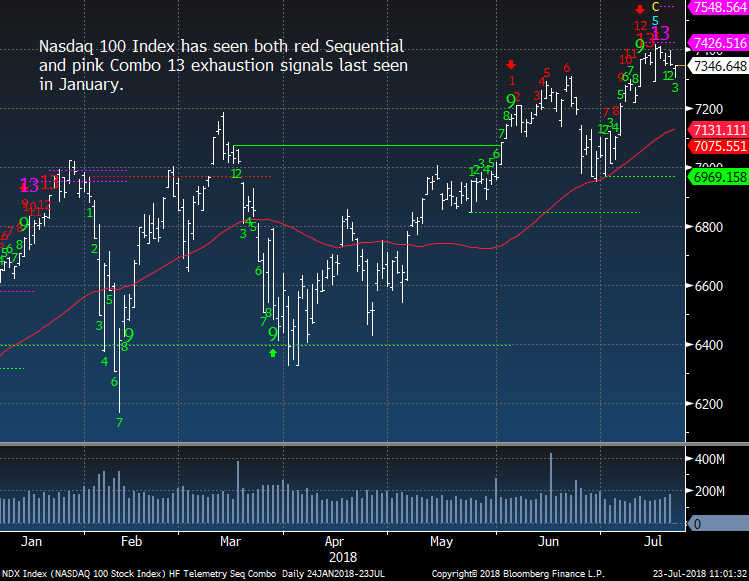
NDX Index has been the strongest yet did have an upside buying climax last week. This is when a stock or index makes a new 52 week high but closes down on the week. This last happened in March too
|
|
|
|
|
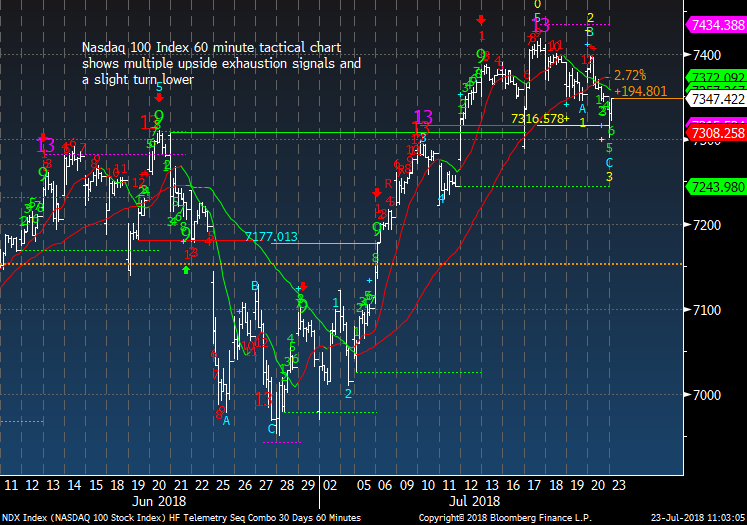
Nasdaq 100 60 minute tactical has started to roll over
|
|
|
|
|
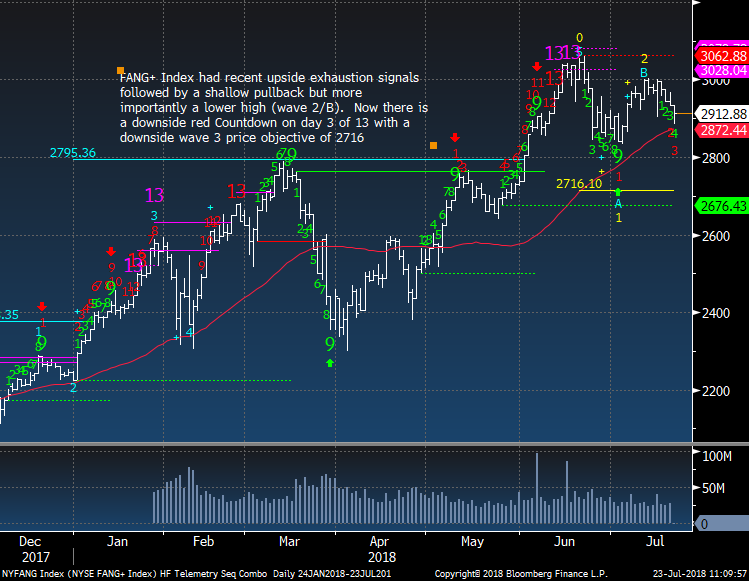
FANG + Index is at risk for lower levels
|
|
|
|
|
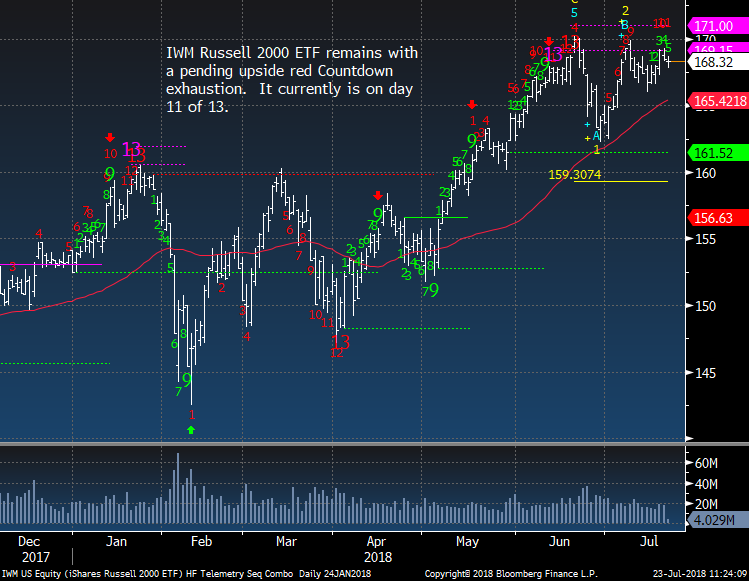
IWM Russell 2000 will need a few more up days to trigger another upside exhaustion
|
|
|
|
|
|
|
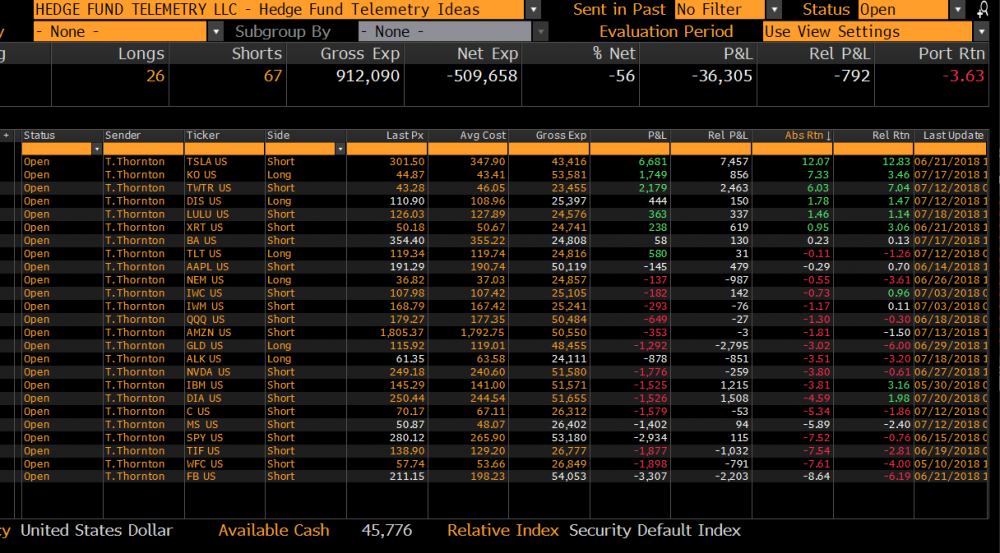
Hedge Fund Telemetry Trade Ideas
|
|
|
Trade Ideas - no changes today. I do have a retail stock I will likely be adding tomorrow. (you can buy a gallon of mayonnaise there) If Google has a positive reaction tomorrow, FB will likely get stopped out. I'm losing patience with some of the financials too. ALK bouncing back a little today after Friday's thump.
|
|
|
|
|
|
|
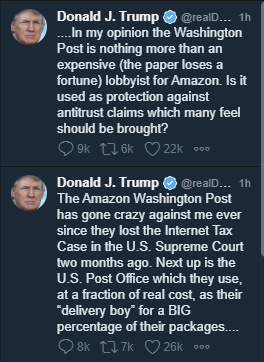
The tweet is mighter than the sword
|
|
|
President Trump banging on Amazon again today. You have to believe there is a real risk of more tweets like this and some action
|
|
|
|
|
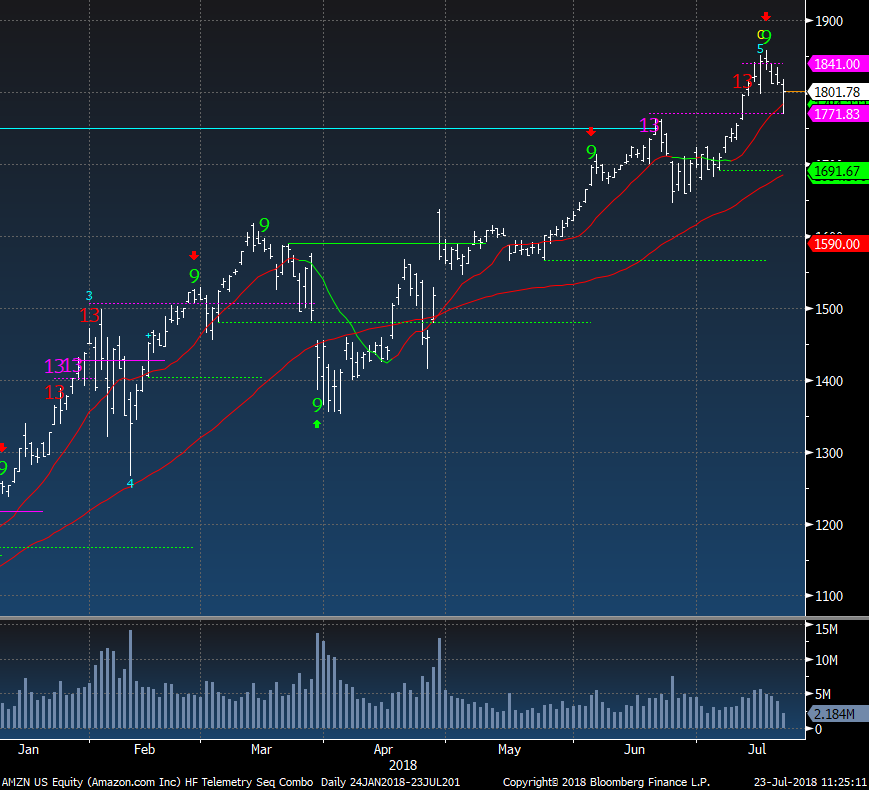
AMZN came within .70 of also making a weekly buying climax. Recent upside green 9 and red Countdown 13 on the upside is in play as well the weekly upside exhaustion - as you can see on the DeMark screens below under weekly 13
|
|
|
|
|
|
|
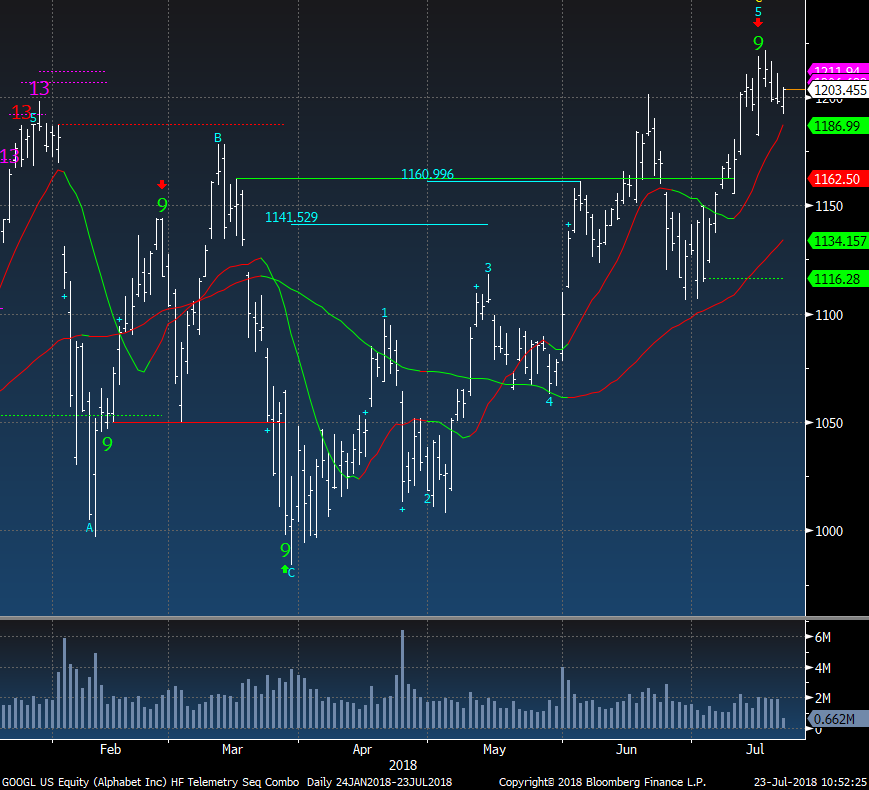
Google ahead of the earnings report
|
|
|
Google or Alphabet reports tonight after the close. The implied move is 4.25% and short interest is historically very low. There is only 0.81% of the float short with a short interest ratio of a low 1.21. At the peak in March there was 3.8m share short and today it is only 2.4m short. The point is that any lift would not be driven higher with short covering. Expectations are very high for this to lead the market higher. The last two quarters the stock was
down 5% the day after the report.
|
|
|
|
|
|
|
|
|
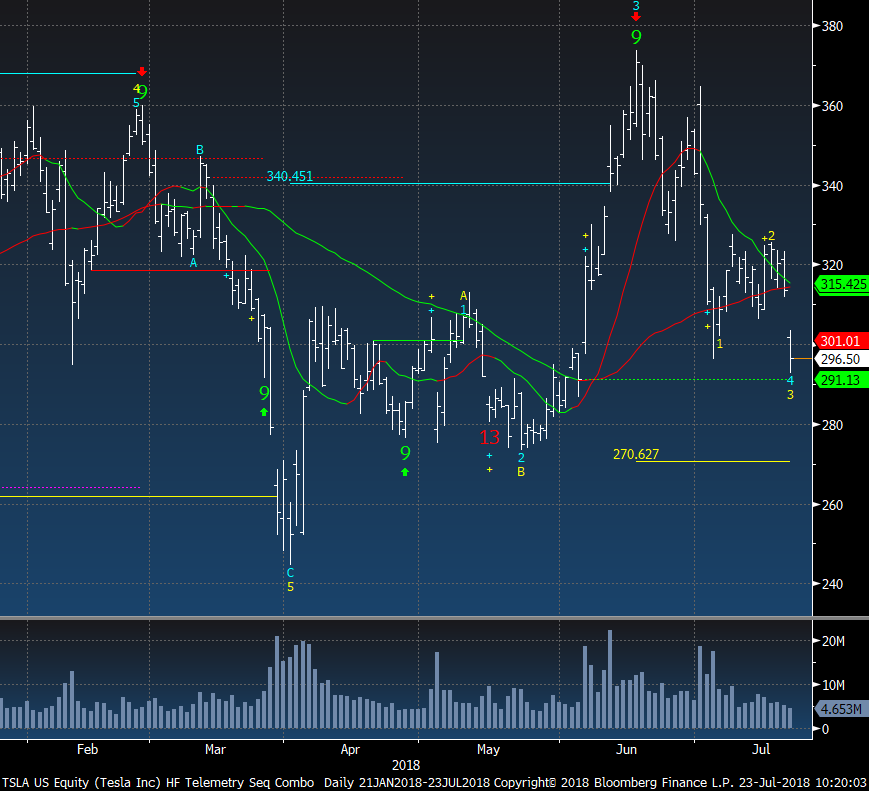
Tesla remains under a lot of pressure but considering the plethora of negative news, CEO behavior, etc this holds up pretty well...for now.
|
|
|
|
|
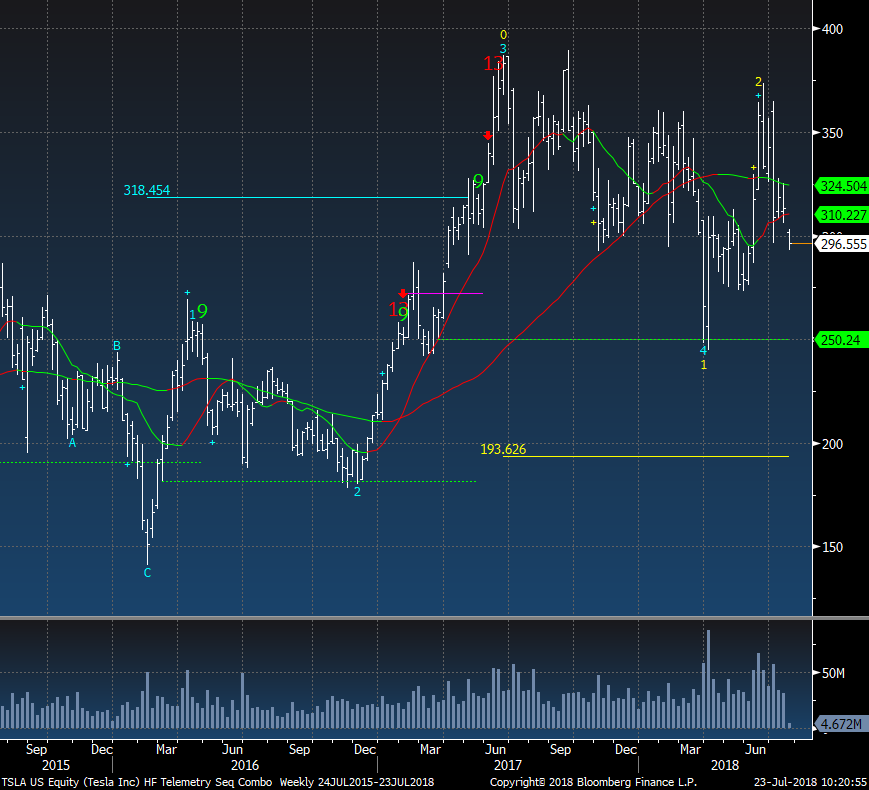
The weekly is more dramatic showing how the 300 level has been support in the past 18 months with only the short lived move lower in March.
|
|
|
|
|
|
|
|
|
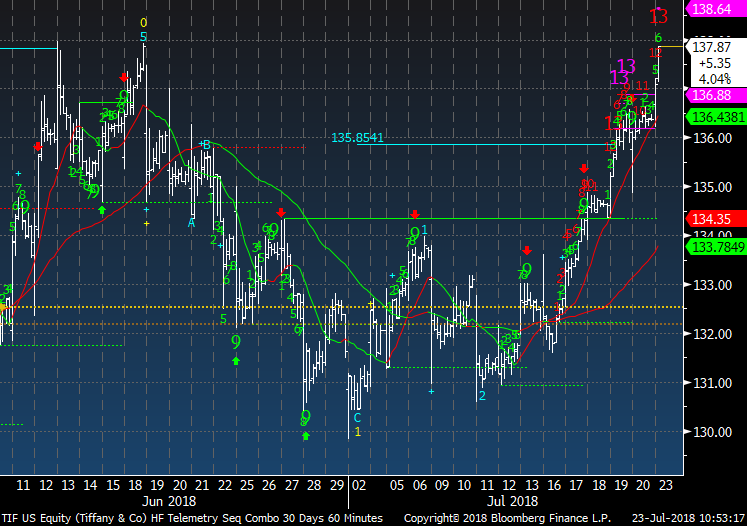
Tiffany 60 minute time frame shows some new upside exhaustion signals
|
|
|
|
|
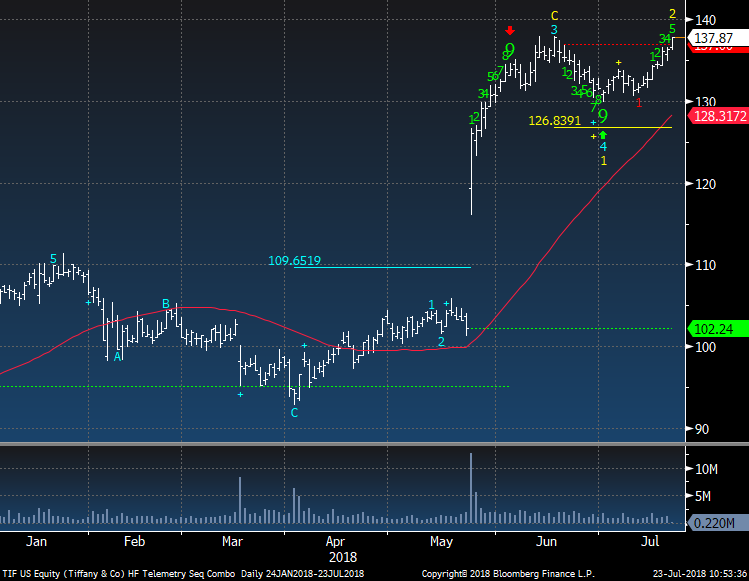
Tiffany on the daily time frames shows support at 130 after the strong gap up. I am short this and will hold for now. This strength seems excessive
|
|
|
|
|
|
|
|
|
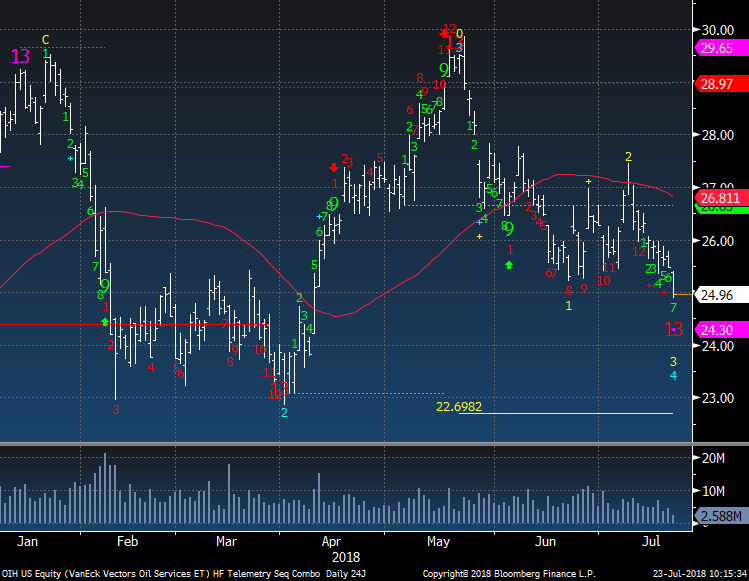
OIH Oil Service with a downside red 13 Countdown today
|
|
|
|
|
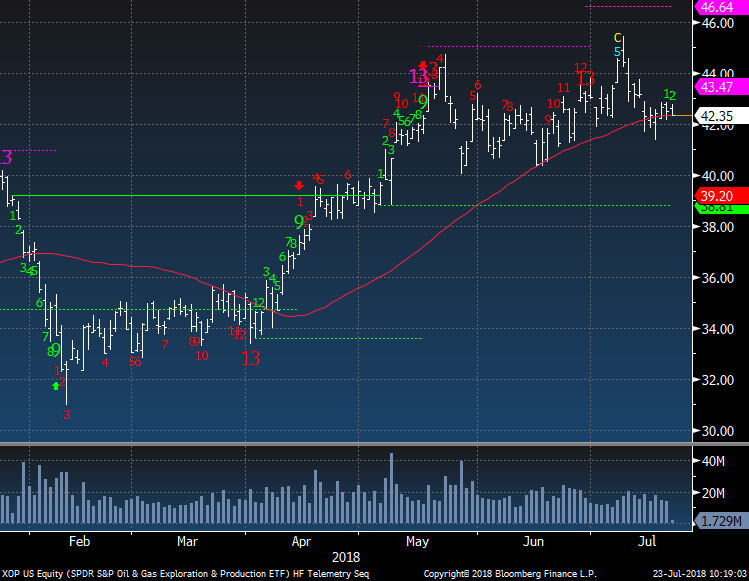
XOP holding the 50 day moving average.
|
|
|
|
|
|
|
|
|
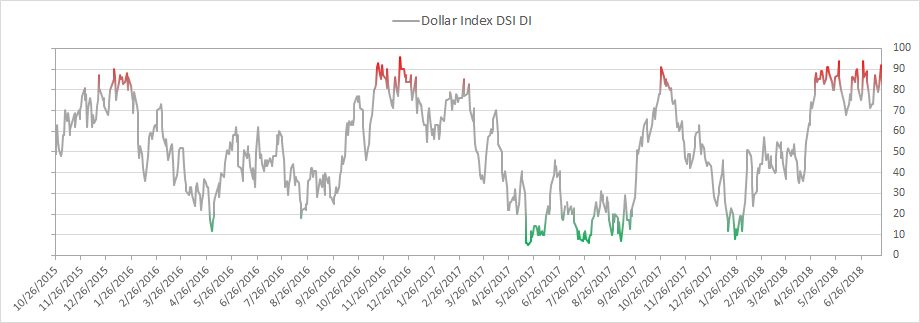
US Dollar bullish sentiment is at 83% down from the previous day of 92%
|
|
|
|
|
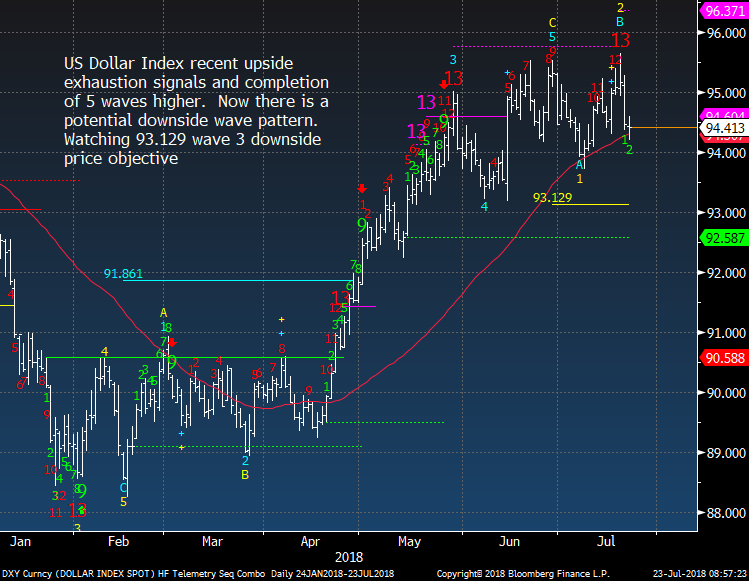
US Dollar Index is either building a wide range after this move or needs to work off the overbought sentiment.
|
|
|
|
|
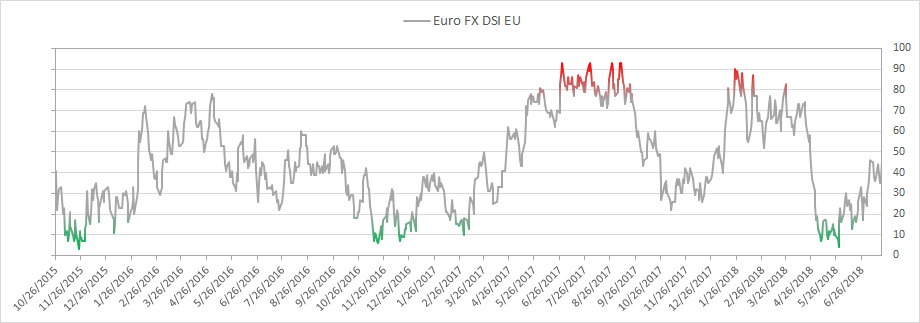
Euro bullish sentiment is at 46% and a new cycle high
|
|
|
|
|
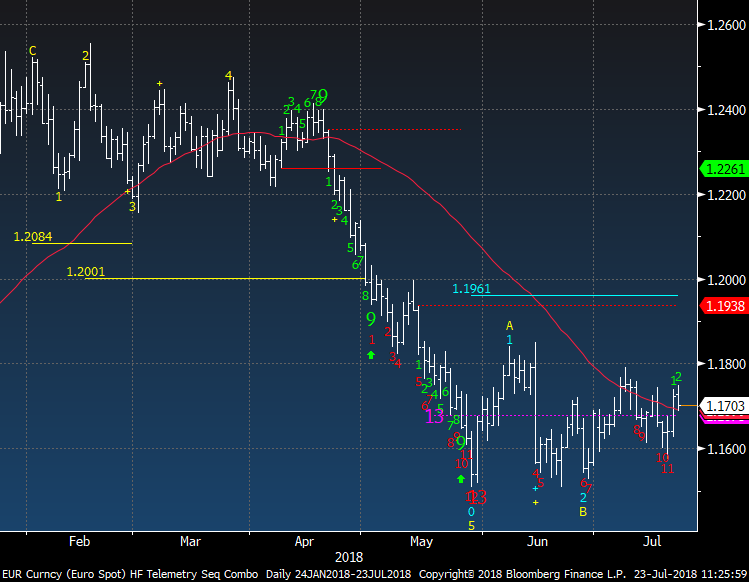
Euro Spot remains in the range
|
|
|
|
|
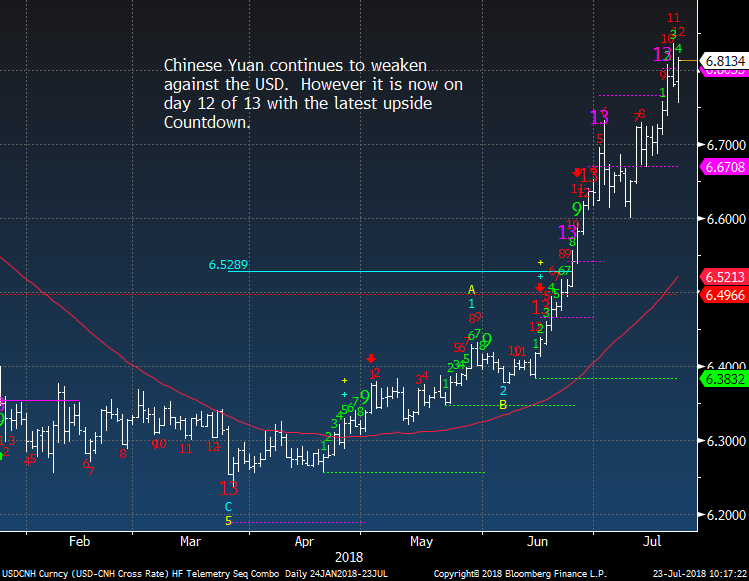
The most important currency people are watching
|
|
|
|
|
|
|
|
|
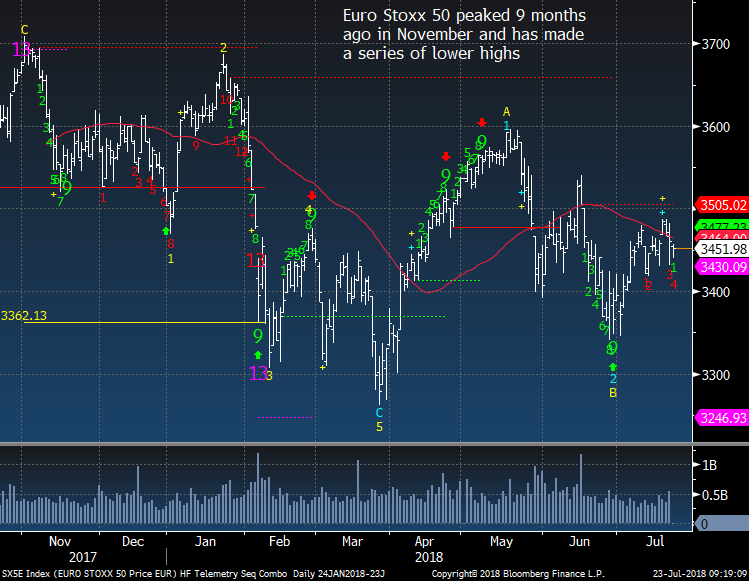
Euro Stoxx 50 still looks weak
|
|
|
|
|
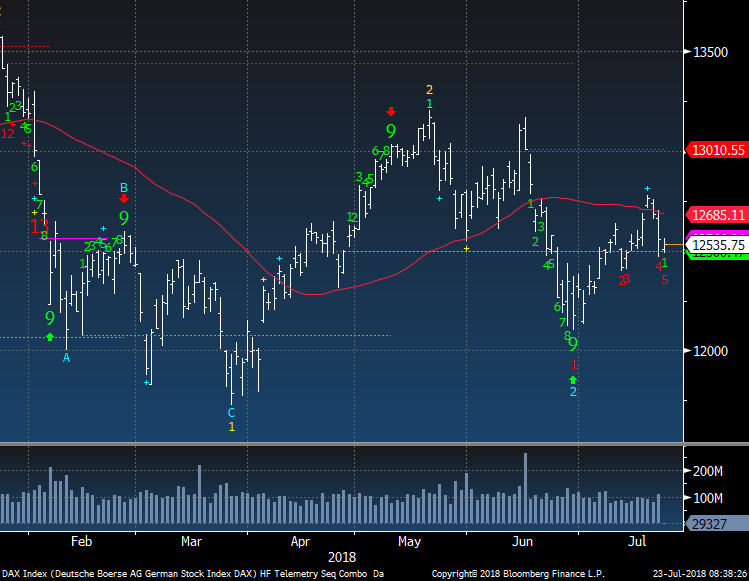
German DAX under the 50 day moving average and has a downside red Countdown on day 5 of 13
|
|
|
|
|
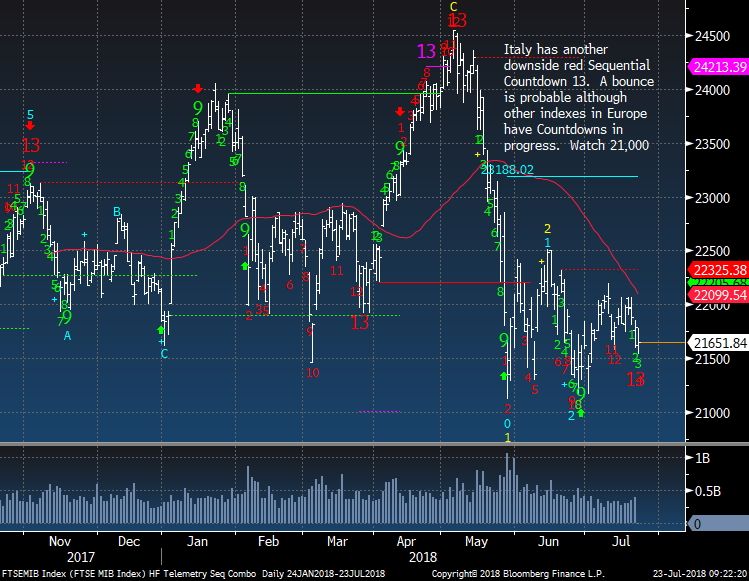
Italy has a downside red 13 exhaustion Countdown today.
|
|
|
|
|
|
|
|
|
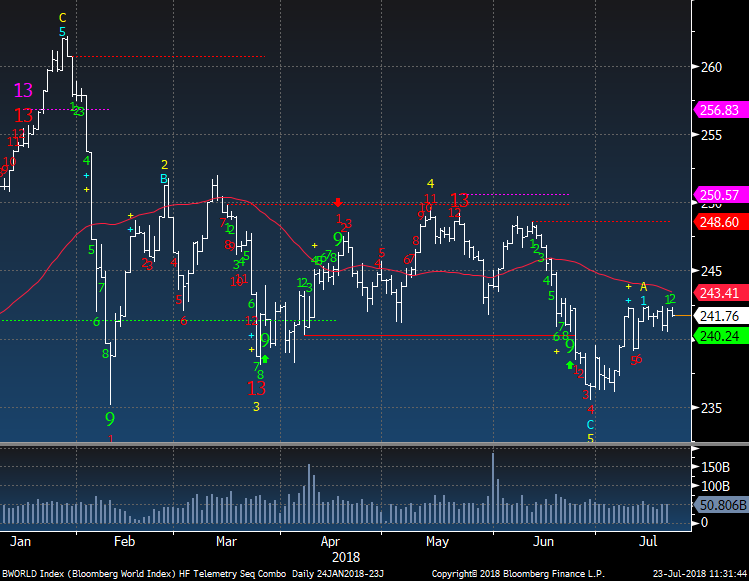
Bloomberg World Index still looks weak and sideways with a downside red Countdown on day 6 of 13
|
|
|
|
|
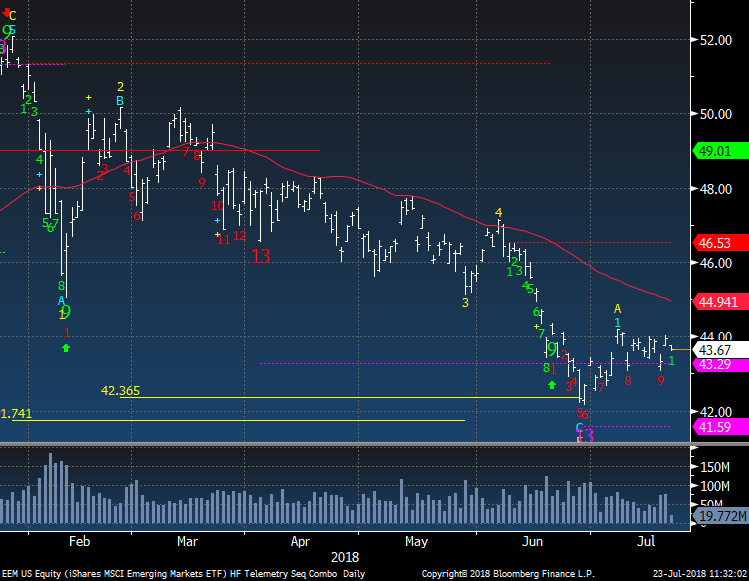
EEM Emerging Markets ETF looks sideways too on day 9 of 13 with a downside Countdown
|
|
|
|
|
|
|
|
|
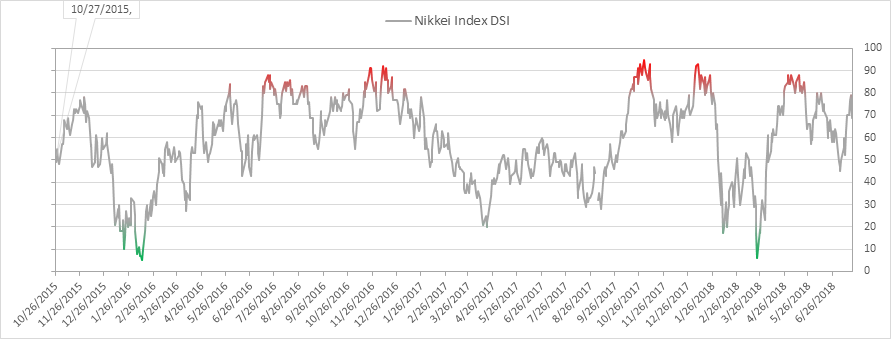
Nikkei bullish sentiment is at 69%
|
|
|
|
|
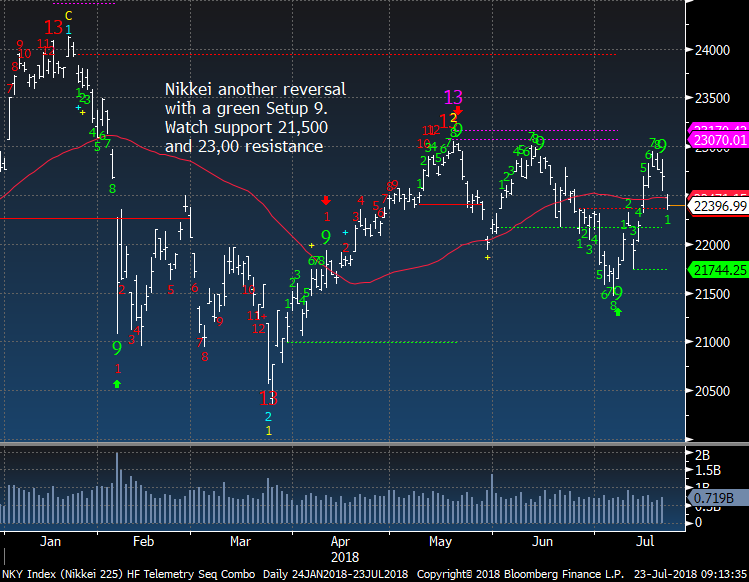
Nikkei reversed hard last night after the BOJ considered or floated some policy changes.
|
|
|
|
|
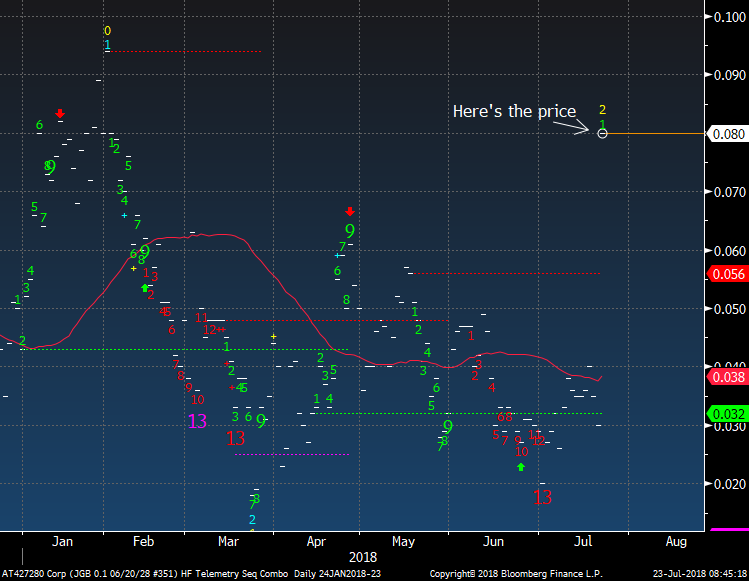
The Japanese 10 year yield spiked last night. If you call moving from 0.03% to 0.08% a spike
|
|
|
|
|
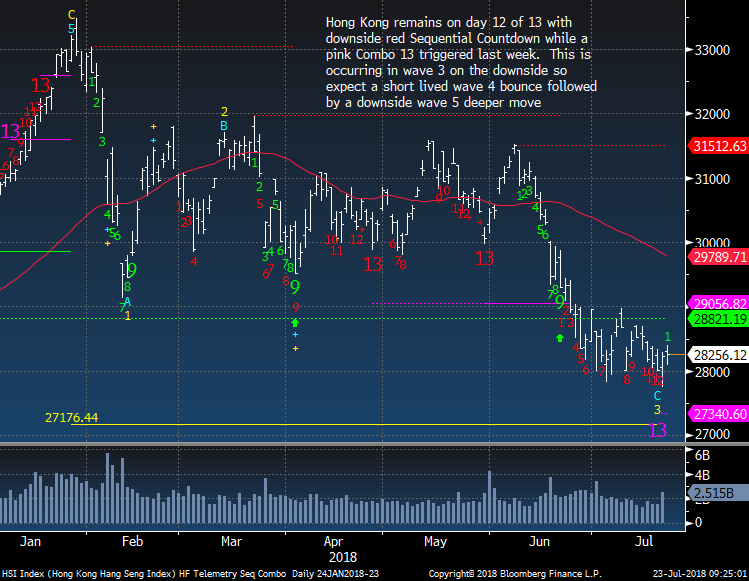
Hang Seng getting closer to a buy
|
|
|
|
|
|
|
|
|
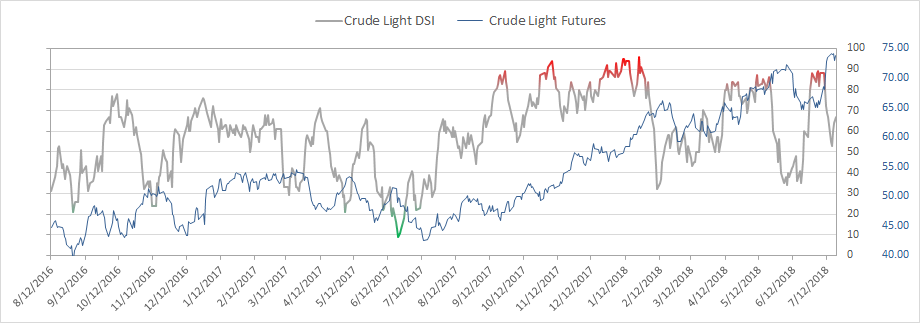
Crude bullish sentiment is at 67%
|
|
|
|
|
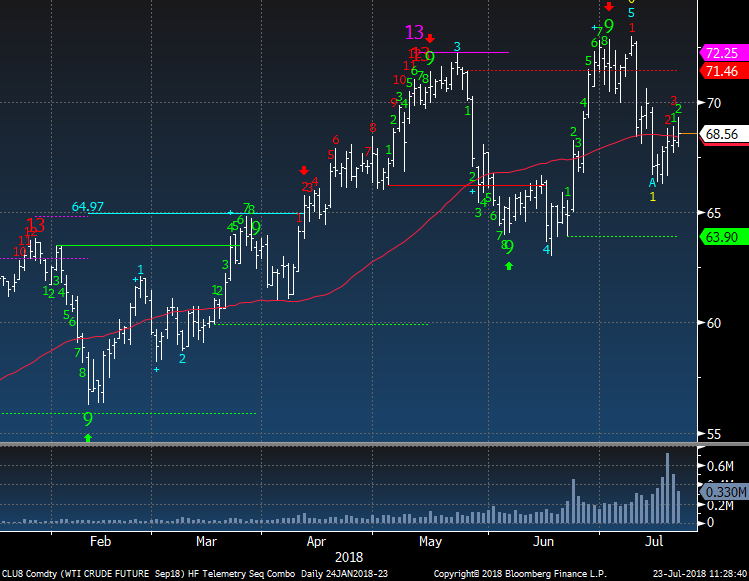
Crude bounced and with the roll in contract the red Countdown on the upside is now in play. I might discount this Countdown a little suspecting this won't make a new high.
|
|
|
|
|
|
|
|
|
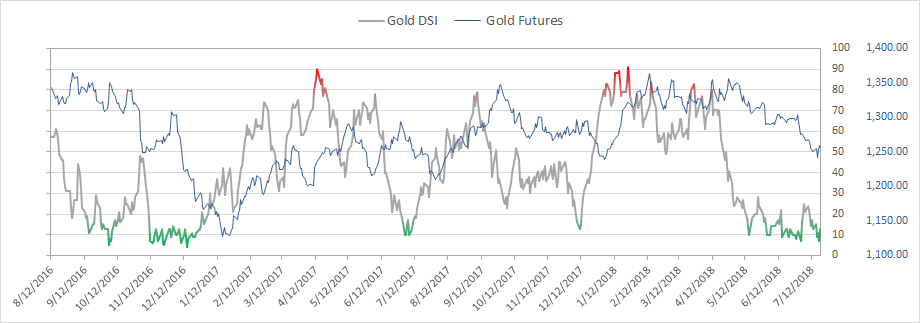
Gold bullish sentiment is at 13% and still is depressed
|
|
|
|
|
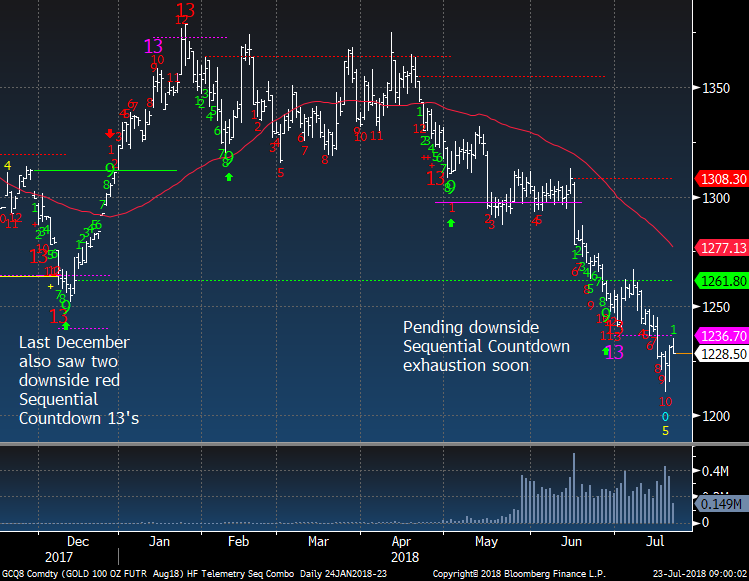
Gold Futures still needs a little more downside to get the 13 exhaustion
|
|
|
|
|
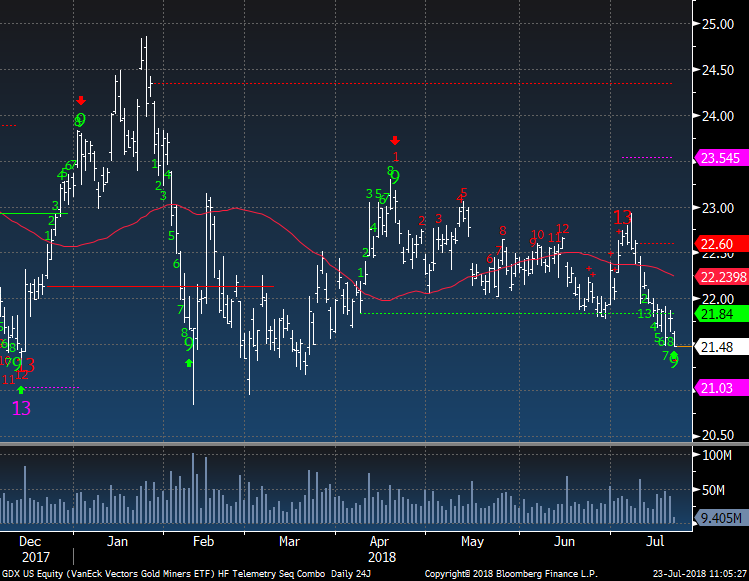
GDX Gold Miners has a green Setup 9 today and in the past has been good for a little inflection in the price. In other words, it better move up after this
|
|
|
|
|
|
|
|
|
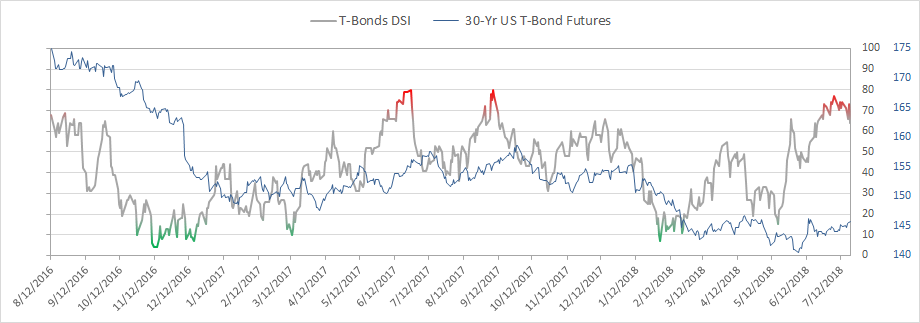
Bond bullish sentiment is at 64% and continues to fade off the recent high of 77%
|
|
|
|
|
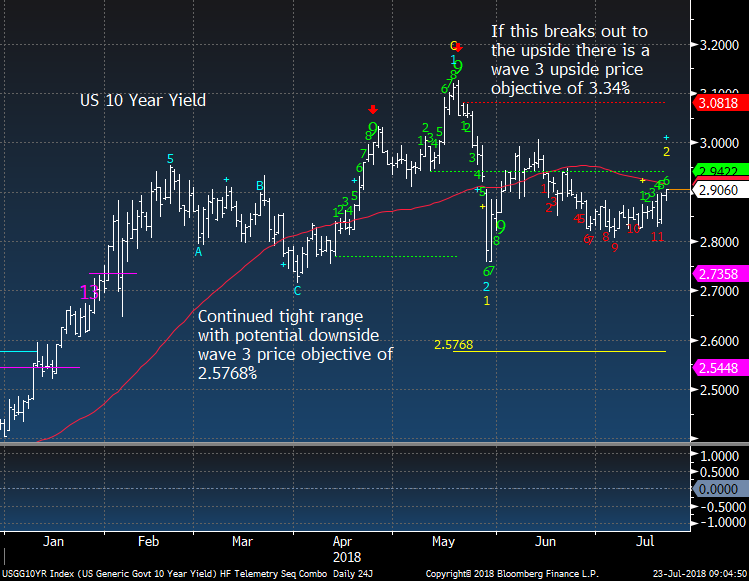
The US 10 year yield is now at 2.95% and is having a big sell off in the bond market today
|
|
|
|
|
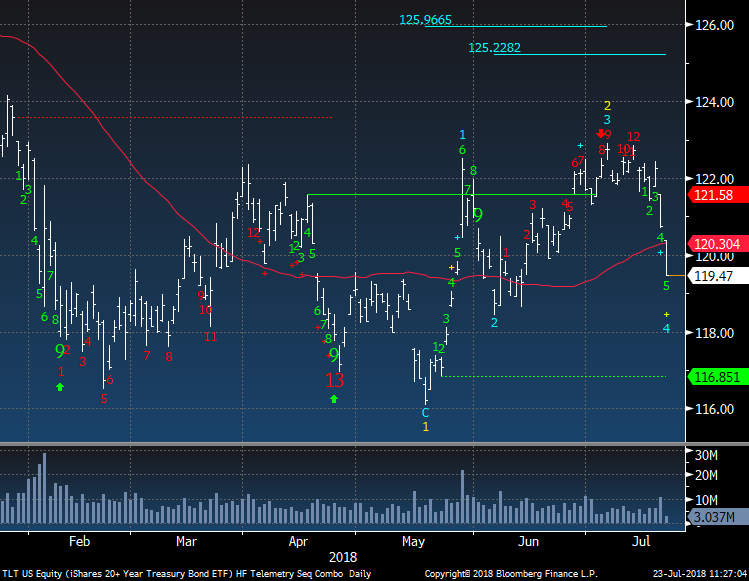
TLT Bond ETF diving as well. I am glad I at least sold half of the TLT long on the 12th of 13 day.
|
|
|
|
|
|
|
DEMARK SCREENS - Daily, Weekly, Monthly Upside/Downside Exhaustion Signals
|
|
|
Daily/Weekly DeMark upside/downside exhaustion signals (Sequential) weekly updated on Monday's and monthly on the first day of the new month. Price flips occur when a stock closes higher/lower than four previous closes and increases conviction of a price turn.
The upside 13's are sell signals and downside 13's are buy signals. Price flip's are confirmation signals that increases potential for a price trend change. For example, if you are long a stock and there is an upside 13, you will want to take cautious action by selling down or out of a position. If initiating a short sale with the upside 13's, we tend to start with a 1/2 size and add with the downside price flip. The opposite is true for when there are downside 13's. Take a 1/2 size position
and add with the upside price flip. The DeMark Indicators are designed to assist the user with buying into weakness and selling into strength to anticipate trend exhaustion. Selling into a rally and buying into a decline often afford the opportunity to exit a trade without too serious a loss if wrong.
S&P 1500 Universe:
DAILY UPSIDE 13: BDC, CNC, COF, FUL, HPT, HTLD, MASI, HLHR, NSIT, POOL, TSCO, TTEK
DAILY DOWNSIDE 13: MCK, MDRX
DAILY UPSIDE WITH PRICE FLIP REVERSAL DOWN: DRQ, EXPE, KMX, NTGR, SPG
DAILY DOWNSIDE WITH PRICE FLIP REVERSAL UP: HAL
Updated: 7/23/18
WEEKLY UPSIDE 13: ABMD, ADP, AET, AMZN, ATR, BC, CROX, DECK, HAE, HPQ, ITT, KLIC, KWR, MSI, NTGR, RLI, THG, TMO, TRN
WEEKLY DOWNSIDE 13: CYH, FTD, TGI, VIAB, WIN
Updated: 7/1/18
MONTHLY UPSIDE 13: ADI, AEE, BAX, BCOR, ETFC, ICUI, ITG, MED, MOH, NEE, SMTC, THG, TTEK, TXN, VICR, VSH, WCN, WST
MONTHLY DOWNSIDE 13: TUES
Euro Stoxx 600 Universe:
DAILY UPSIDE 13: SOBI SS
DAILY DOWNSIDE 13: GLE FP, NHY NO, SPSN SW
DAILY UPSIDE WITH PRICE FLIP REVERSAL DOWN: EOAN GR, ORP FP, RACE IM
DAILY DOWNSIDE WITH PRICE FLIP REVERSAL UP: NONE
Updated: 7/23/18
WEEKLY UPSIDE 13: AIR FP
WEEKLY DOWNSIDE 13:
PUB FP
Updated: 7/1/18
MONTHLY UPSIDE 13: BLND LN, CDI FP, CRH ID, DCC LN, DOM LN, RACE IM, REL LN, RMS FP, SXS LN, WKL NA, ZAL GR
MONTHLY DOWNSIDE 13: BMPS IM
|
|
|
Unsubscribe me from Hedge Fund Telemetry
Hedge Fund Telemetry LLC, P.O. Box 4675, Greenwich, CT 06861, United States
CONFIDENTIALITY NOTE and DISCLAIMER: This message is for the named person's use only. It may contain confidential, proprietary or legally privileged material. No confidentiality or privilege is waived by any accidental or unintentional transmission. If you receive this message in error, please immediately delete it and all copies of it from your system, destroy any hard copies and notify the sender. You must not, directly or indirectly, use, disclose,
distribute, print or copy any part of this message if you are not the intended recipient. Hedge Fund Telemetry LLC. cannot guarantee the confidentiality of the material transmitted; therefore, information of a sensitive or confidential nature should not be transmitted. There is risk in trading markets. Hedge Fund Telemetry LLC reports are based on information gathered from various sources and believed to be reliable, but are not guaranteed as to accuracy and completeness. The information is subject to change without notice and Hedge Fund Telemetry LLC has no obligation to provide any updates or changes. Hedge Fund Telemetry LLC is providing this data for informational and educational purposes and does not believe that it is sufficient to base an investment decision on. This information should not be regarded as a solicitation or recommendation of any particular security or to engage in any trading strategy. One should always check with your licensed financial
advisor to determine suitability of any investments.
|
|
|
|
|