|
|
|
|
|
|
Actions speak louder than Tweets
|
|
|
Two things on my mind. First, I've been doing a lot of reading on how China can and will likely respond to the US tariffs. What I have found is that they are playing long ball, standing back and letting the US lead the trade war. They are playing the victim and strengthening ties with other countries. They haven't responded back on Twitter or have they made speeches. China hasn't even determined who they might be negotiating with in Washington. They have their own issues as
the Chinese economy is weakening and they have had to take measures like cutting the RRR by 150bps this year, cutting taxes for individuals and businesses. They also have let the Yuan weaken. This is a powerful and effective measure. Back in August 2016 when they devalued the S&P 500 dropped 10% within 10 days. With Trump mentioning today potentially $500 billion in tariffs today during an interview on CNBC, the S&P futures dropped 10 points and quickly recovered. The truth is that there is only $16 billion in tariffs scheduled with only threatening tweets of $200 billion. China can and will respond if there are more actions but for now they just are sitting back. When they do, it won't be announced on Twitter and I am certain they will get people's attention.
Secondly, I noticed yesterday Trump said he "wasn't thrilled" with the Fed raising rates. His argument is that is will curtail all of the work that he has done for the economy. He's
right that raising rates will curtail some of the strength in the economy. He's also naive since there are many excesses in the economy and lacks understanding why the Fed is raising rates gradually is the prudent policy especially after 10 years of historically low interest rates. This is a very stretched and late market cycle. When the time comes for the Fed to inject liquidity into the markets, we want them to have that firepower. Trump isn't a big fan of higher rates too since when Trump Casino's issued debt in 1990 the yield was set at 16.50%. They defaulted on the first coupon payment. Don't you wish we had Twitter back then?
A little housekeeping note. The Hedge Fund Telemetry Daily Note is written each day in a similar way ESPN's Sports Center is presented. There are the usual
markets everyday which helps solidify trends and current levels on sentiment but the order of how things are presented is not organized together just like how Sports Center will have some baseball, basketball, back to baseball, then a little football. The goal is to get some of you who normally wouldn't be looking at currencies or some other market to understand the intertwined macro world. We are also making some changes on the Daily and website that will be rolling out this Summer. If you have any questions, comments, or suggestions - shoot me an email. Have a great weekend and thank you for all of your support. Please tell a friend!
Notable:
- US Markets - Sentiment still elevated and today I introduce 60 min time tactical time frames
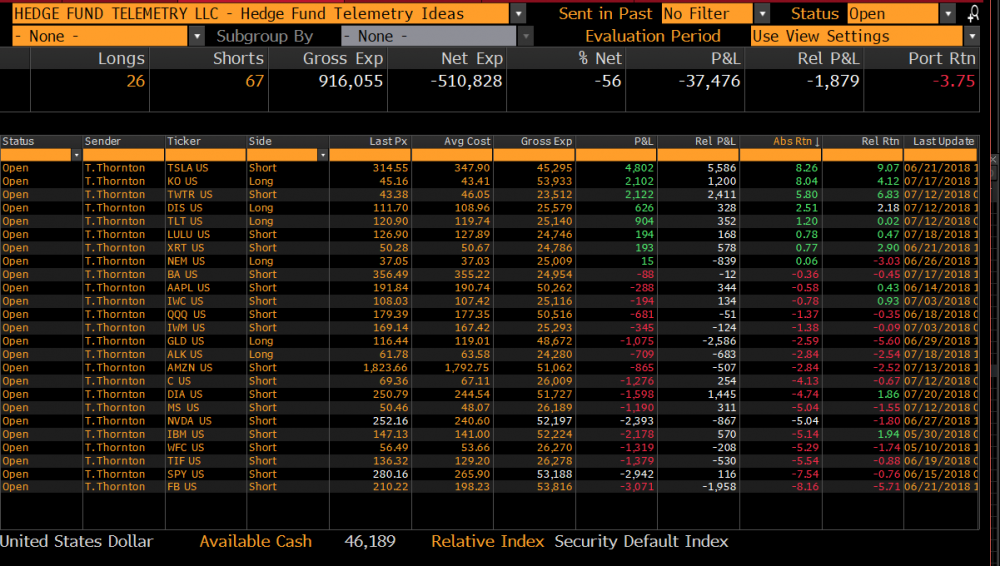
- Hedge Fund Telemetry Trade Ideas
- SPY vs TLT weekly upside exhaustion - Could stocks start underperforming bonds?
- Microsoft - Anatomy of a failed trade
- IBM Follow Up
- Currencies - Some important inflection points
- European Markets - Downside exhaustion Countdowns in progress
- Global Markets - EEM could start to outperform SPY soon
- Asian Markets - FXI near downside exhaustion and Nikkei reversal in a range
- Crude Update
- Gold Update
- Bond Update
- DeMark Screens - Daily, Weekly, Monthly upside/downside exhaustion signals within the S&P 1500 and Euro Stoxx 600
|
|
|
|
|
Here's a link to the Hedge Fund Telemetry market sentiment page with 40 charts of sentiment including equities, bonds, currencies, and commodities updated each day.
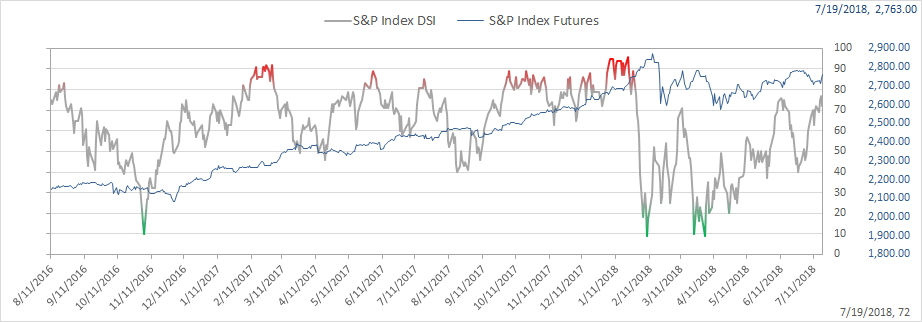
SPX bullish sentiment is at 72% down slightly from 78% recent peak
|
|
|
|
|
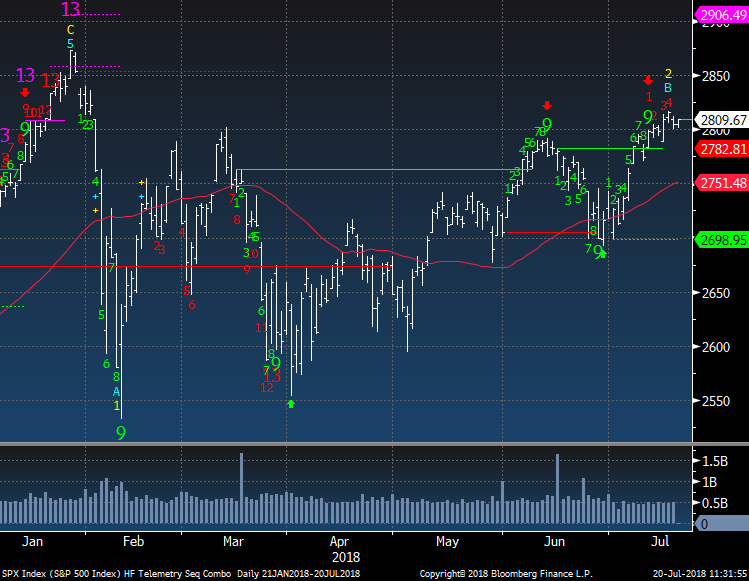
SPX daily had a recent upside green Setup 9 and with the follow through a new red Countdown is in progress on day 4 of 13. I have had doubts of a clean breakout and still do considering the upside exhaustion signals on the Nasdaq which has led the markets including the S&P.
|
|
|
|
|
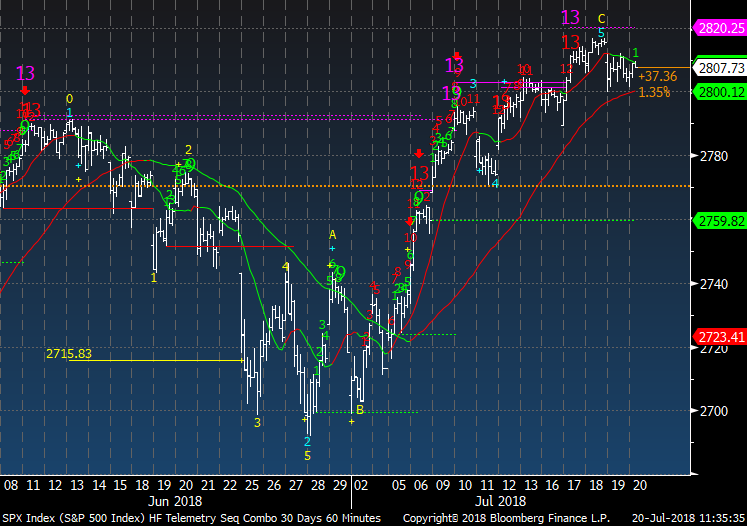
SPX 60 minute tactical time frame shows recent upside exhaustion signals in wave 5. (toppy)
|
|
|
|
|
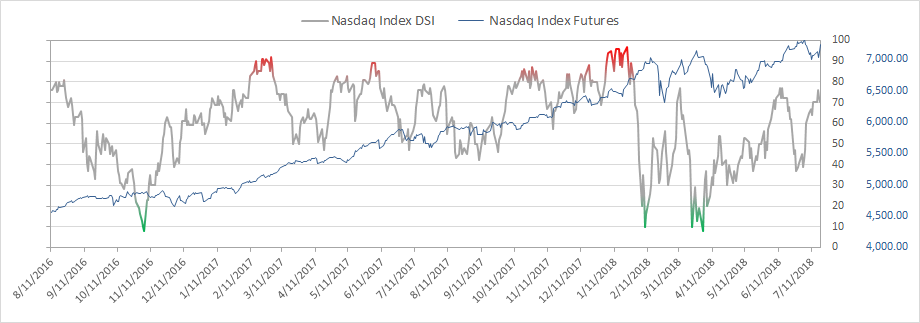
Nasdaq bullish sentiment is at 70%
|
|
|
|
|
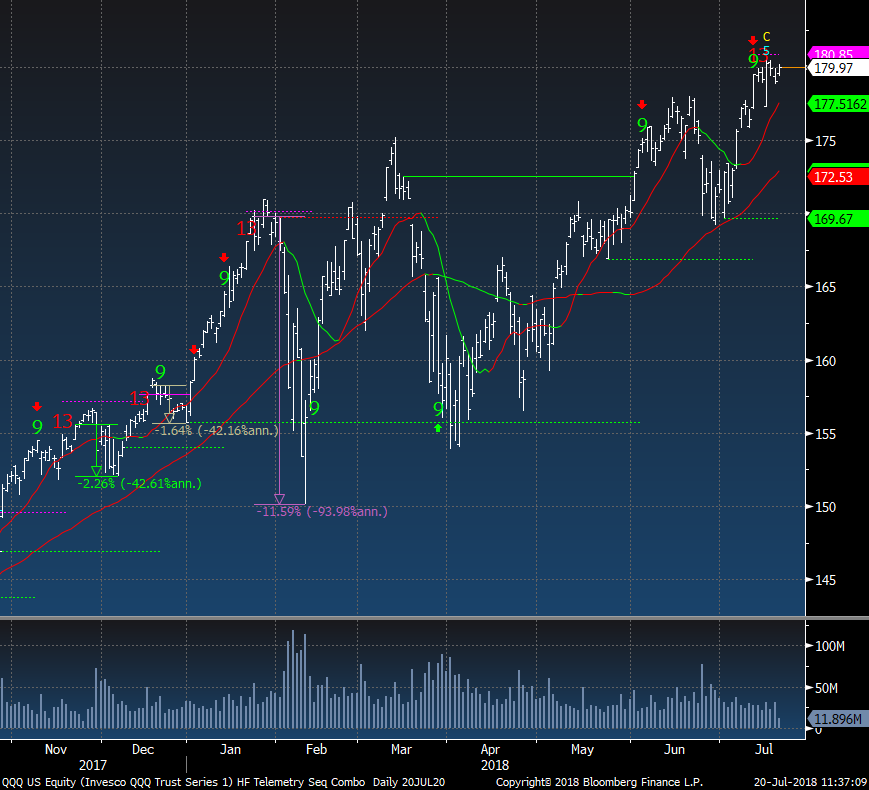
QQQ NDX Index recent upside exhaustion and lack of continuation
|
|
|
|
|
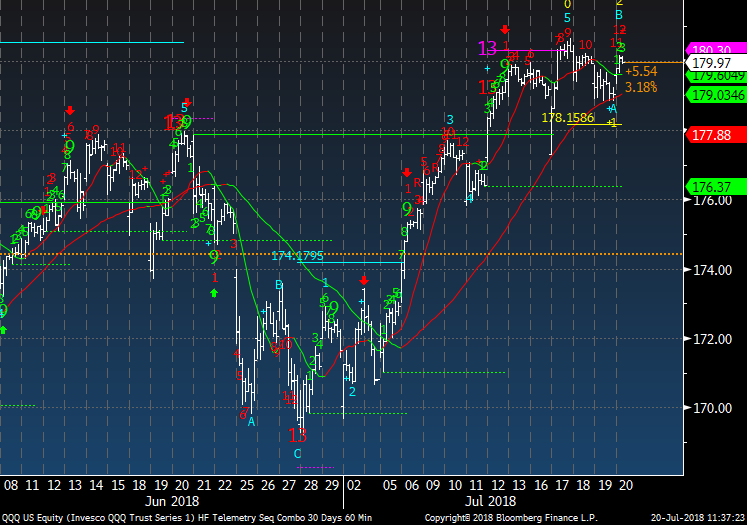
60 min is toppy as it has not made much upside for a week
|
|
|
|
|
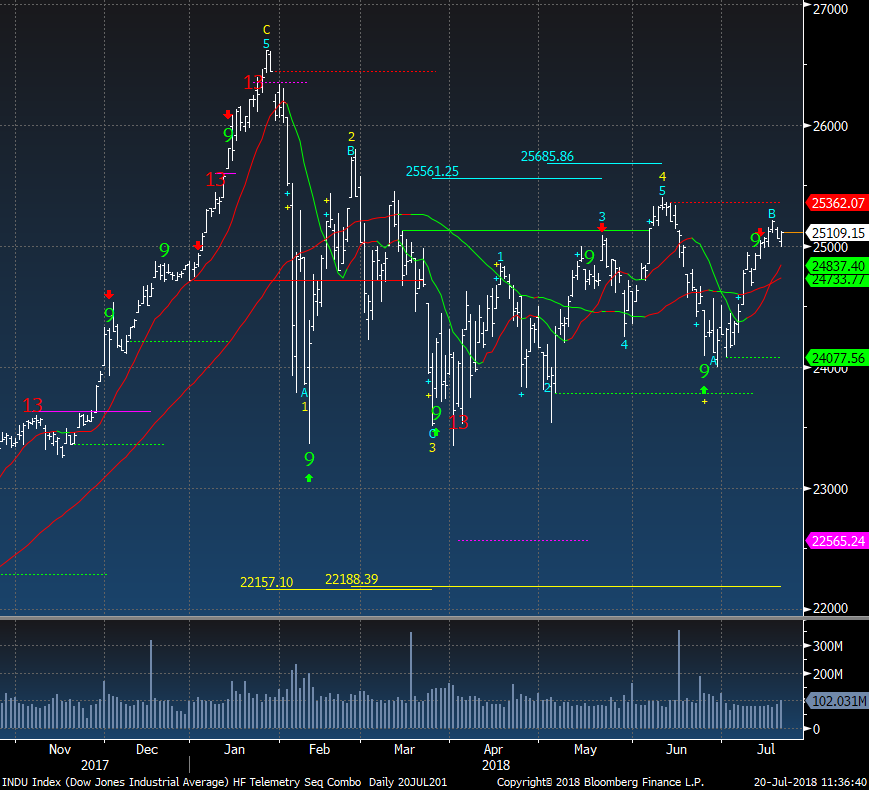
Dow Jones Industrial Average still below June highs
|
|
|
|
|
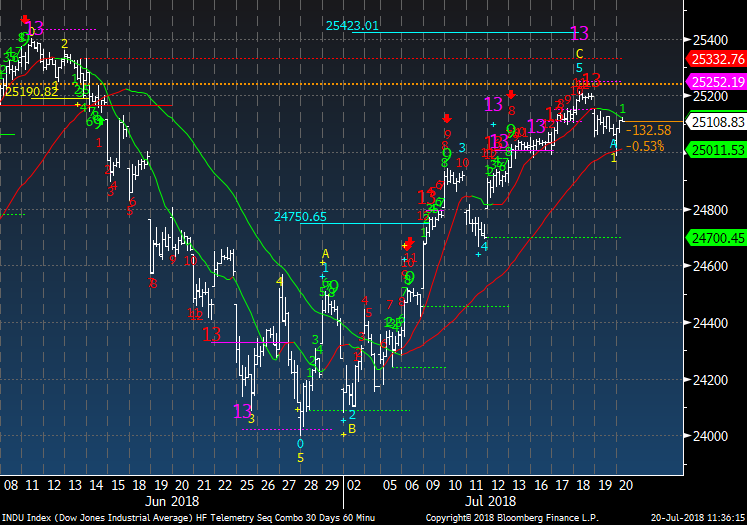
Dow 60 min also getting a lot of upside exhaustion signals with a slight roll over
|
|
|
|
|
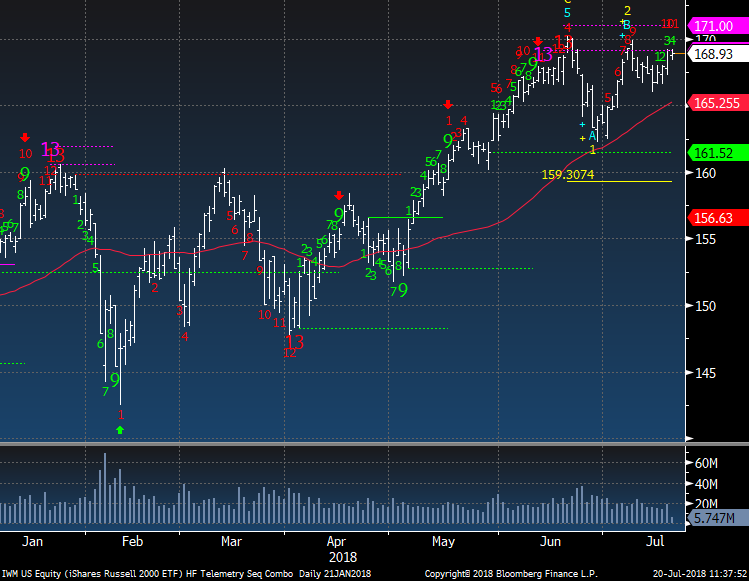
IWM Russell 2000 is now on day 11 of 13 with the secondary upside Countdown.
|
|
|
|
|
|
|
Hedge Fund Telemetry Trade Ideas
|
|
|
Trade Ideas - stopped out of MSFT short 2.5% sized. -10%
|
|
|
|
|
|
|
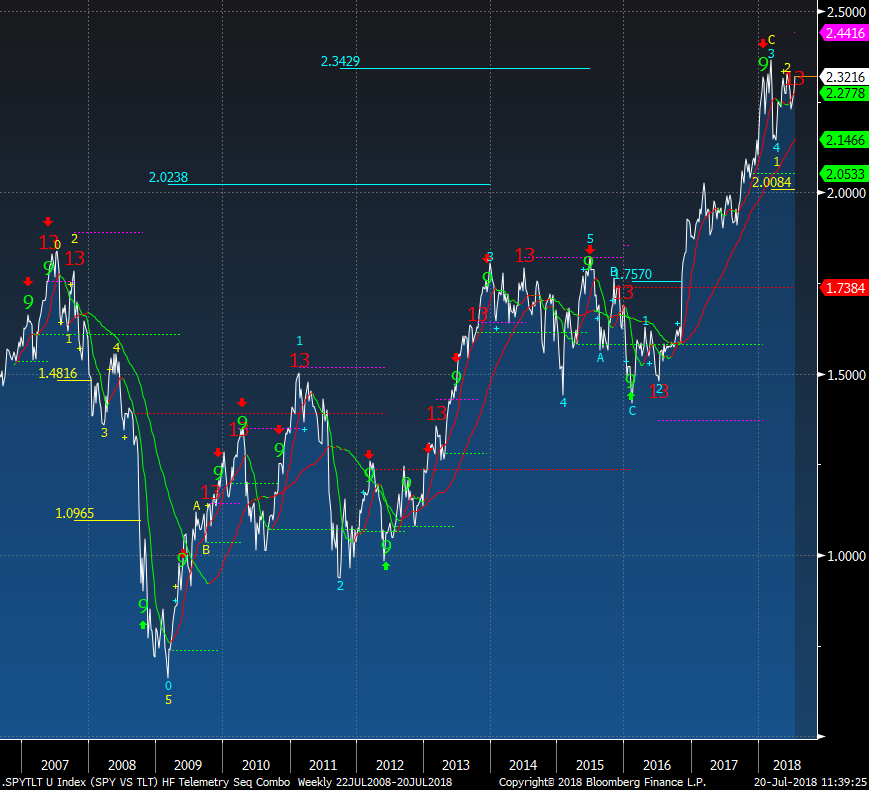
Notable: SPY vs TLT ratio
|
|
|
The weekly chart of the SPY vs TLT ratio (stocks vs bonds) has a new upside red Countdown 13 on the upside. The 13's have been good spotting inflection points in the past. Could be setting up for a bond rally and stock pullback
|
|
|
|
|
|
|
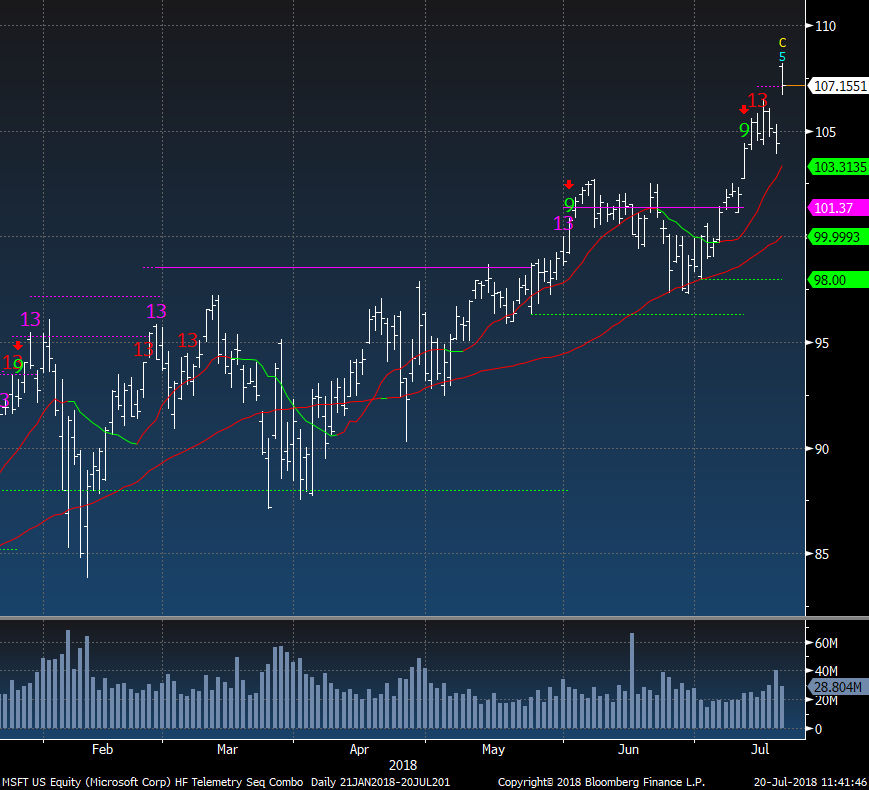
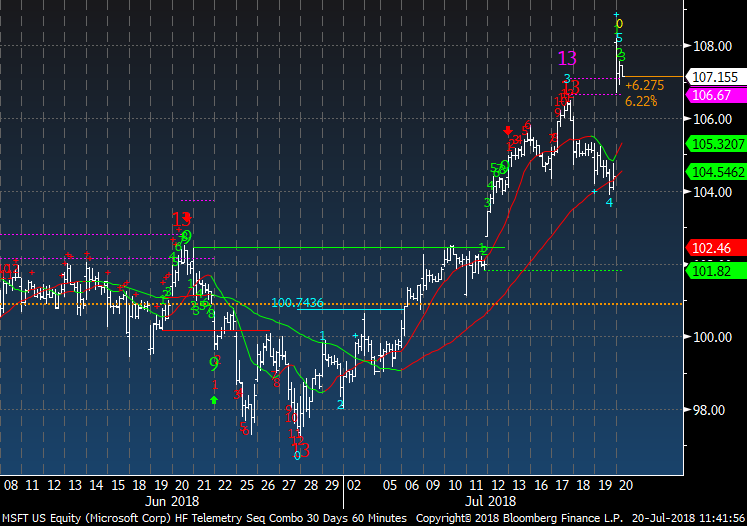
Microsoft - Anatomy of a failed trade
|
|
|
Microsoft was stopped out today after earnings were good. I didn't expect anything other than decent earnings but more a sell the news type of event which happened after the last earnings report. The stock gapped up and has faded but I'm jumping on my sword and stopping out. When I look back my entry was poor as I could have lived with waiting on the recent upside 13. I did however when it was in the 90's cover for a slight gain half of the original short
due the upside Countdown which was in progress.
|
|
|
|
|
Another issue was the 60 min time frame was not exhausting in wave 5 but in wave 3. The gap up was the 5th wave
|
|
|
|
|
|
|
|
|
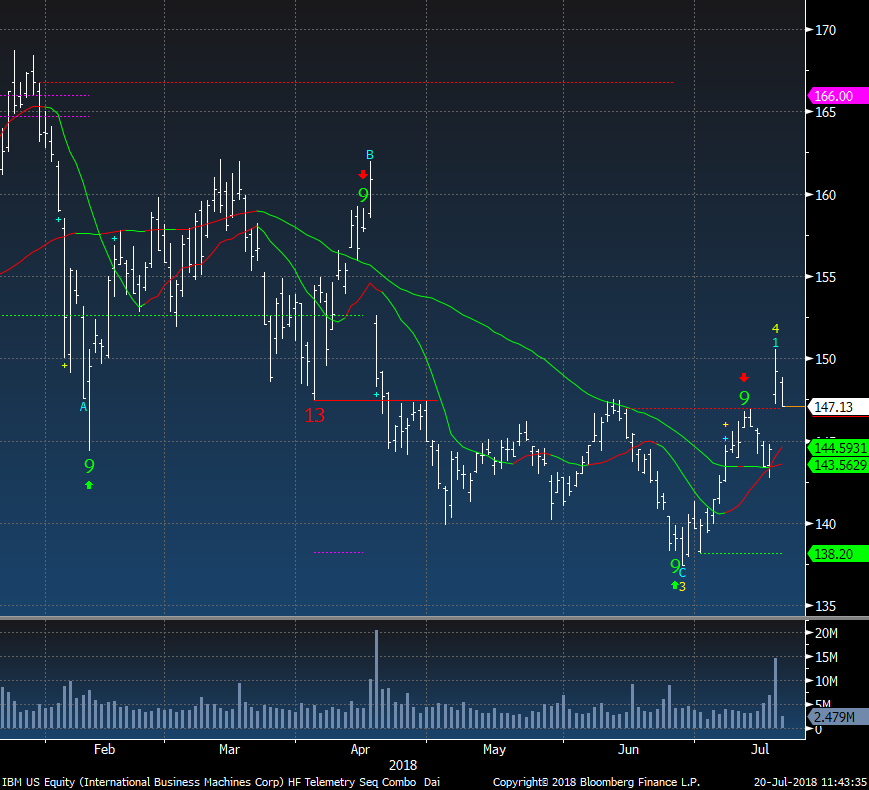
IBM reported the other day and moved higher on large volume. Today the stock is below the low from yesterday and we could be seeing a pattern of stocks moving up on news but fading soon after.
|
|
|
|
|
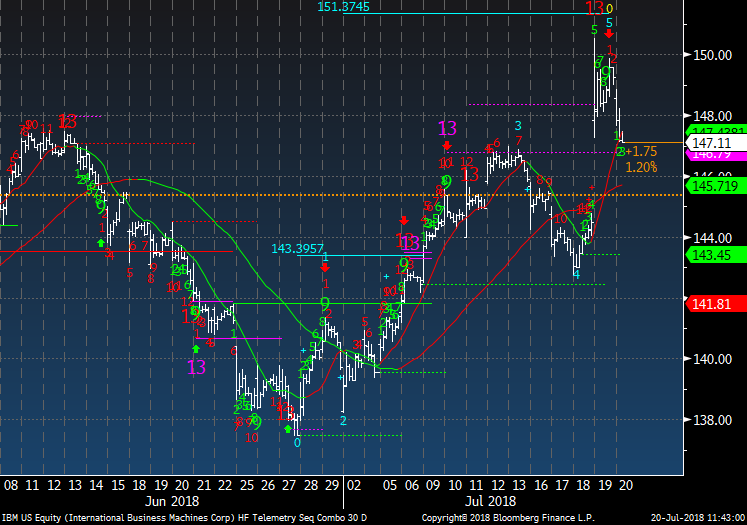
IBM yesterday nearly hit the 60 min time frame wave 5 price objective
|
|
|
|
|
|
|
|
|
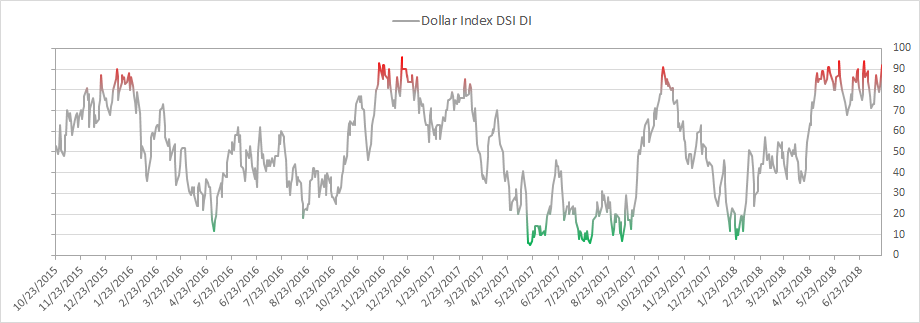
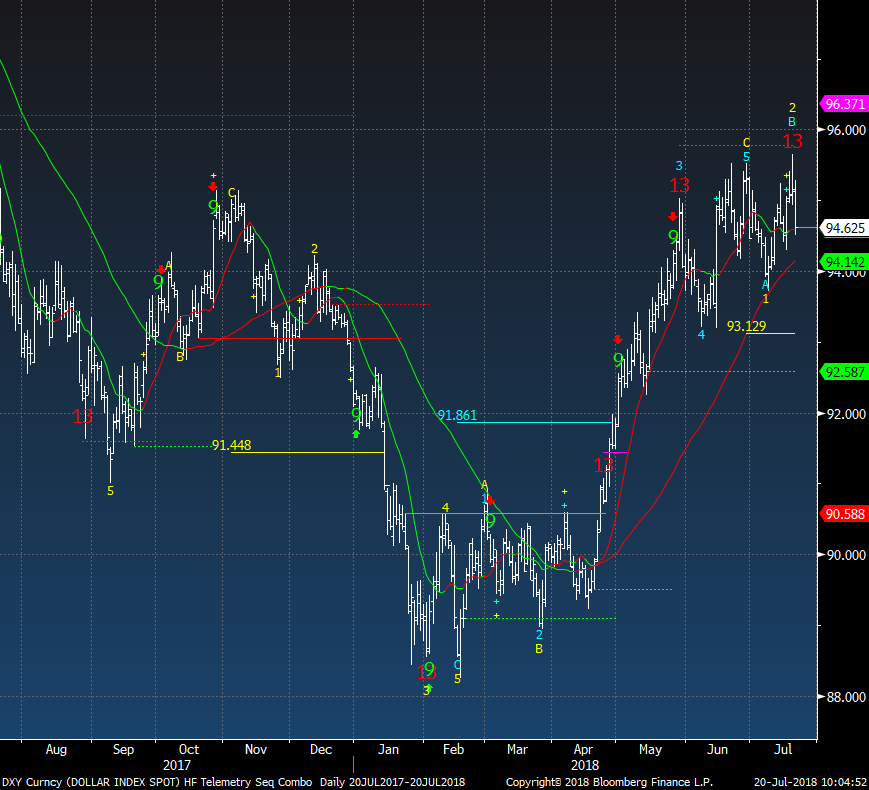
US Dollar bullish sentiment is at 92% and this is near the 94% level recently hit. This is extreme and without a doubt will pull back from here
|
|
|
|
|
US Dollar Index did get the upside exhaustion Countdown 13. I could see the USD consolidate for a little while but not make new lows
|
|
|
|
|
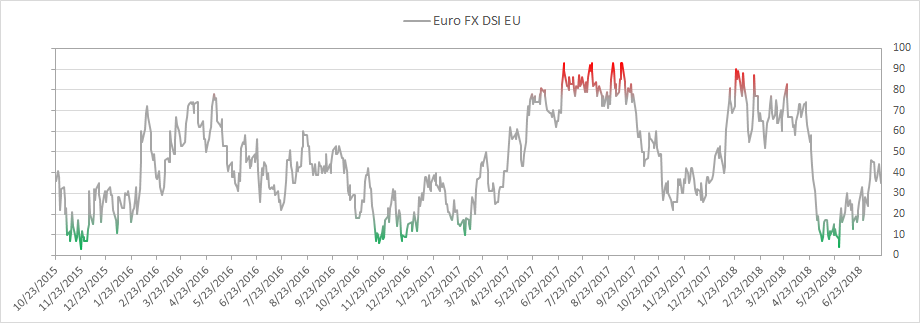
Euro bullish sentiment is at 37%
|
|
|
|
|
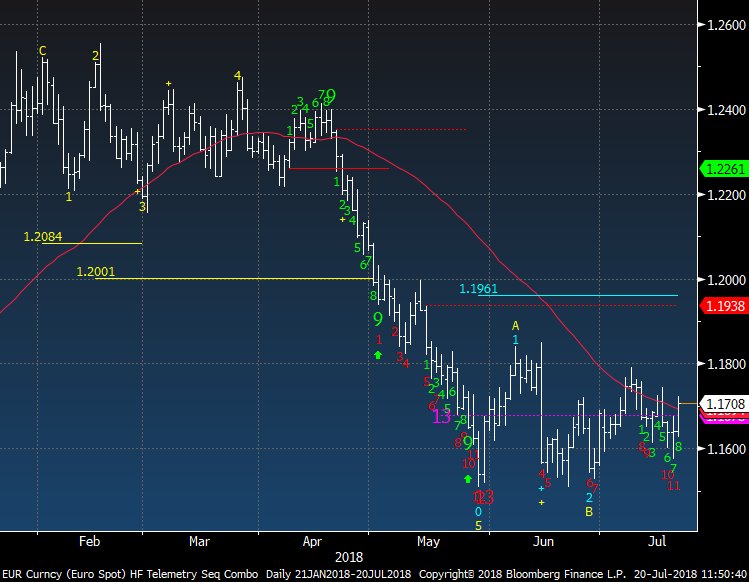
Euro Spot remains in a range but has now moved back over the 50 day. There is a wave 3 upside price objective of 1.19 that could come into play.
|
|
|
|
|
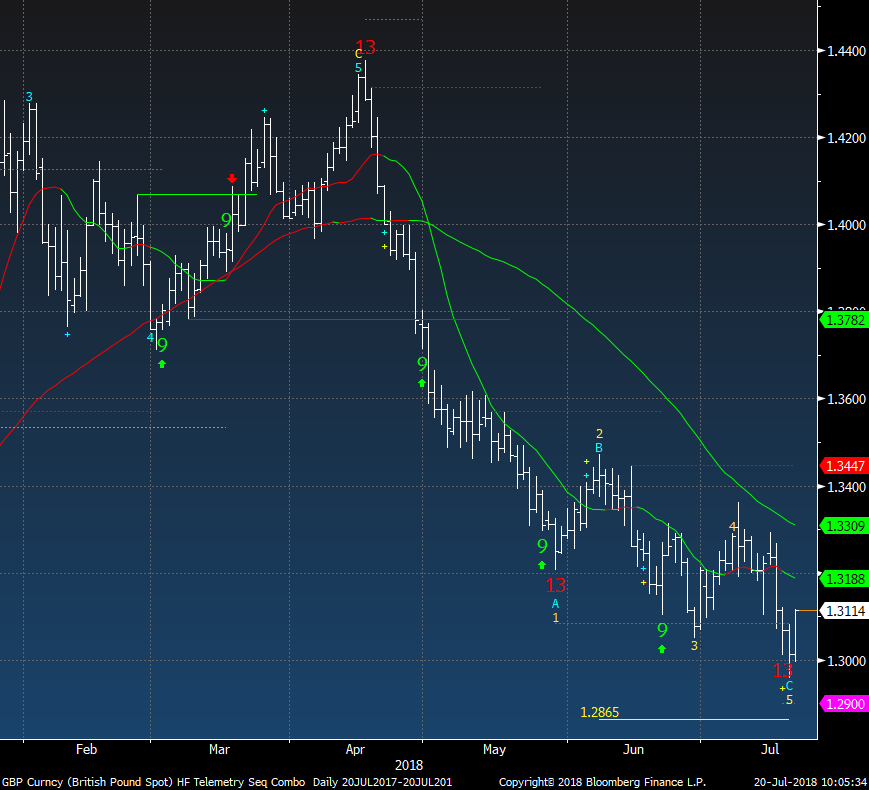
GBP British Pound did get the downside red Countdown 13 in wave 5 and is also reversing up
|
|
|
|
|
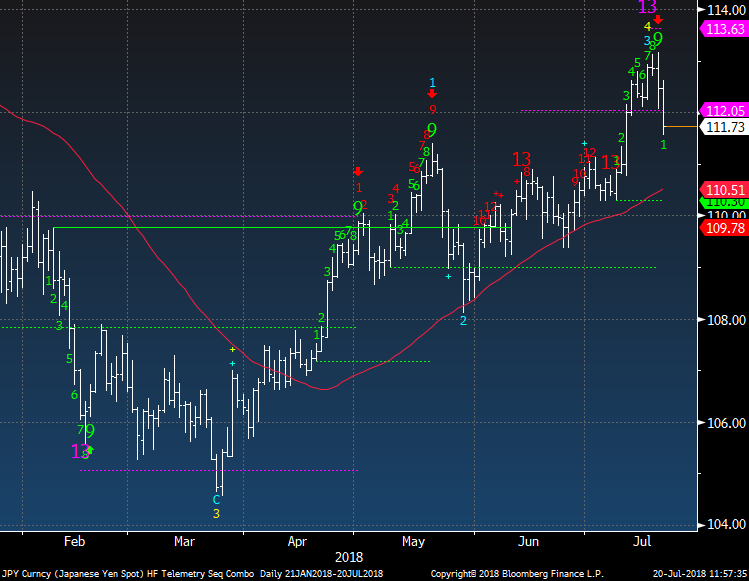
Japanese Yen is strengthening after the recent green Setup 9 and pink Combo 13 which have worked better than the Sequential red 13's
|
|
|
|
|
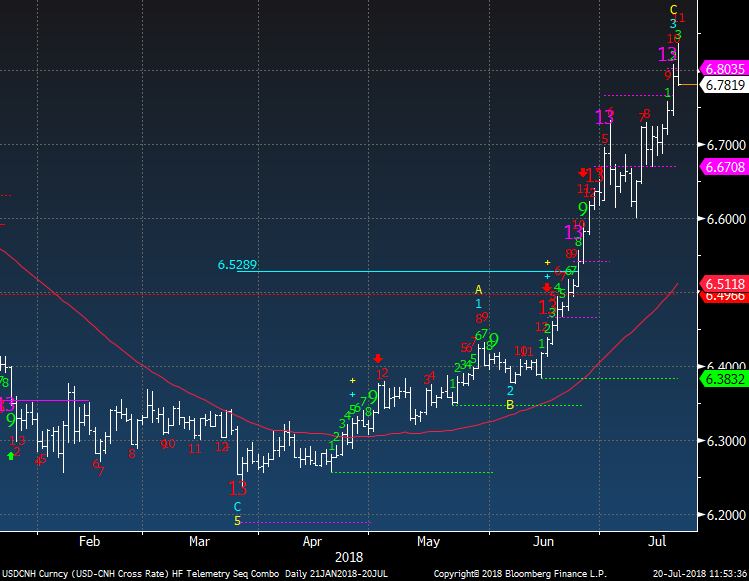
The most important currency everyone is now watching CNH Chinese Yuan continues to weaken and is on day 11 of 13 with a recent red Countdown. A big reversal today so stay tuned.
|
|
|
|
|
|
|
|
|
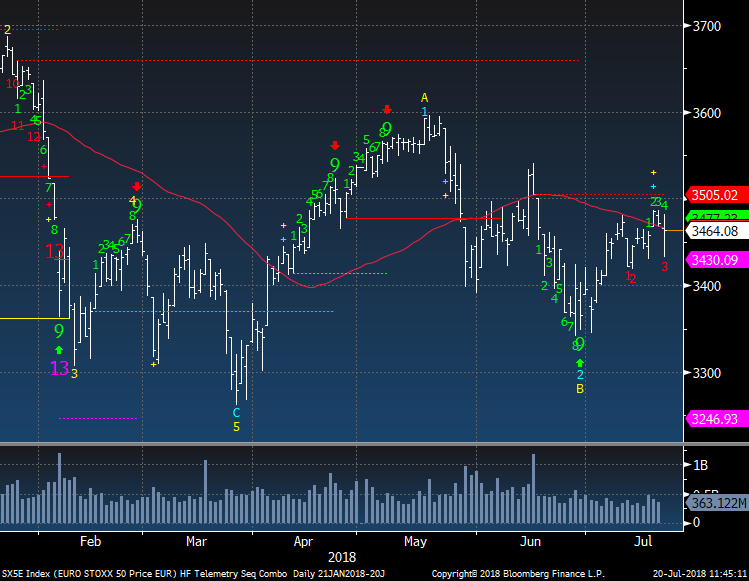
Euro Stoxx 50 failed at the 50 day again and now is on day 3 of 13 with a red Countdown
|
|
|
|
|
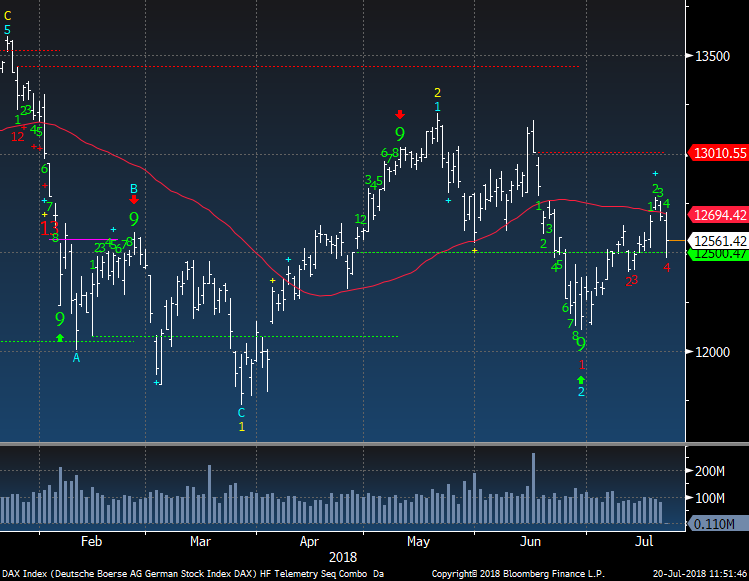
German DAX also failed at the 50 day and is now on day 4 of 13 with a red Countdown
|
|
|
|
|
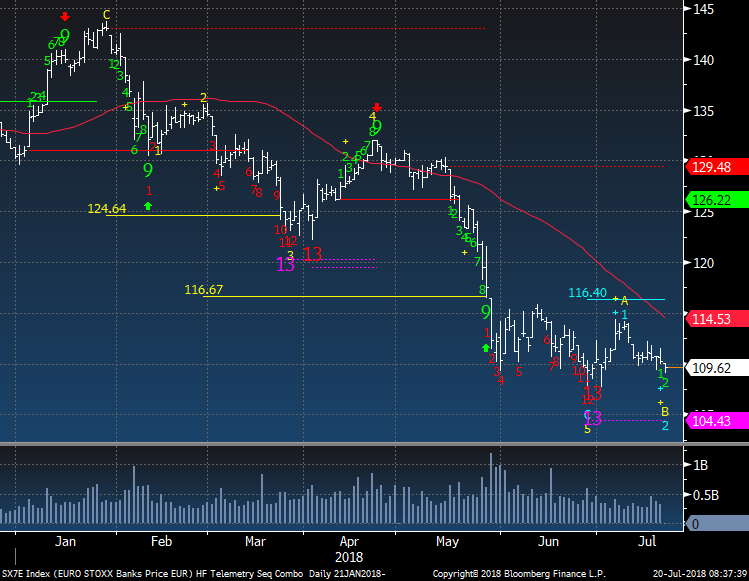
Euro Banks - Good news is they have not hit a new closing low and the bad news is it looks like this index will hit a new low very soon
|
|
|
|
|
|
|
|
|
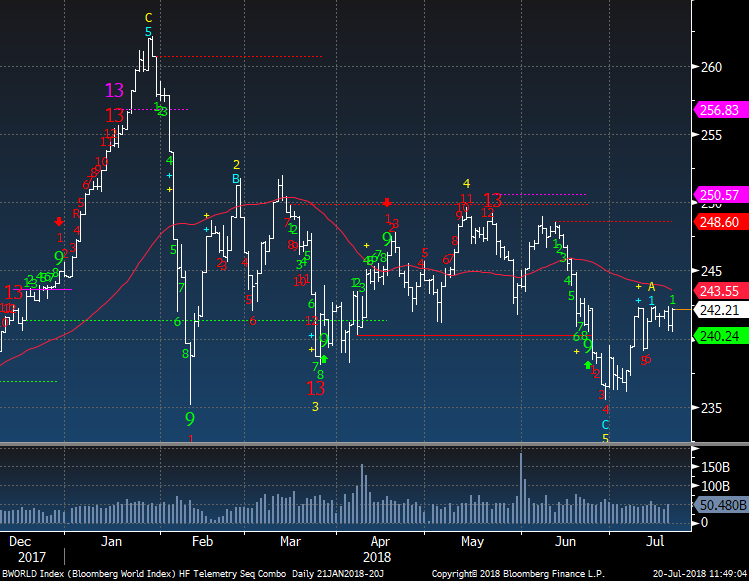
Bloomberg World Index still below the peaks in Feb-June.
|
|
|
|
|
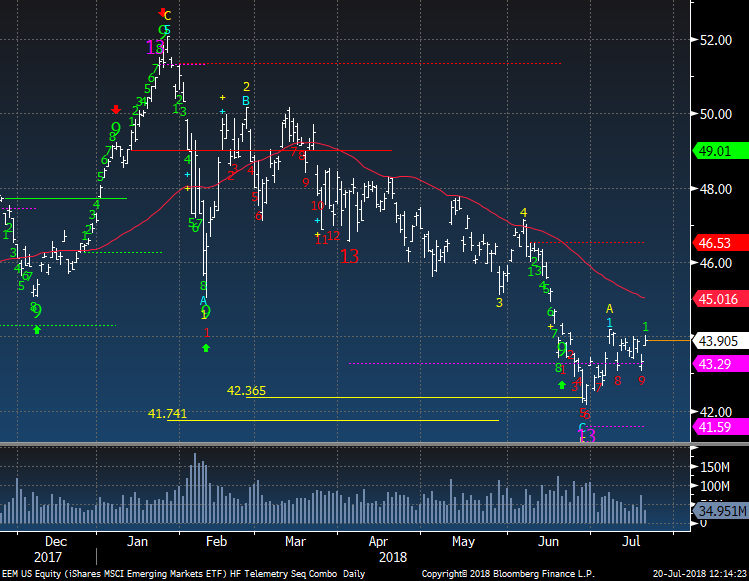
EEM Emerging Markets ETF is trying to bottom but there remains a downside red Countdown on day 9 of 13.
|
|
|
|
|
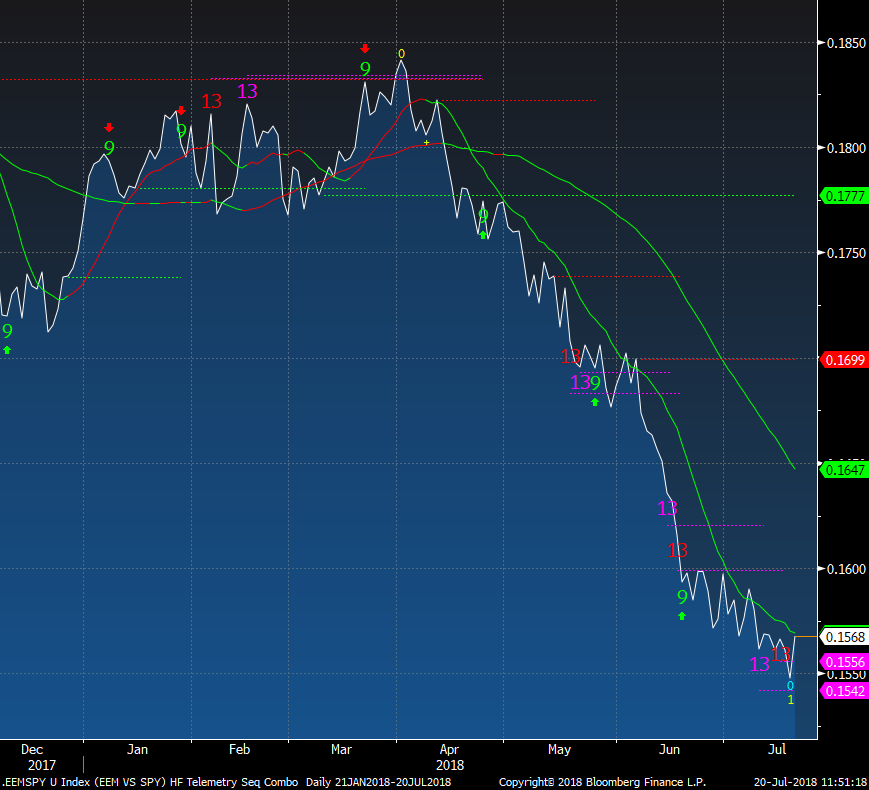
EEM vs SPY ratio has more downside exhaustion signals and is trying to turn. Remember when Jeremy Grantham was saying to buy as much EEM as your career would allow? There were upside exhaustion signals then and now there are downside signals. I'm starting to warm up to the idea especially if the USD consolidates
|
|
|
|
|
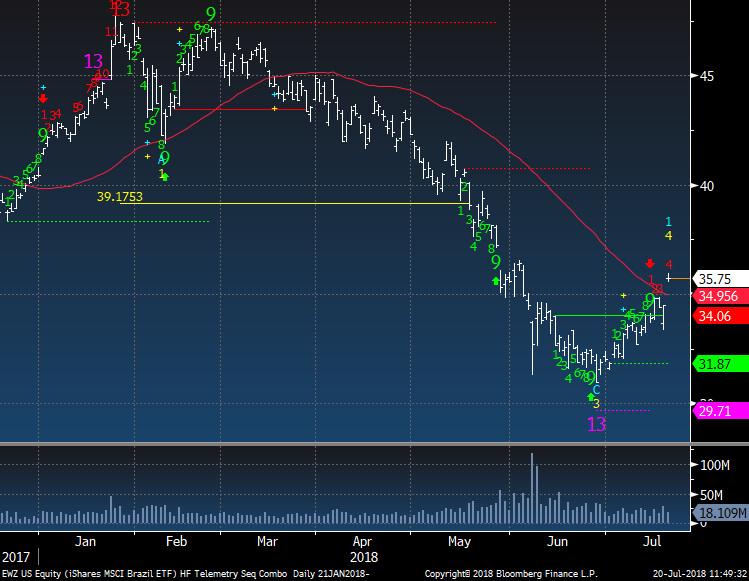
Brazil has been on my do not buy list all year and it might be trying to bottom however this big move down was only wave 3 of 5 and there should be one more push lower ahead. A move up now would be in wave 4 and could be worth playing small on the long side with super tight stops
|
|
|
|
|
|
|
|
|
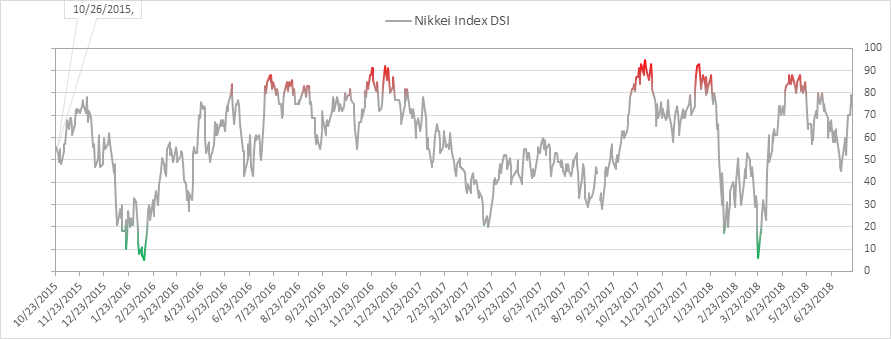
Nikkei bullish sentiment is at 74% and is elevated
|
|
|
|
|
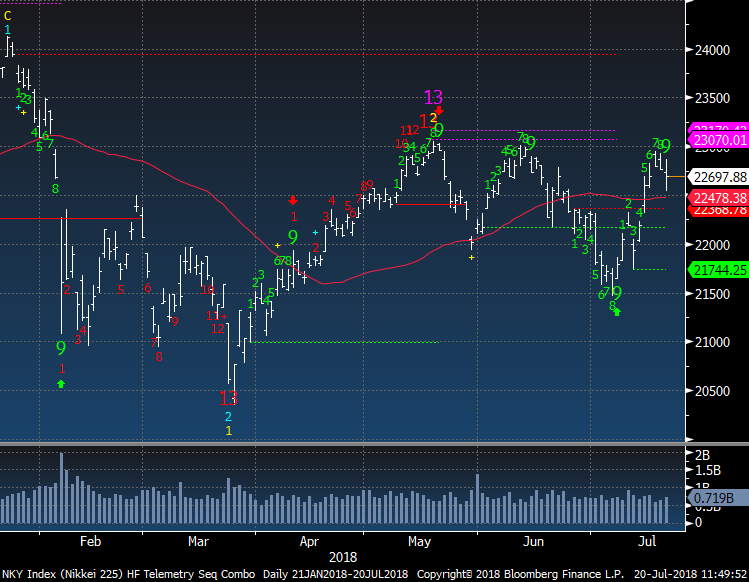
Nikkei has reversed after the green Setup 9 as expected. Range bound action
|
|
|
|
|
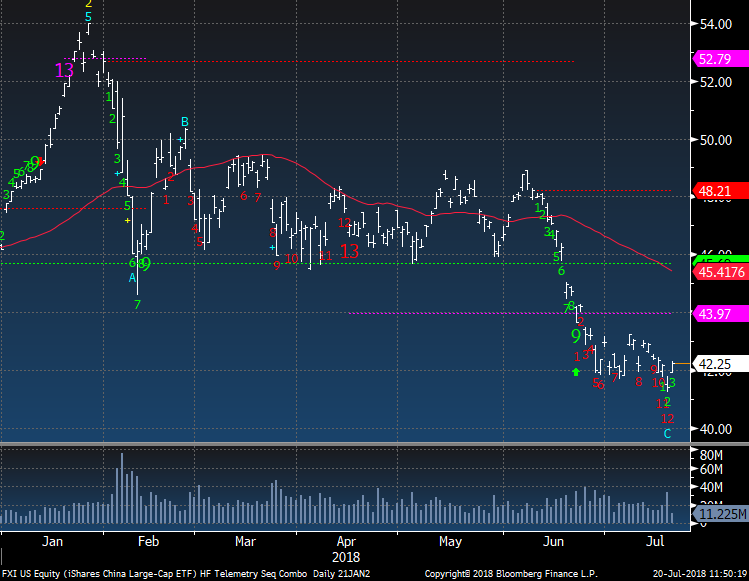
FXI Hong Kong China ETF was just mentioned on CNBC as traders are buying puts. You can also get a free book on how to trade options from the pony tail guys who are spotlighting this action. These guys are notoriously late to trades. Its on day 12 of 13 with a downside Countdown. A bounce is ahead
|
|
|
|
|
|
|
|
|
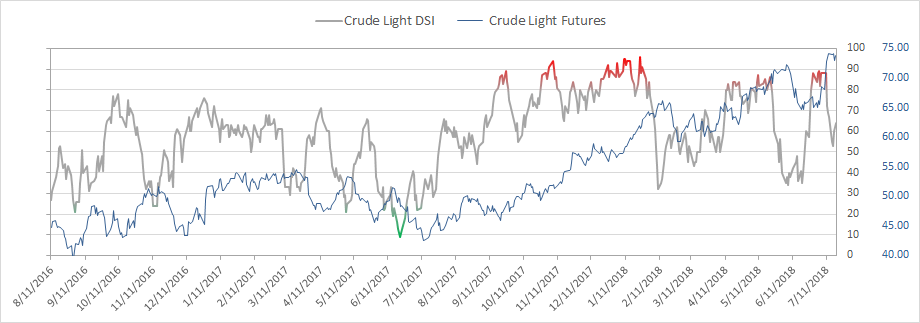
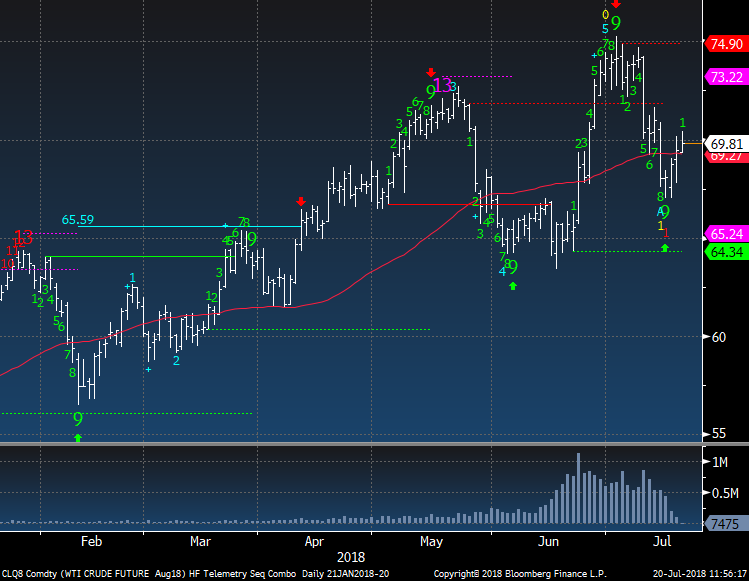
Crude bullish sentiment is at 64% and held the 50% level which is bullish for a bounce
|
|
|
|
|
Crude reversed on the green Setup 9 but this was the 1st of 5 wave down unless a new high is made. More on this next week as it develops
|
|
|
|
|
|
|
|
|
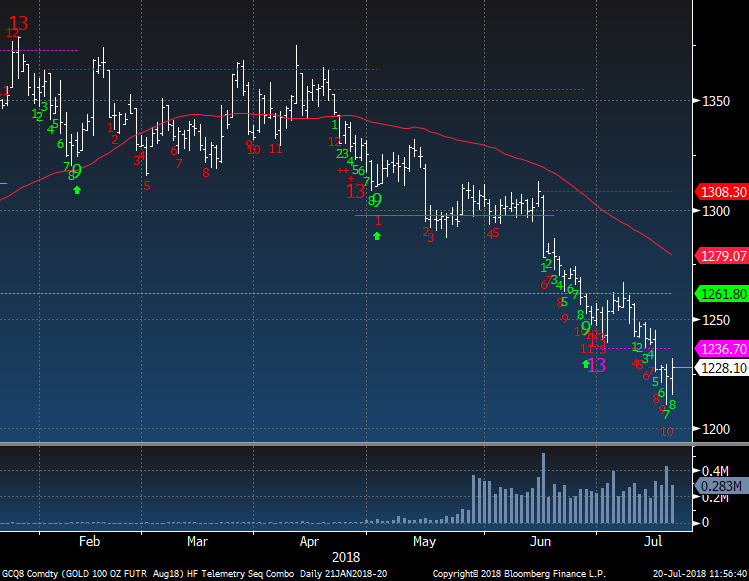
Gold bullish sentiment is at 7% and still is hated
|
|
|
|
|
Gold Futures remains on day 10 of 13 with the red Sequential and day 8 of 9 with the green Setup
|
|
|
|
|
|
|
|
|
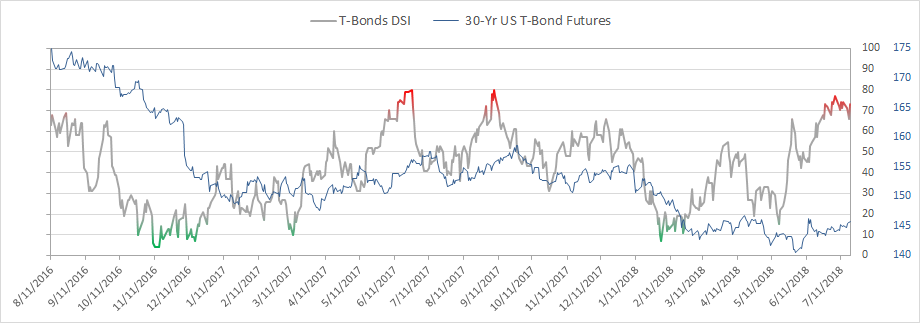
Bond bullish sentiment is at 73% and bounced from the previous day of 66%
|
|
|
|
|
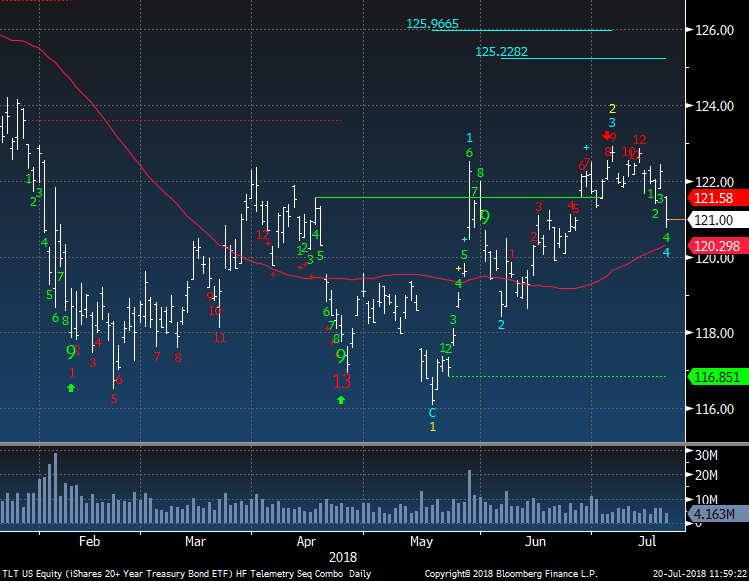
TLT Bond ETF is down today as yields are a little higher. This did however qualify this pullback as now in wave 4 of 5 and a new wave 5 upside price objective of 125.22 was produced.
|
|
|
|
|
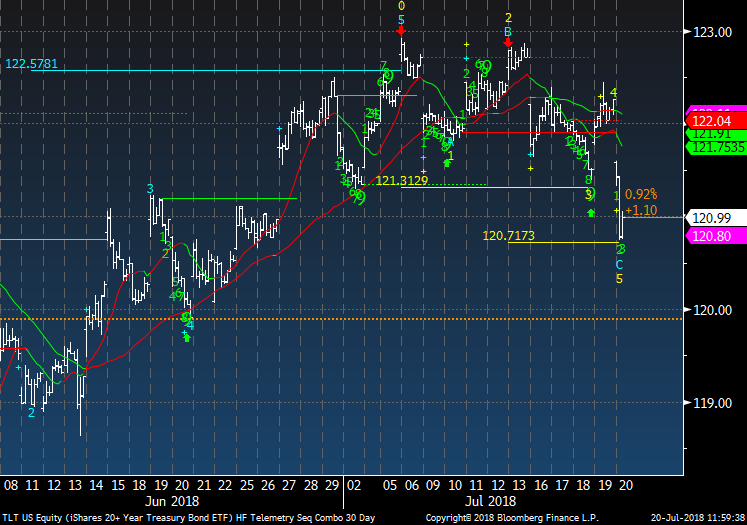
TLT on a 60 min time frame shows 5 wave down with both the wave 3 and wave 5 price objectives tightly met. A bounce from here seems likely
|
|
|
|
|
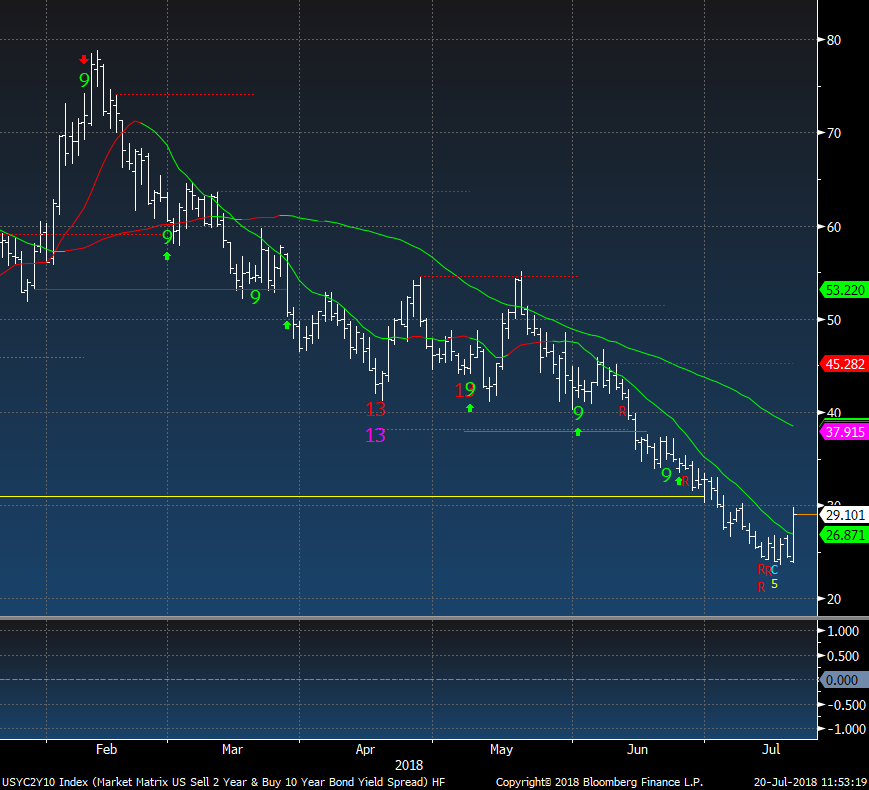
US 2/10 yield curve steepening today
|
|
|
|
|
|
|
DEMARK SCREENS - Daily, Weekly, Monthly Upside/Downside Exhaustion Signals
|
|
|
Daily/Weekly DeMark upside/downside exhaustion signals (Sequential) weekly updated on Monday's and monthly on the first day of the new month. Price flips occur when a stock closes higher/lower than four previous closes and increases conviction of a price turn.
The upside 13's are sell signals and downside 13's are buy signals. Price flip's are confirmation signals that increases potential for a price trend change. For example, if you are long a stock and there is an upside 13, you will want to take cautious action by selling down or out of a position. If initiating a short sale with the upside 13's, we tend to start with a 1/2 size and add with the downside price flip. The opposite is true for when there are downside 13's. Take a 1/2 size position
and add with the upside price flip. The DeMark Indicators are designed to assist the user with buying into weakness and selling into strength to anticipate trend exhaustion. Selling into a rally and buying into a decline often afford the opportunity to exit a trade without too serious a loss if wrong.
S&P 1500 Universe:
DAILY UPSIDE 13: ADT, AKS, APEI, BJRI, CAKE, EPR, FSS, GLT, KEY, SPG, TRIP, X
DAILY DOWNSIDE 13: SLCA, T, TGI
DAILY UPSIDE WITH PRICE FLIP REVERSAL DOWN: ADBE, AMZN, APEI, CTXS, ENTR, FLR, LLY, LYV, MA, MSFT, NTAP, PRFT, VRTX
DAILY DOWNSIDE WITH PRICE FLIP REVERSAL UP: LB
Updated: 7/16/18
WEEKLY UPSIDE 13: AMED, COHU, CRK, CRS, CTSH, CVGW, FAST, MTRN, SON
WEEKLY DOWNSIDE 13:
Updated: 7/1/18
MONTHLY
UPSIDE 13: ADI, AEE, BAX, BCOR, ETFC, ICUI, ITG, MED, MOH, NEE, SMTC, THG, TTEK, TXN, VICR, VSH, WCN, WST
MONTHLY DOWNSIDE 13: TUES
Euro Stoxx 600 Universe:
DAILY UPSIDE 13: EKTAB SS, EOAN GR, IMI LN, MONY LN, PSON LN, WDH DC, WDI GR
DAILY DOWNSIDE 13: BNP FP, JM SS
DAILY UPSIDE WITH PRICE FLIP REVERSAL DOWN: AHT LN, DCC LN, HAS LN, OPAP GA, REN NA, SPD LN, TEMN SW
DAILY DOWNSIDE WITH PRICE FLIP REVERSAL UP: SAN SM
Updated: 7/16/18
WEEKLY UPSIDE 13: BVI FP, DB1 GR, ICAD FP, MC FP
WEEKLY DOWNSIDE 13: AV/ LN
Updated: 7/1/18
MONTHLY UPSIDE 13: BLND LN, CDI FP, CRH ID, DCC LN, DOM LN, RACE IM, REL LN, RMS FP, SXS LN, WKL NA, ZAL GR
MONTHLY DOWNSIDE 13: BMPS IM
|
|
|
Unsubscribe me from Hedge Fund Telemetry
Hedge Fund Telemetry LLC, P.O. Box 4675, Greenwich, CT 06861, United States
CONFIDENTIALITY NOTE and DISCLAIMER: This message is for the named person's use only. It may contain confidential, proprietary or legally privileged material. No confidentiality or privilege is waived by any accidental or unintentional transmission. If you receive this message in error, please immediately delete it and all copies of it from your system, destroy any hard copies and notify the sender. You must not, directly or indirectly, use, disclose,
distribute, print or copy any part of this message if you are not the intended recipient. Hedge Fund Telemetry LLC. cannot guarantee the confidentiality of the material transmitted; therefore, information of a sensitive or confidential nature should not be transmitted. There is risk in trading markets. Hedge Fund Telemetry LLC reports are based on information gathered from various sources and believed to be reliable, but are not guaranteed as to accuracy and completeness. The information is subject to change without notice and Hedge Fund Telemetry LLC has no obligation to provide any updates or changes. Hedge Fund Telemetry LLC is providing this data for informational and educational purposes and does not believe that it is sufficient to base an investment decision on. This information should not be regarded as a solicitation or recommendation of any particular security or to engage in any trading strategy. One should always check with your licensed financial
advisor to determine suitability of any investments.
|
|
|
|
|