|
|
|
|
|
|
Ain't no mountain high enough
|
|
|
Ain't no mountain high enough was playing last night on my Pandora station with Marvin Gaye and Tammi Terrell. Great song and it reminded me of how the longer term charts look on Amazon. I have some charts below including some ratio charts vs the S&P - all of them have upside exhaustion signals on multiple time frames.
It's also a big day at the Tour de France with a notorious climb up Alpe Duez. I'm a big cycling fan (as many of you know) and the stage was unreal. I'll
cut comments short as no changes to my thoughts to raise cash and to be defensive.
Notable:
- US Markets - Sentiment nearly extreme. Indexes stalling or going sideways
- Hedge Fund Telemetry Trade Ideas - No changes
- Attribution Does It Matter?
- Currency Update - USD and GBP upside exhaustion 13, CNY is a real concern as people are too complacent
- Gold
Update
- Copper and Bloomberg Commodity Charts
- Asian Markets - Hong Kong near downside exhaustion, expect Japan to reverse down
- Amazon - Ain't no mountain high enough
- Bond Update
- DeMark Screens - Daily, Weekly, Monthly upside/downside exhaustion signals within the S&P 1500 and Euro Stoxx 600
|
|
|
|
|
Here's a link to the Hedge Fund Telemetry market sentiment page with 40 charts of sentiment including equities, bonds, currencies, and commodities updated each day.
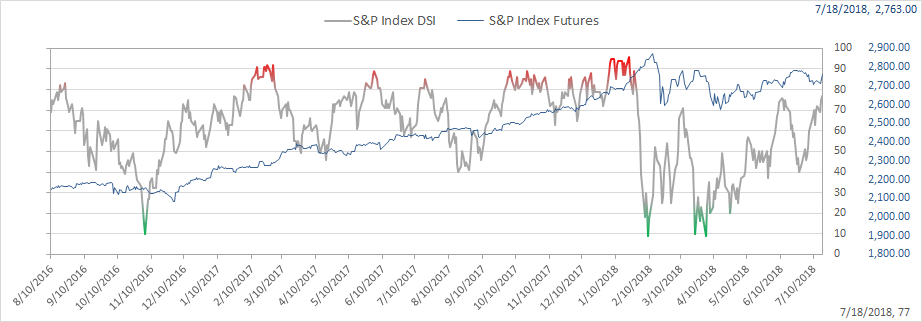
SPX bullish sentiment is at 77% and nearly at the 80% extreme zone
|
|
|
|
|
SPX holding the 2800 level (for now) and more rotation out of financials today and into utilities and consumer discretionary.
|
|
|
|
|
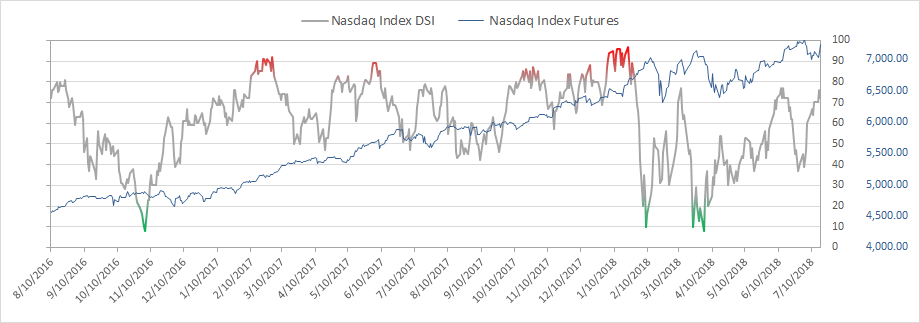
Nasdaq bullish sentiment is at 72%
|
|
|
|
|
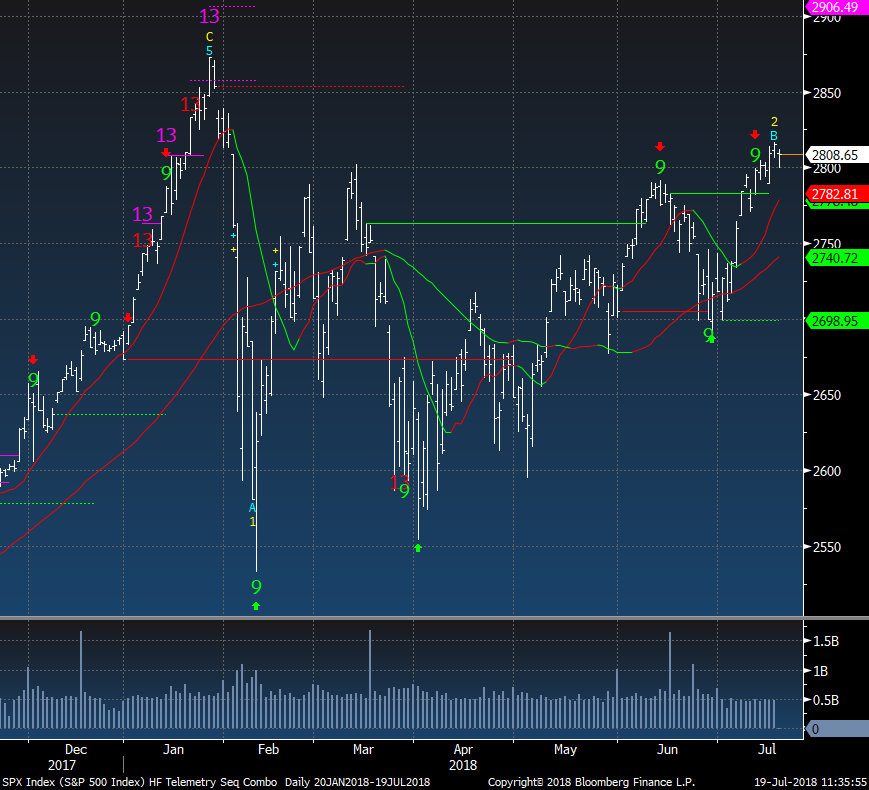
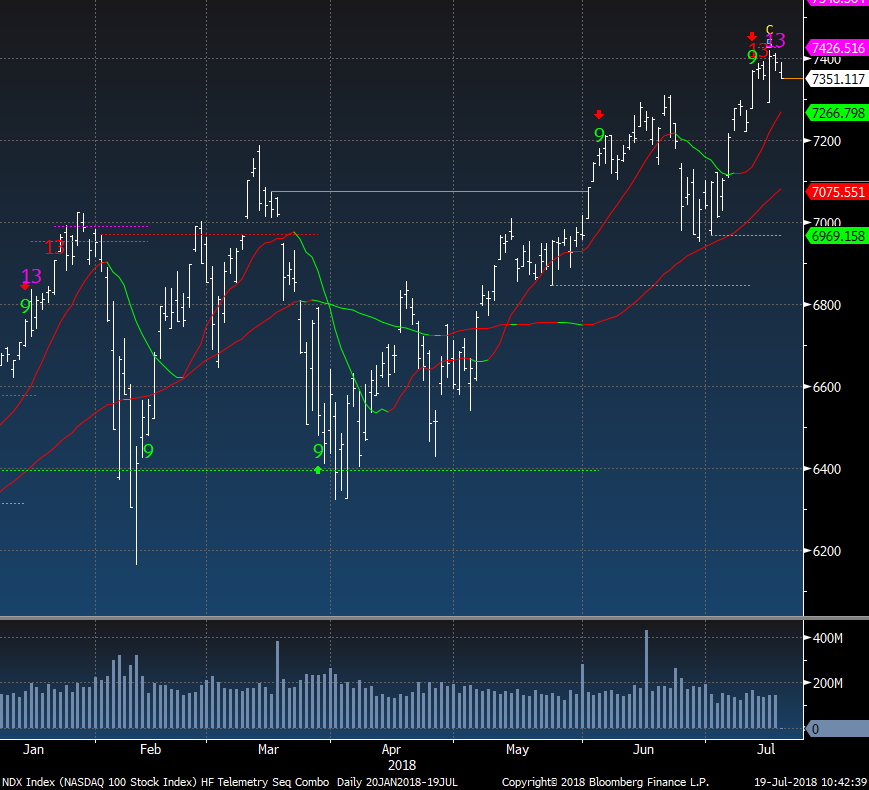
NDX now has both an upside red Sequential and pink Combo 13 exhaustion signal last seen in January ahead of the drop
|
|
|
|
|
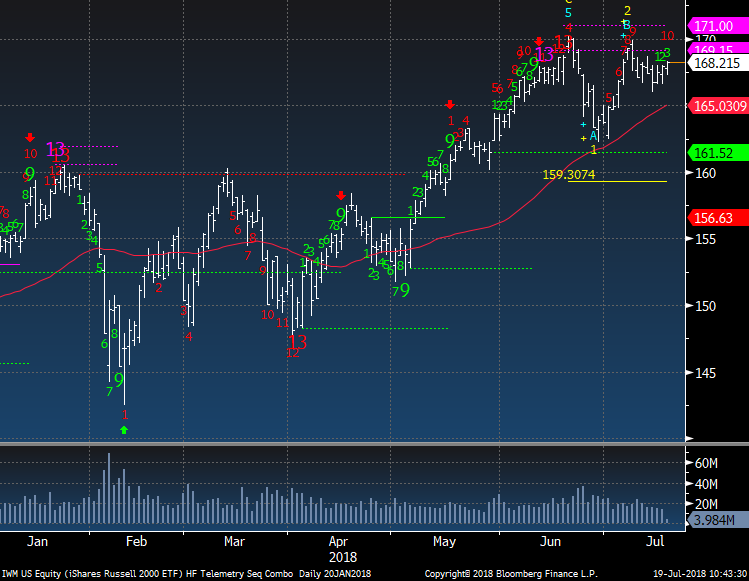
Russell 2000 has bounced off the recent low holding the TDST 161.52 (as it should for now) and the secondary Countdown is on day 10 of 13
|
|
|
|
|
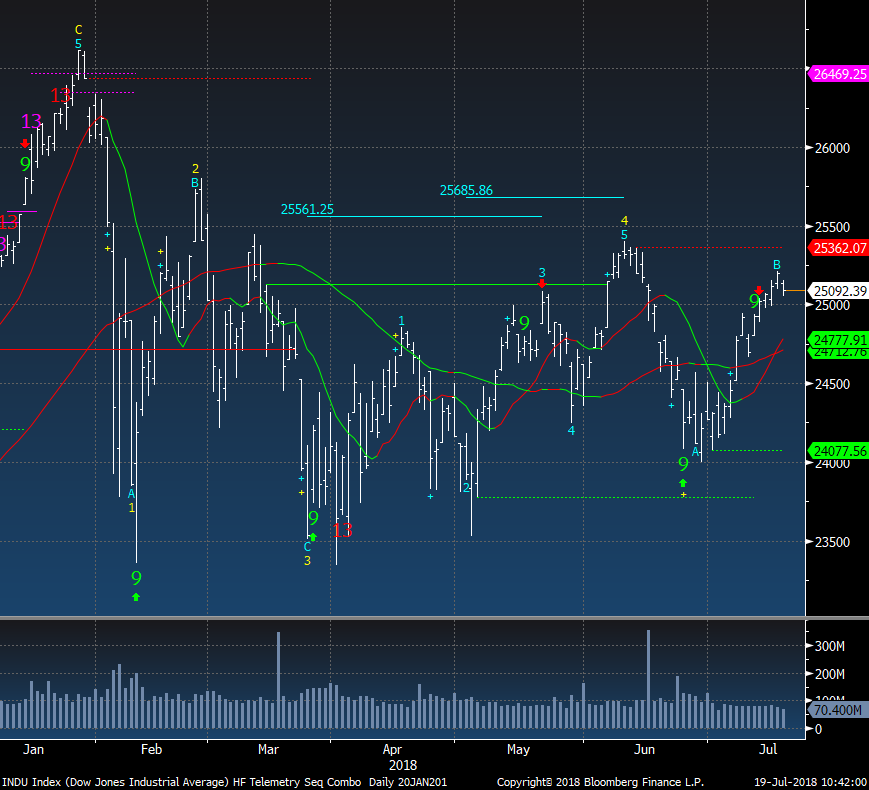
Dow Jones remains under the June highs and well off the January highs.
|
|
|
|
|
|
|
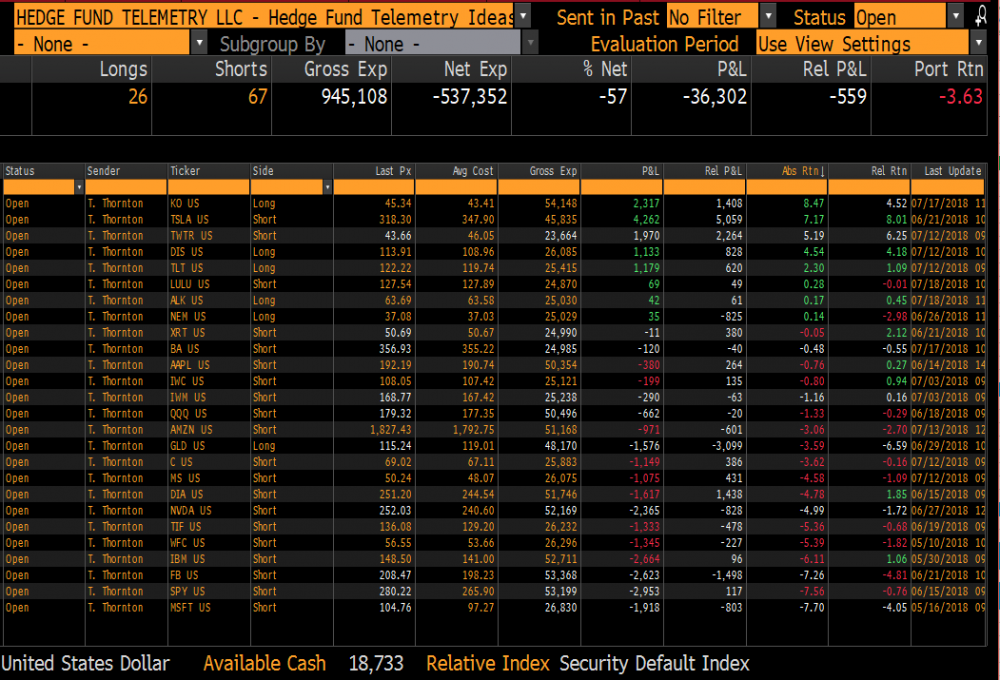
Hedge Fund Telemetry Trade Ideas
|
|
|
Trade Ideas - no changes. IBM reported a little better report despite missing 4/5 segments and margins didn't uptick, no changes to the thesis. MSFT tonight and I would not doubt myself getting stopped out (-10% on 2.5% size = 25bps loss)
|
|
|
|
|
|
|
Attribution does it matter?
|
|
|
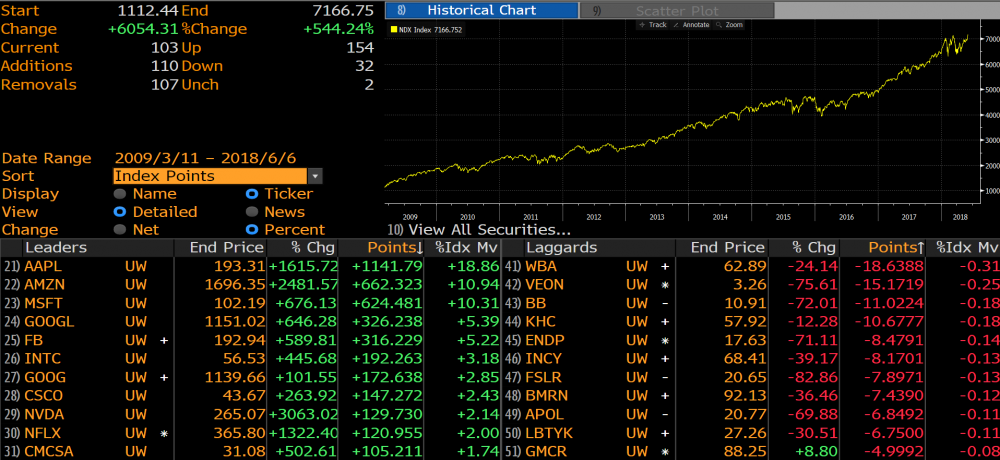
This is the NDX attribution I showed last month from the low in 2009. The top 5 stocks have attributed 50% of the total gain. This is a fact. A lot of people continue to believe the narrow attribution does not matter. One of the arguments is that a lot of stocks have done well which is true but this data is impossible to argue with when it comes to attribution.
|
|
|
|
|
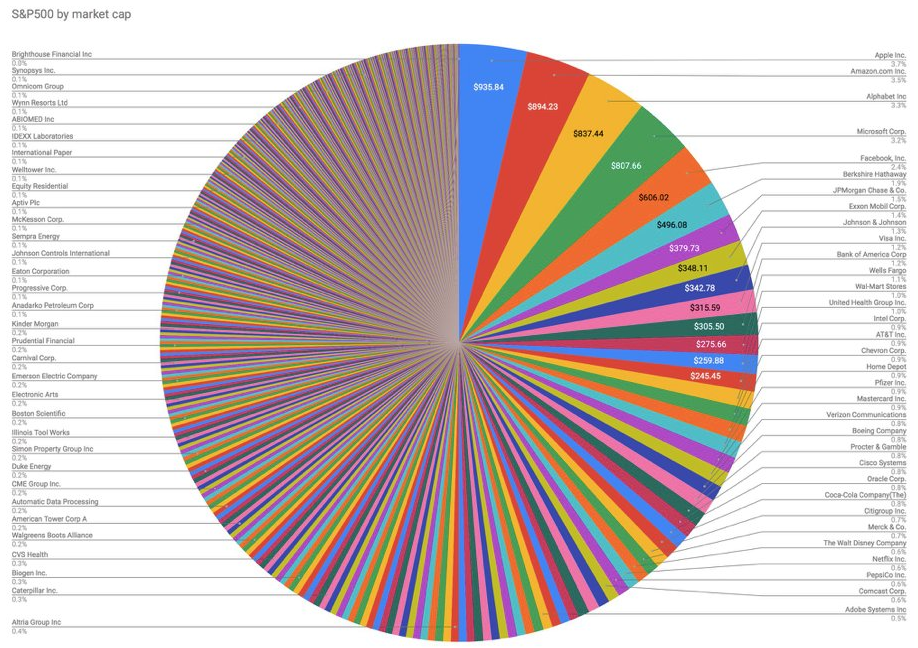
Here is a chart I found on Twitter of a pie chart of the entire S&P by market cap. The top 5 stocks are not hard to notice.
|
|
|
|
|
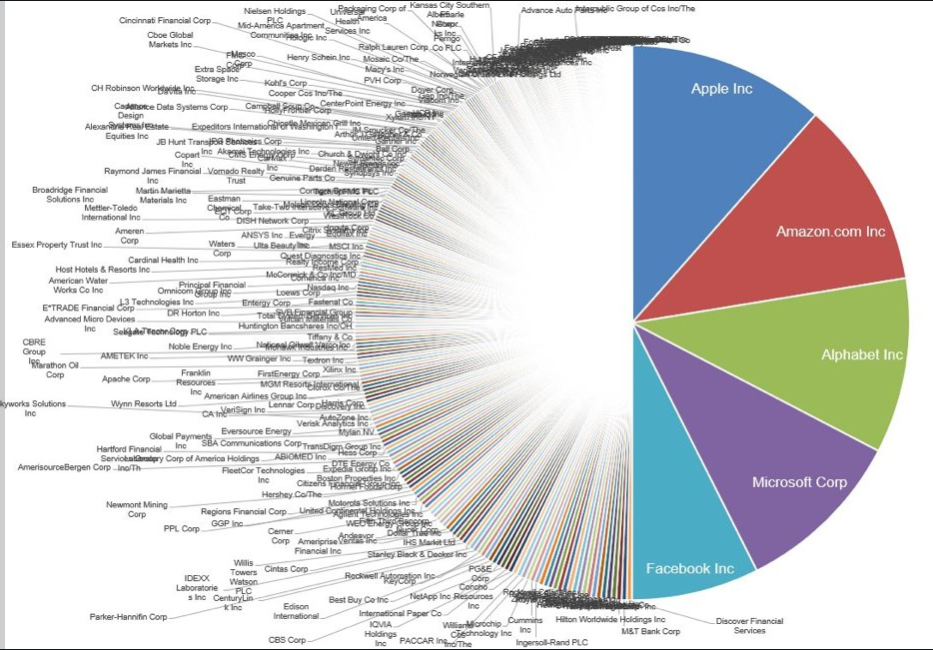
This is another one that was going around from Michael Batnick showing the top 5 and the bottom 282 stocks in the S&P. My big concern is that the gains seen in the last 10 years and in the recent year will not be able to continue forever.
|
|
|
|
|
|
|
|
|
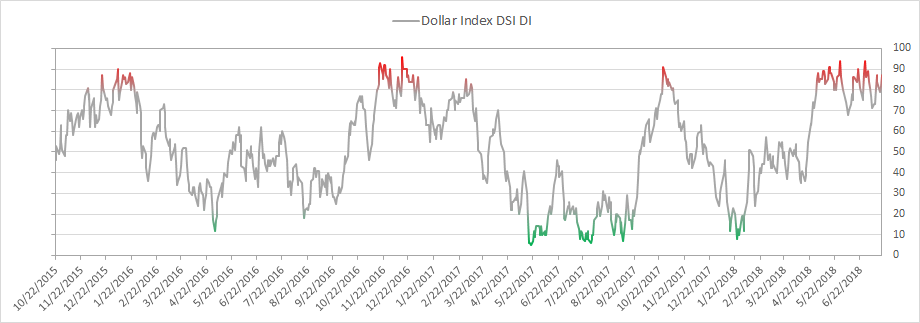
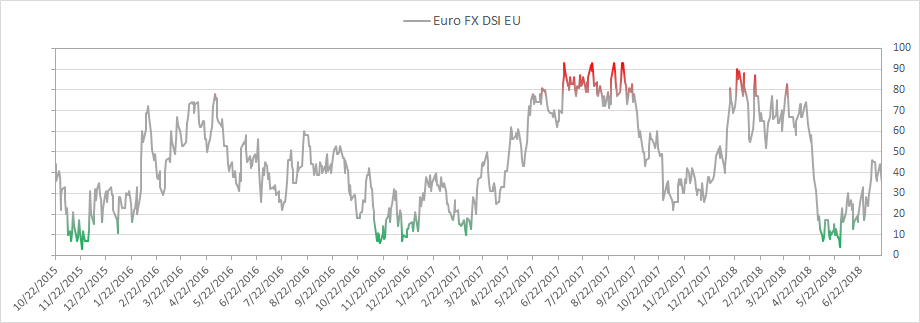
US Dollar bullish sentiment is at 87% and remains extreme. This is a risk for a USD pullback
|
|
|
|
|
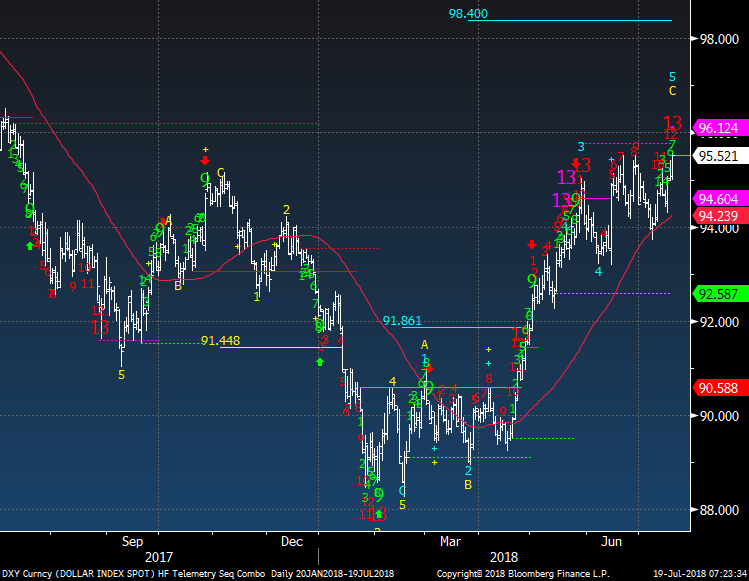
US Dollar Index did get the upside Countdown 13 today. If this continues for two more days up and the green Setup completes the 9 consecutive closes higher than 4 previous closes, there could be a better shot for a pullback but then potential after for another upside red Countdown to start. I know, it's a lot of if's but I'll keep you up on all this
|
|
|
|
|
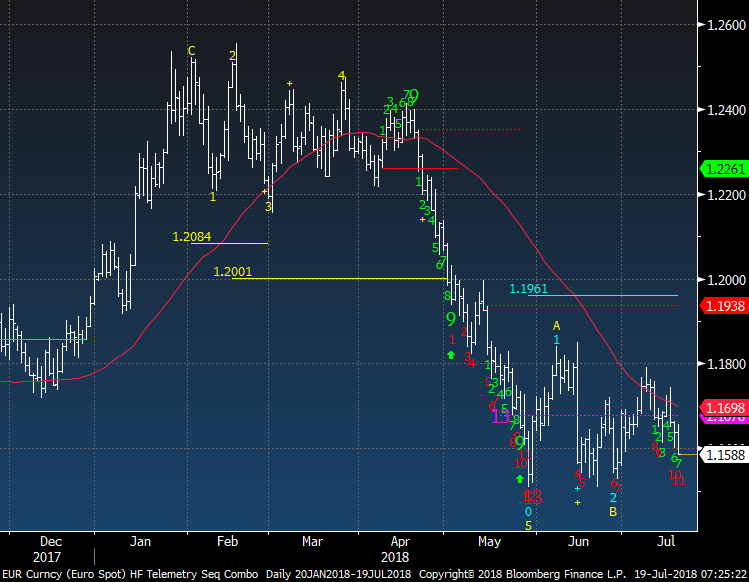
Euro bullish sentiment is at 35%
|
|
|
|
|
Euro Spot is on day 11 of 13 so potential for a few more down days (and perhaps a green Setup too)
|
|
|
|
|
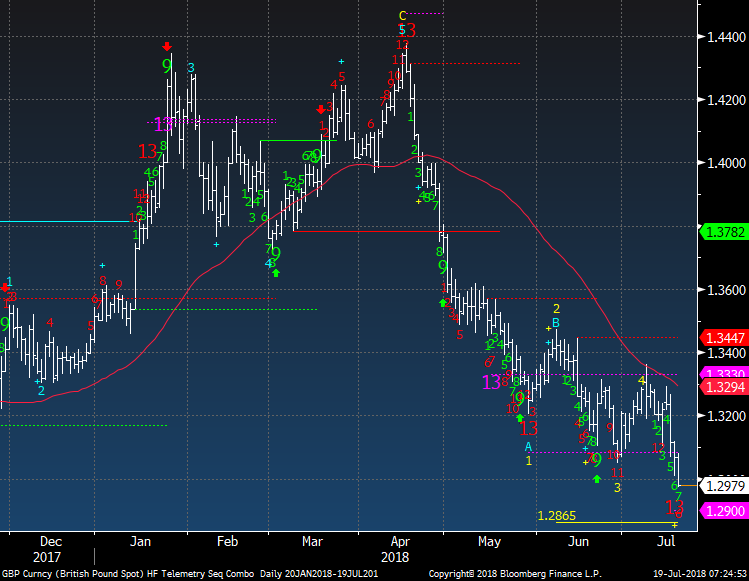
British Pound did get a downside red 13 today too. This is coming with threat of hard Brexit and PM May losing all support.
|
|
|
|
|
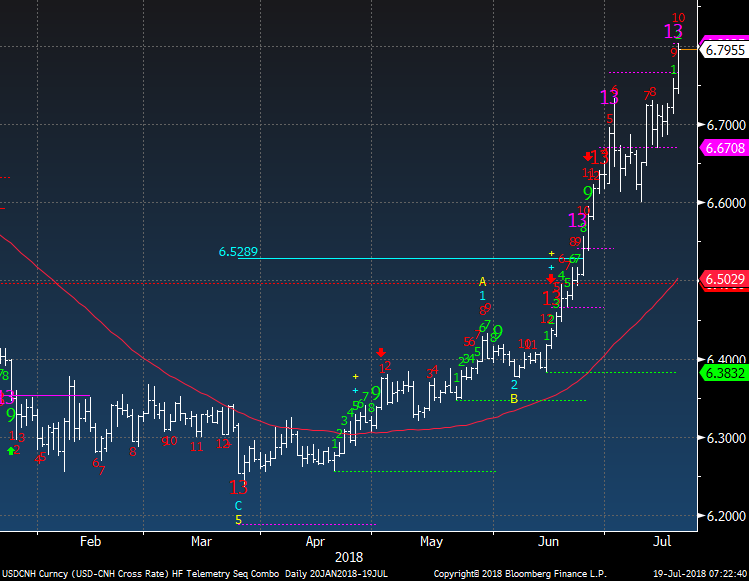
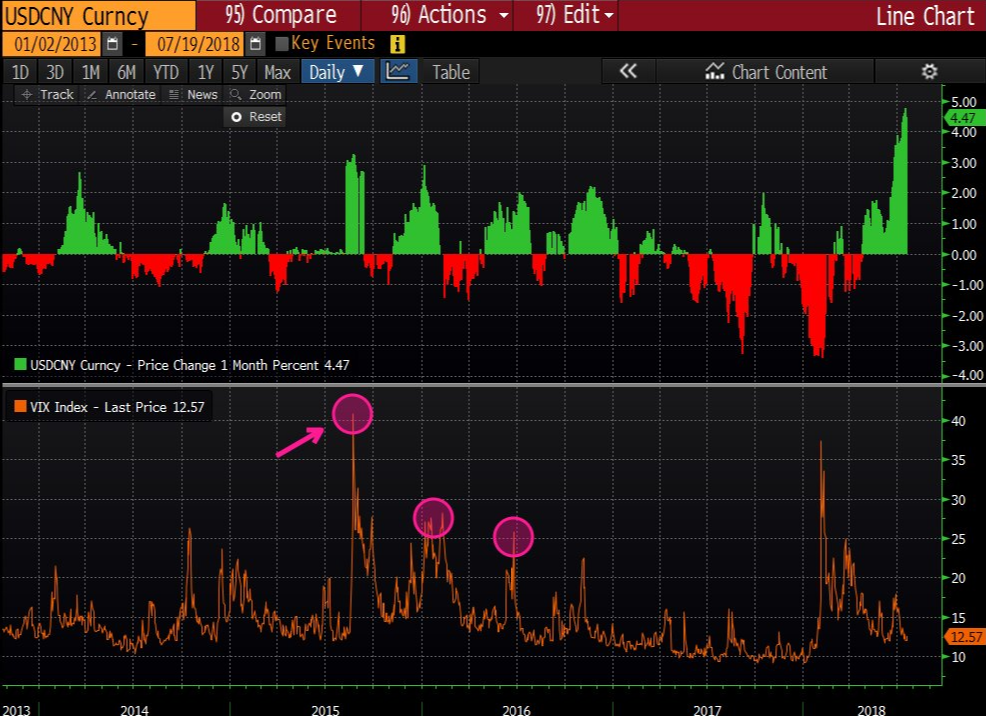
China's Yuan continues to weaken and the red Countdown is now on day 10 of 13. When these signals are ignored it's important since it is telling you how strong a trend this really is.
|
|
|
|
|
This is a good chart of the USDCNY when China devalued back in late Summer 2015 and the VIX. The SPX dropped from 2100 to 1867 within 10 days. Thanks to @iv_technicals for the chart
|
|
|
|
|
|
|
|
|
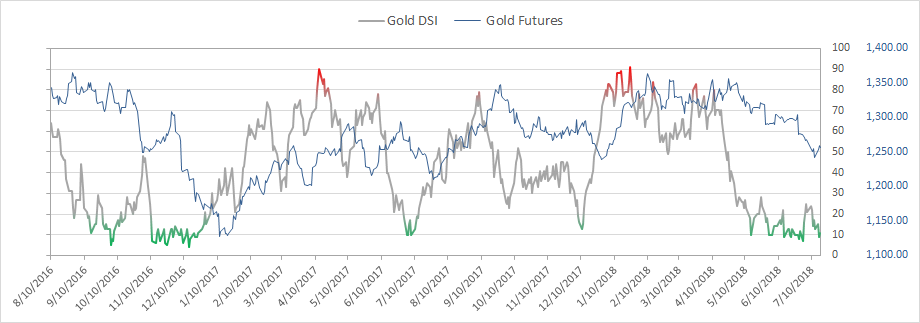
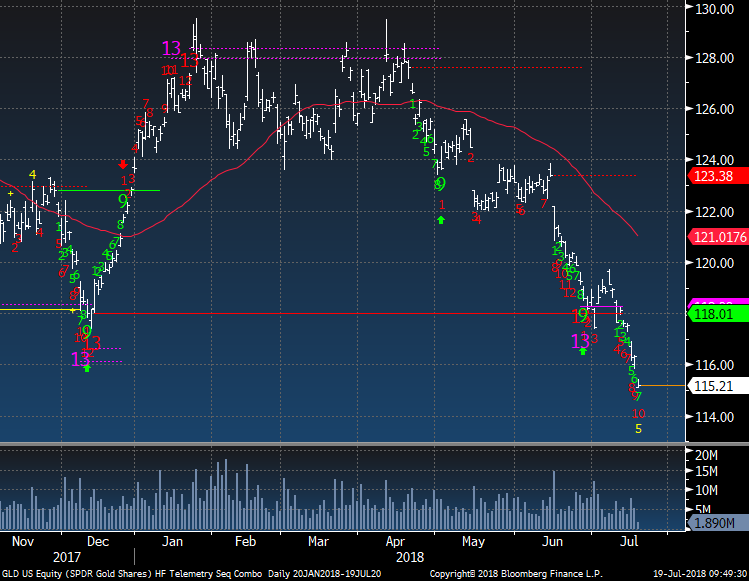
Gold bullish sentiment is at 11% and remains oversold
|
|
|
|
|
GLD is now on day 10 of 13 with a secondary red Countdown. I'm going to ride down to the 13 with my long position waiting for the seasonal move. I've considering cutting by half and adding back on the turn but I'll hold for now since the US Dollar could see a turn soon too
|
|
|
|
|
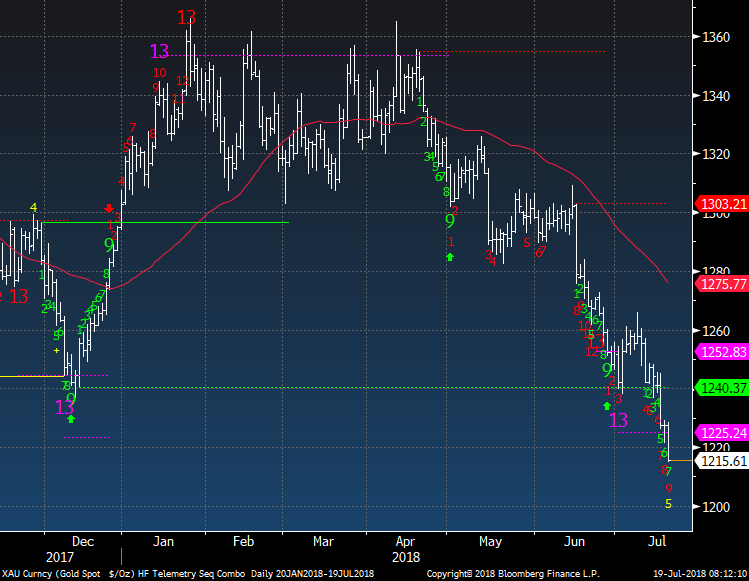
XAU Gold Spot same story.
|
|
|
|
|
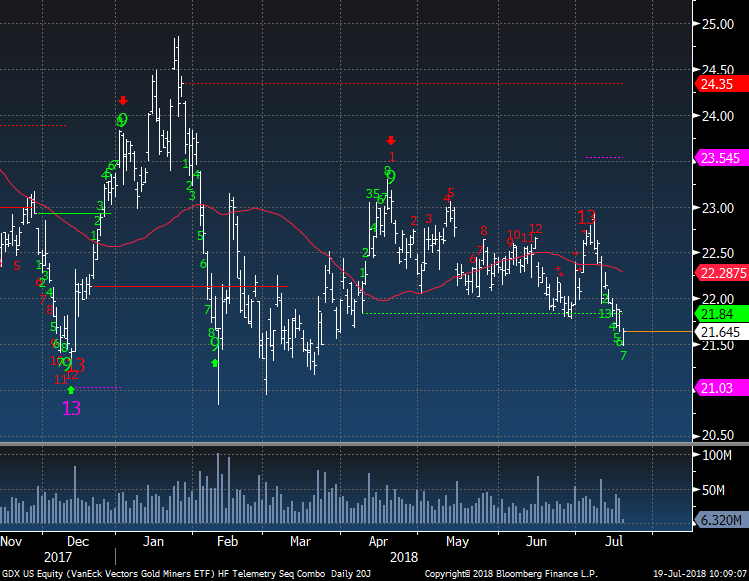
GDX remains in a range and for sure has not looked like Gold prices
|
|
|
|
|
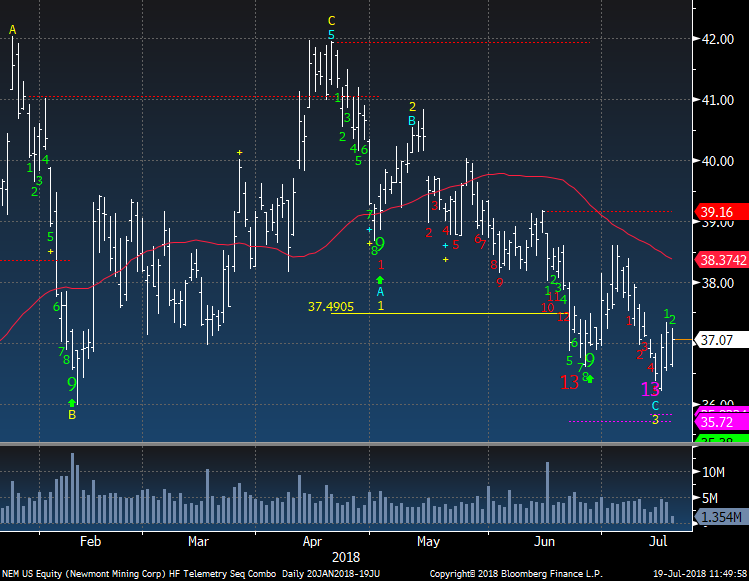
Newmont remains a small long and I'll hold with the downside exhaustion signals in play
|
|
|
|
|
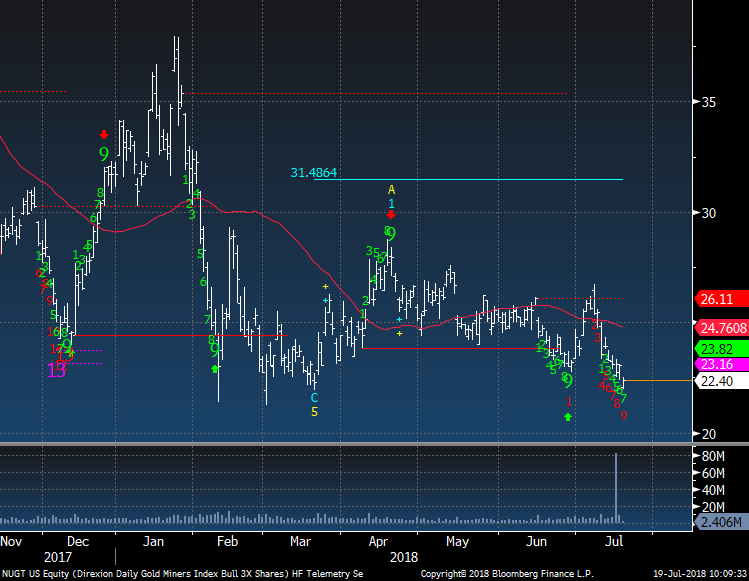
NUGT 3x levered ETF is not one I trade but there was a huge trade the other day and I don't have the details (note volume). This is on day 9 of 13 with a downside Countdown. The last downside Countdown nearly went up 100% after... That was during the December long trade we were involved in
|
|
|
|
|
|
|
|
|
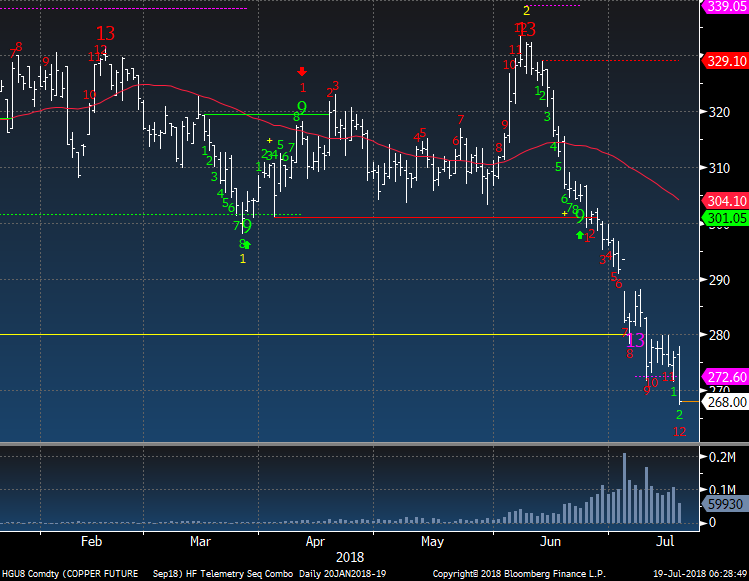
Copper is on day 12 of 13 with a downside Countdown. Yesterday had the 12 but it bounced. Another down day and the 13 will trigger.
|
|
|
|
|
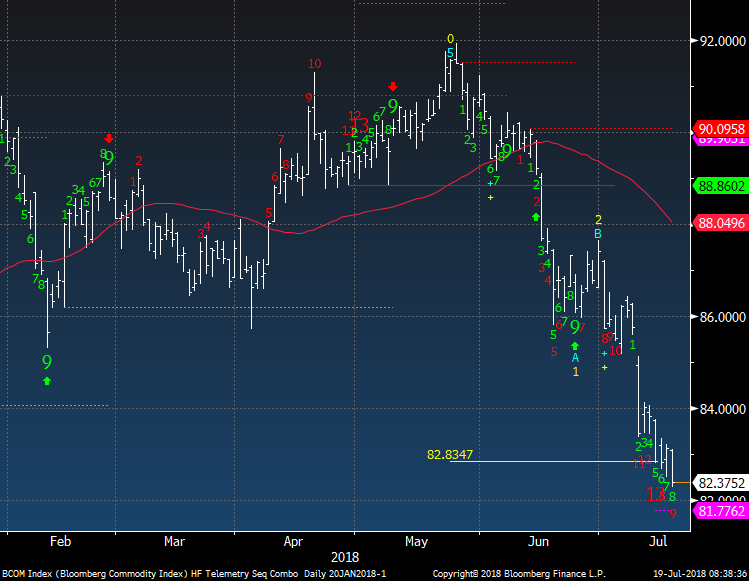
Bloomberg Commodity Index is on day 9 of 13 with a secondary red Countdown and a green Setup 8/9. A turn is ahead but I expect it to not bounce for long as it will be in a wave 4 and then followed by a lower low wave 5.
|
|
|
|
|
|
|
|
|
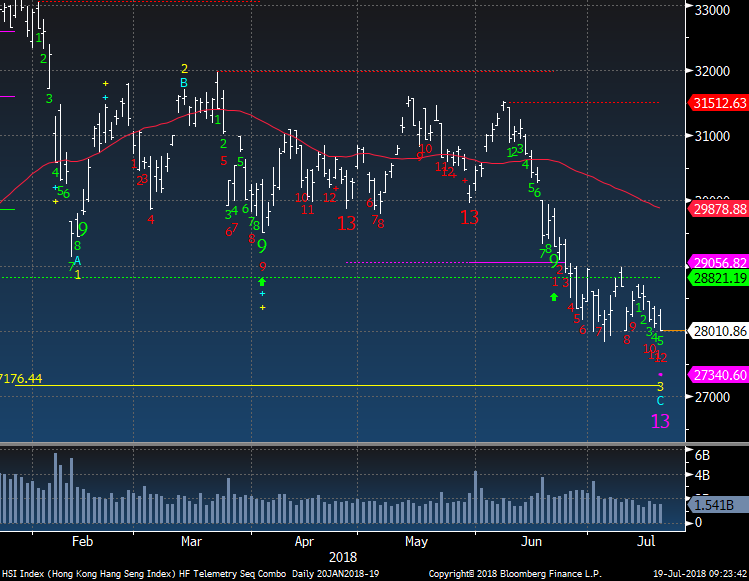
Hong Kong is on day 12 of 13 with a red Sequential downside Countdown and did get the pink Combo 13 today
|
|
|
|
|
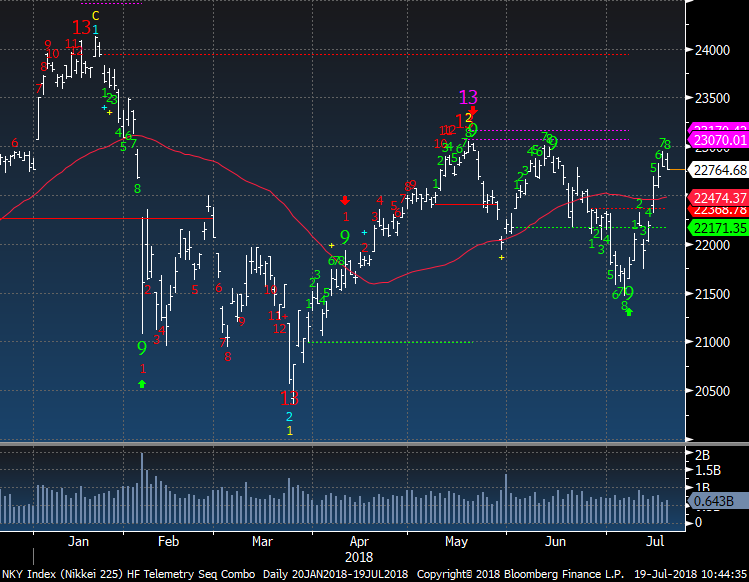
Nikkei is on day 8 of 9 with a green Setup. Notice the last two days it closed on the low of the day
|
|
|
|
|
|
|
Amazon - Ain't no mountain high enough
|
|
|
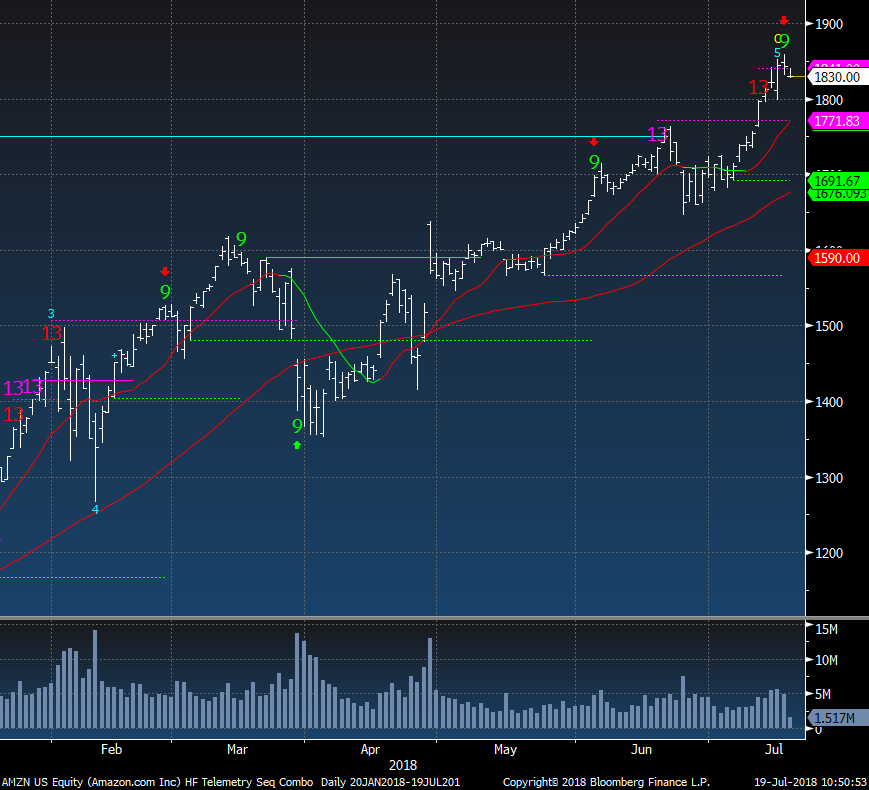
Amazon daily with a green Setup 9 after a recent upside red Countdown 13. This should see some reversal down
|
|
|
|
|
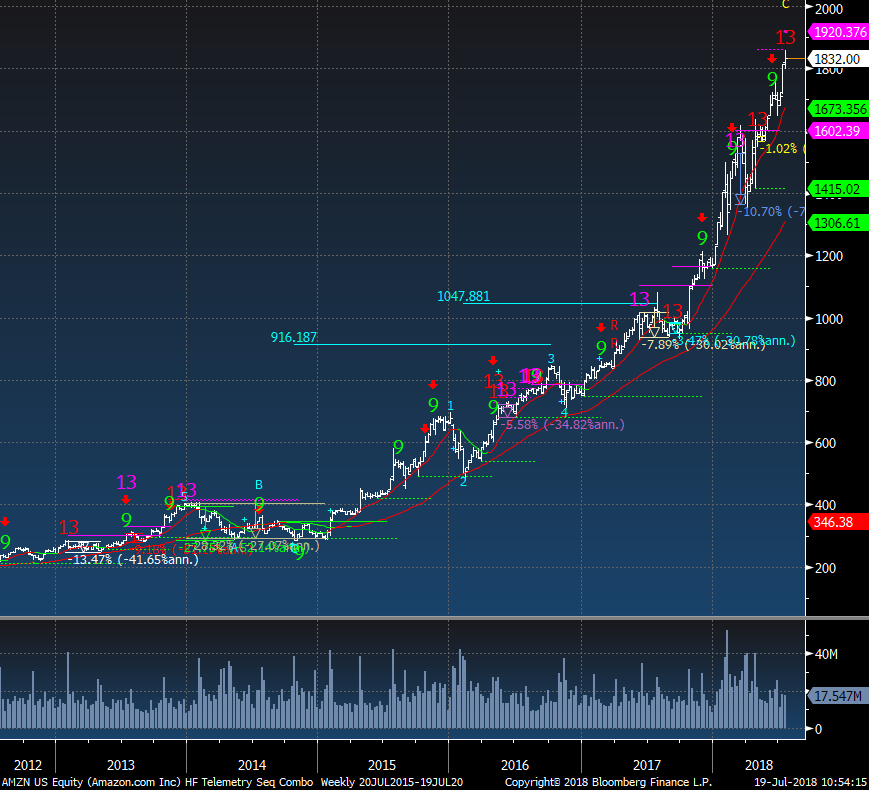
Amazon weekly has a red Countdown 13 today and the record of 13's have been ok for a a pullback of between 1% - 30%. The coming pullback will be more than 15%
|
|
|
|
|
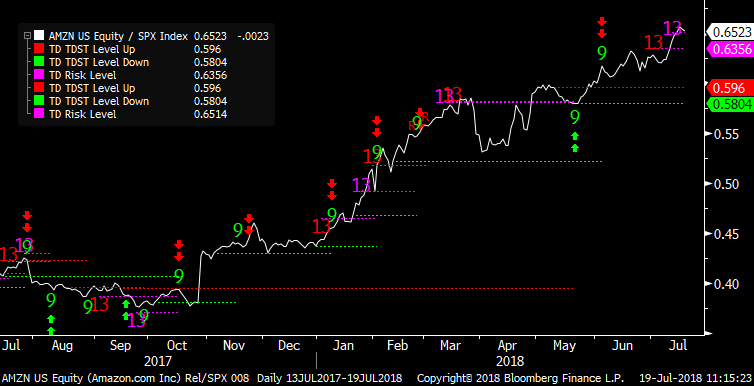
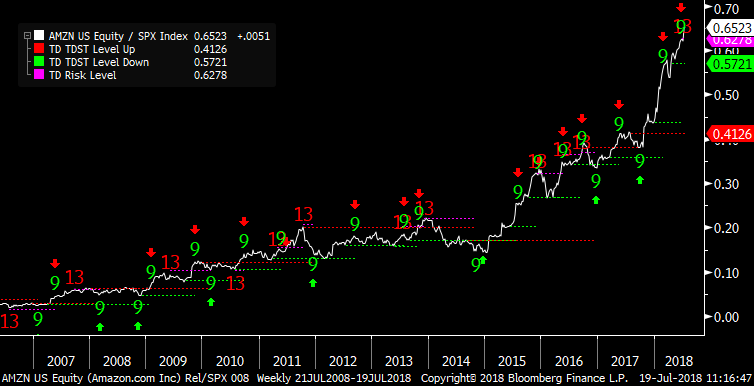
Amazon vs SPX does have some exhaustion signals recently and a slight hook lower too
|
|
|
|
|
Weekly with an upside Countdown 13 and relative to the SPX has a good record. This steep move in 2018 will get a decent pullback
|
|
|
|
|
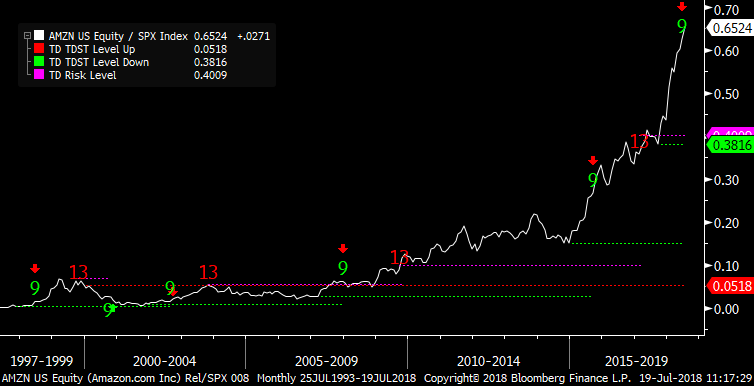
Monthly since 2015 has a 9-13-9 DeMark upside pattern that should see a reversal down
|
|
|
|
|
|
|
|
|
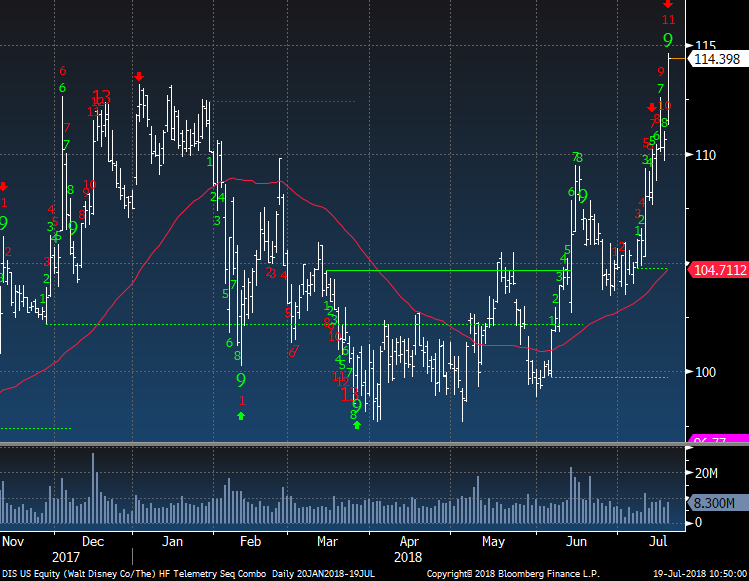
Disney won the Fox assets as I expected and the stock is responding in a positive way.
|
|
|
|
|
|
|
|
|
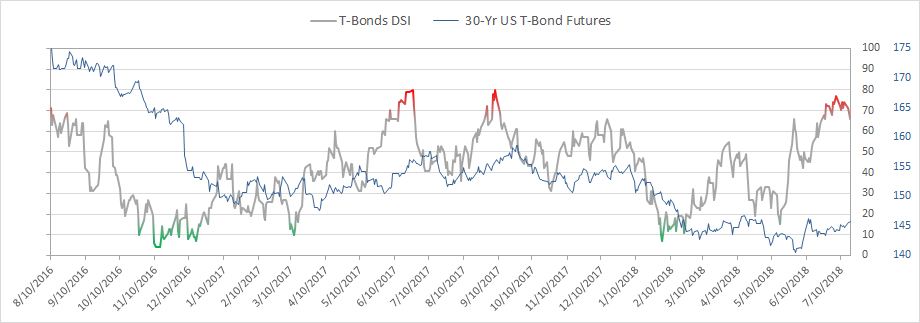
Bond bullish sentiment is at 66% and rolling over a bit
|
|
|
|
|
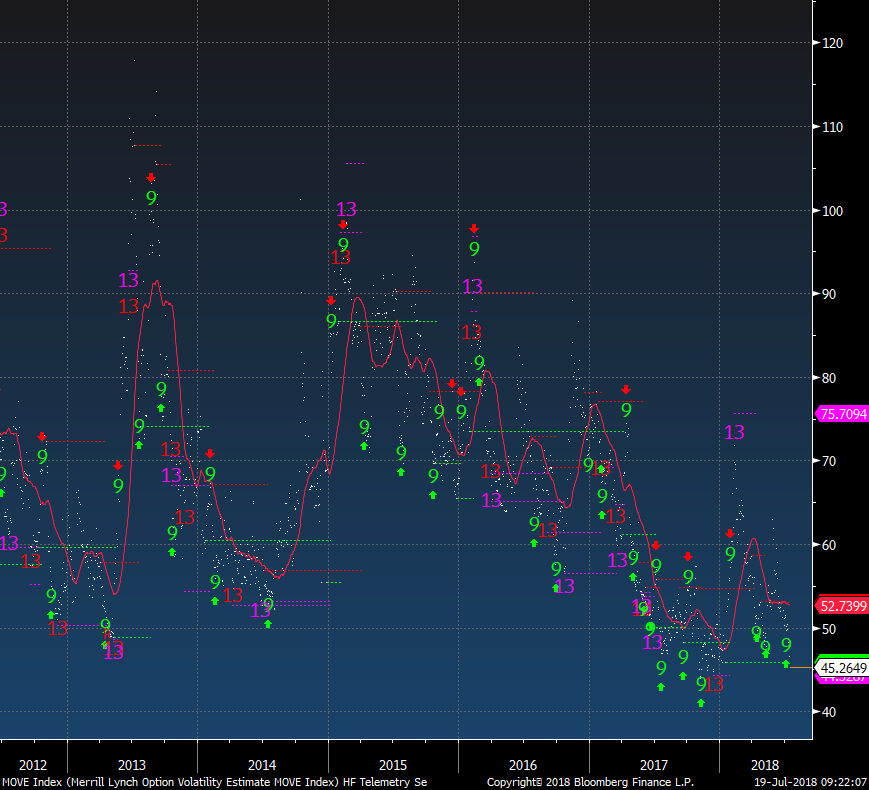
The MOVE Index (sort of a volatility index for bonds) is very low and is a sign of complacency. A volatile breakout move is ahead. Doesn't matter what direction.
|
|
|
|
|
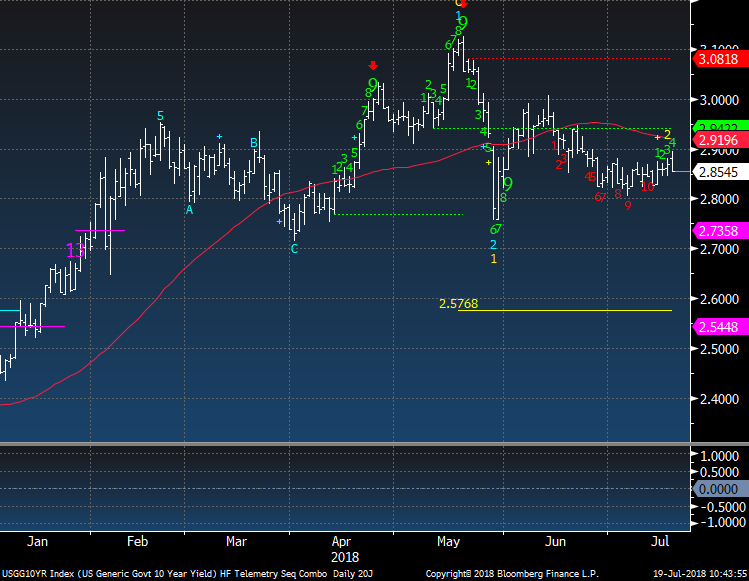
US 10 year yield remains in a tight range
|
|
|
|
|
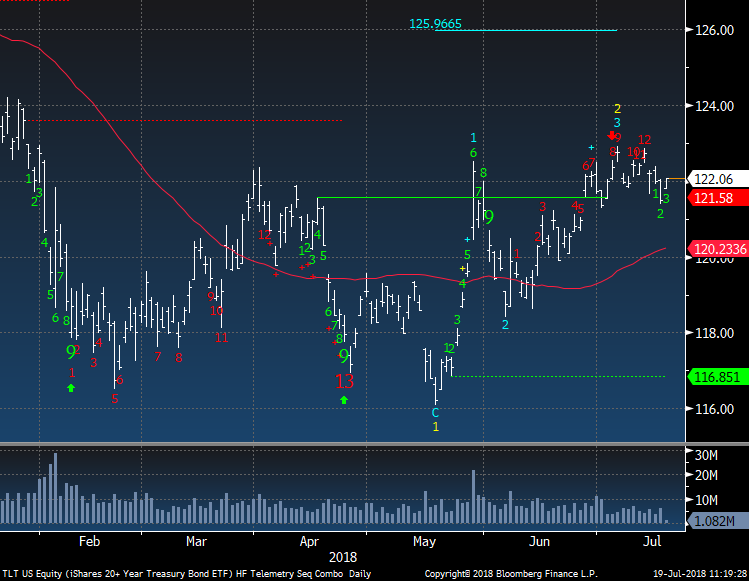
TLT Bond ETF up today but needs more upside to get the upside Countdown 13
|
|
|
|
|
|
|
DEMARK SCREENS - Daily, Weekly, Monthly Upside/Downside Exhaustion Signals
|
|
|
Daily/Weekly DeMark upside/downside exhaustion signals (Sequential) weekly updated on Monday's and monthly on the first day of the new month. Price flips occur when a stock closes higher/lower than four previous closes and increases conviction of a price turn.
The upside 13's are sell signals and downside 13's are buy signals. Price flip's are confirmation signals that increases potential for a price trend change. For example, if you are long a stock and there is an upside 13, you will want to take cautious action by selling down or out of a position. If initiating a short sale with the upside 13's, we tend to start with a 1/2 size and add with the downside price flip. The opposite is true for when there are downside 13's. Take a 1/2 size position
and add with the upside price flip. The DeMark Indicators are designed to assist the user with buying into weakness and selling into strength to anticipate trend exhaustion. Selling into a rally and buying into a decline often afford the opportunity to exit a trade without too serious a loss if wrong.
S&P 1500 Universe:
DAILY UPSIDE 13: ACXM, CDNS, CLF, DIOD, EXPE, FPB, MASI, OSIS
DAILY DOWNSIDE 13: NONE
DAILY UPSIDE WITH PRICE FLIP REVERSAL DOWN: ACIW, ADSK, AMED, BR, CACI, CDNS, CHD, CRM, CTSH, DDD, EGL, EXLS, FTNT, GILD, HMSY, JKHY, MDLZ, MOH, PTC, STE, TDC, UTHR, WDFC
DAILY DOWNSIDE WITH PRICE FLIP REVERSAL UP: AVP, LM, MTB, SPN
Updated: 7/16/18
WEEKLY UPSIDE 13: AMED, COHU, CRK, CRS, CTSH, CVGW, FAST, MTRN, SON
WEEKLY DOWNSIDE 13: GPRE
Updated: 7/1/18
MONTHLY UPSIDE 13: ADI, AEE, BAX, BCOR, ETFC, ICUI, ITG, MED, MOH, NEE, SMTC, THG, TTEK, TXN, VICR, VSH, WCN, WST
MONTHLY DOWNSIDE 13: TUES
Euro Stoxx 600 Universe:
DAILY UPSIDE 13: ASML NA, BRBY LN, MTX GR, NXT LN
DAILY DOWNSIDE 13: BARN SW, BMPS IM, EBS AV, OMV AV, SAN SM
DAILY UPSIDE WITH PRICE FLIP REVERSAL DOWN: BEI GR, INF LN, OR FP, SWMA SS, ULE LN
DAILY DOWNSIDE WITH PRICE FLIP REVERSAL UP: EBS AV, VOE AV
Updated: 7/16/18
WEEKLY UPSIDE 13: BVI FP, DB1 GR, ICAD FP, MC FP
WEEKLY DOWNSIDE 13: AV/ LN
Updated: 7/1/18
MONTHLY UPSIDE 13: BLND LN, CDI FP, CRH ID, DCC LN, DOM LN, RACE IM, REL LN, RMS FP, SXS LN, WKL NA, ZAL GR
MONTHLY DOWNSIDE 13: BMPS IM
|
|
|
Unsubscribe me from Hedge Fund Telemetry
Hedge Fund Telemetry LLC, P.O. Box 4675, Greenwich, CT 06861, United States
CONFIDENTIALITY NOTE and DISCLAIMER: This message is for the named person's use only. It may contain confidential, proprietary or legally privileged material. No confidentiality or privilege is waived by any accidental or unintentional transmission. If you receive this message in error, please immediately delete it and all copies of it from your system, destroy any hard copies and notify the sender. You must not, directly or indirectly, use, disclose,
distribute, print or copy any part of this message if you are not the intended recipient. Hedge Fund Telemetry LLC. cannot guarantee the confidentiality of the material transmitted; therefore, information of a sensitive or confidential nature should not be transmitted. There is risk in trading markets. Hedge Fund Telemetry LLC reports are based on information gathered from various sources and believed to be reliable, but are not guaranteed as to accuracy and completeness. The information is subject to change without notice and Hedge Fund Telemetry LLC has no obligation to provide any updates or changes. Hedge Fund Telemetry LLC is providing this data for informational and educational purposes and does not believe that it is sufficient to base an investment decision on. This information should not be regarded as a solicitation or recommendation of any particular security or to engage in any trading strategy. One should always check with your licensed financial
advisor to determine suitability of any investments.
|
|
|
|
|