If you are having difficulty seeing this email, you can view in your browser or click here to
print.
|
|
|
|
|
2/4/18
Thomas Thornton
info@hedgefundtelemetry.com
|
|
|
Surveying the wreckage from last week Part 2
|
|
|
If you're wondering if you missed Part 1, you didn't, since for some reason the four hours of writing this morning was lost when I tried to send today's note. I am working on retrieving it and I will send the text from Part 1 tomorrow. Annoying but I'm over it and couldn't be more grateful to have the opportunity to write about my research each day.
I spent the weekend in front of the screens going over 100's of charts to survey the wreckage from
last week. Last week did a lot of damage and moved many indicators and factors on daily charts to oversold conditions. The market bounced on Friday off the 200 day which was widely talked about so that level now becomes very important support. On Thursday and Friday I called for a lower high bounce to start soon and didn't feel like making a buy call ahead of a weekend call but I did reduce some exposure by selling the only index downside exposure on Friday based on the low sentiment and plethora of DeMark green Setup 9's. On 1/24 I wrote how I added the first downside index exposure in quite a while with the SPY, QQQ, IWM April puts ~2% OTM with 5% AUM. My thought at the time was using puts defined my risk vs shorting a wildly advancing market. I didn't expect a 10% market drop to occur so fast and get a trade of the year candidate.
One of the important things I discovered was the breakdown in momentum on the daily charts to oversold also
woke up the longer term time frame momentum indicators as they started to reverse too. Today and tomorrow I will go over where those typically get to when a more significant downside move gets fully washed out. Those indicators will go lower and it works well with my lower high bounce scenario. If buying this bounce, which I have no problem with, stay nimble with tight stops and watch weightings.
This Thursday at 10:30am EST we are doing a market webinar that should last for 45 minutes. We'll cover a lot of ground with the equity, bond, currency, and commodities markets. My goal is explain how some of the indicators and factors work within the context with today's markets. If you have
questions or want an opinion of the chart of anything, please email me ahead of Thursday. I will try to get to as many questions as possible. It will be recorded and we'll send the webinar details tomorrow and Wednesday.
Notable:
- US Markets - slight bounce in sentiment, lots of downside DeMark green Setup 9's suggest a bounce is underway. The S&P hit the 200 day but FANG only touched the 50 day.
- A few global indexes to watch closely
- Euro Stoxx 50 still looks messy
- A ton of US sector ETF's with most of them having green Setup 9's too - bounce time
- Some important bond market thoughts that could be signaling a future recession
- S&P Weekly Charts showing some indicators just waking up and that are not oversold
- DeMark Screens - Starting to see more downside red Countdown 13's
|
|
|
|
|
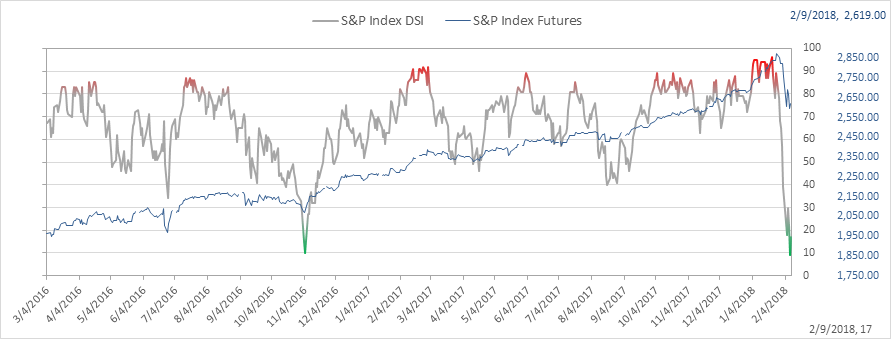
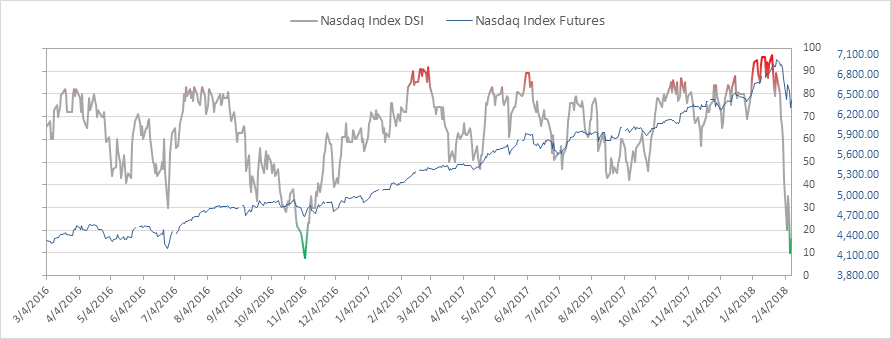
SPX bullish sentiment is at 17% and up from a cycle low of 9%. I expect a bounce to 40-50% and then fail. Nasdaq bullish sentiment is at 16% up from 10%
|
|
|
|
|
|
|
|
|
|
|
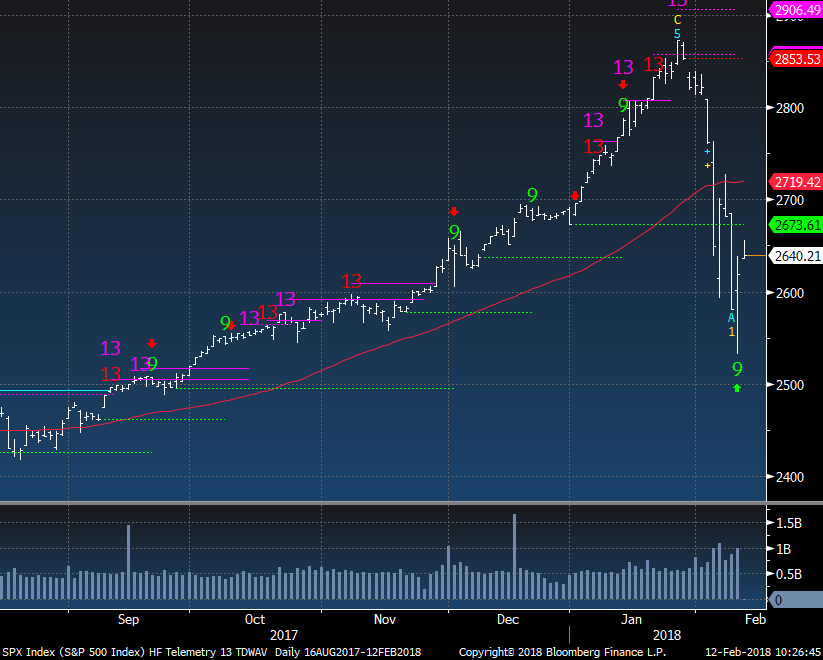
SPX daily was able to register the downside green Setup 9 on Friday but the futures bounced high enough to negate the downside 9 and closed up which wasn't what Tom DeMark expected. So part of his call is negated. I expect a lower high bounce with a wave 2/B lower high. It will register when an 8 day high is made.
|
|
|
|
|
|
|
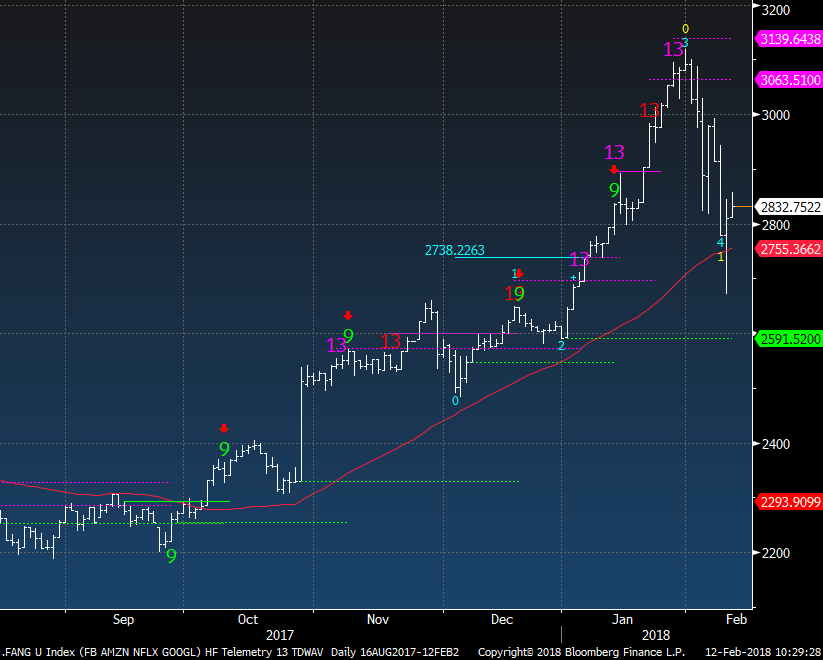
FANG Custom Index only pulled back to the 50 day vs the majority of stocks that went under the 200 day. Shows the relative strength of these market leaders which is no surprise.
|
|
|
|
|
|
|
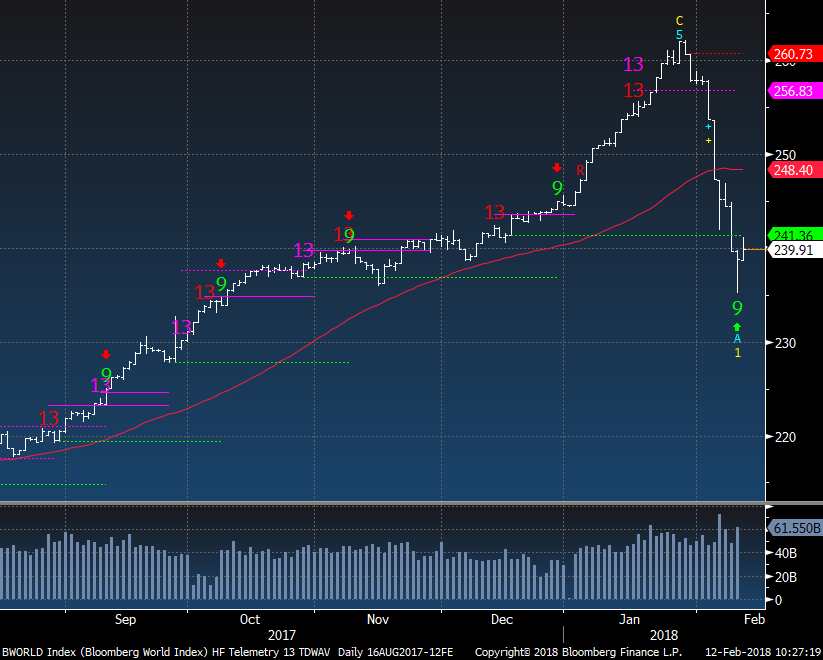
A few global indexes to watch closely
|
|
|
Bloomberg World had a downside 9. I expect the same scenario with the lower high bounce
|
|
|
|
|
|
|
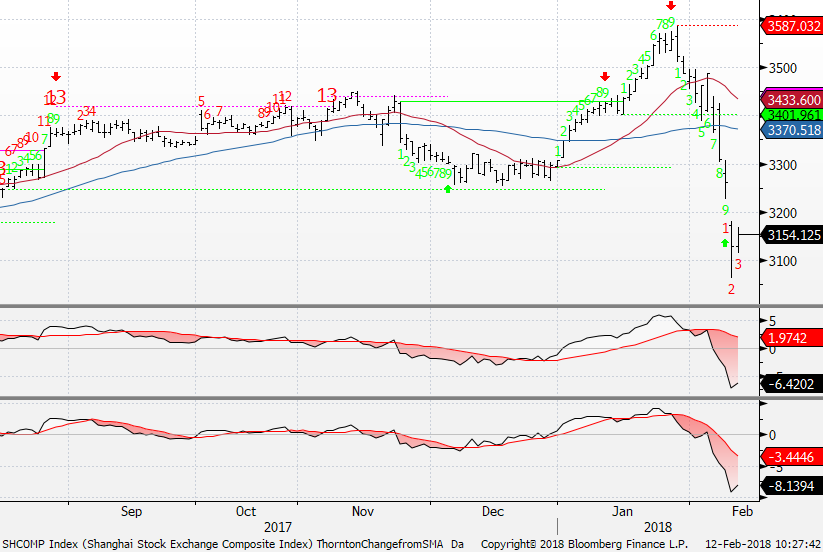
China Shanghai Composite bounced yesterday but there still is a downside red Countdown and that concerns me.
|
|
|
|
|
|
|
|
|
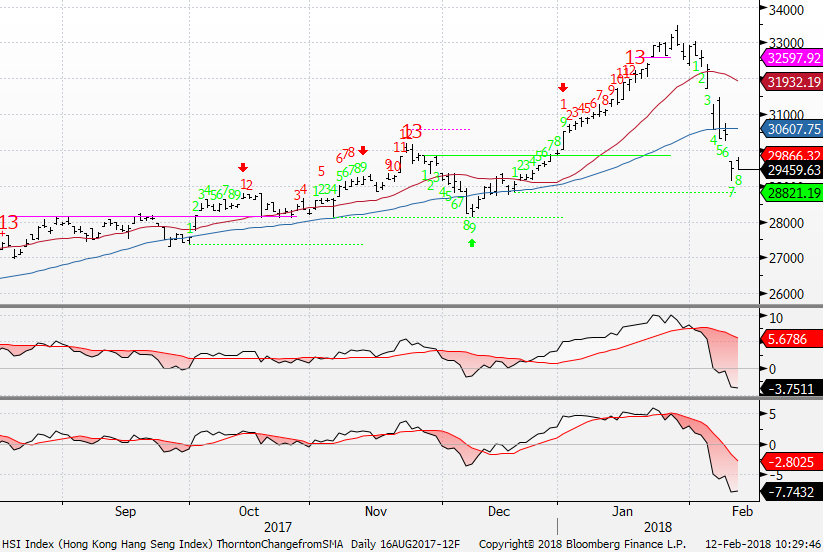
Hang Seng is only on day 8 of 9 and will have it's downside green Setup 9 tomorrow likely holding that green dotted TDST line. This gives me some hope a bounce is ahead.
|
|
|
|
|
|
|
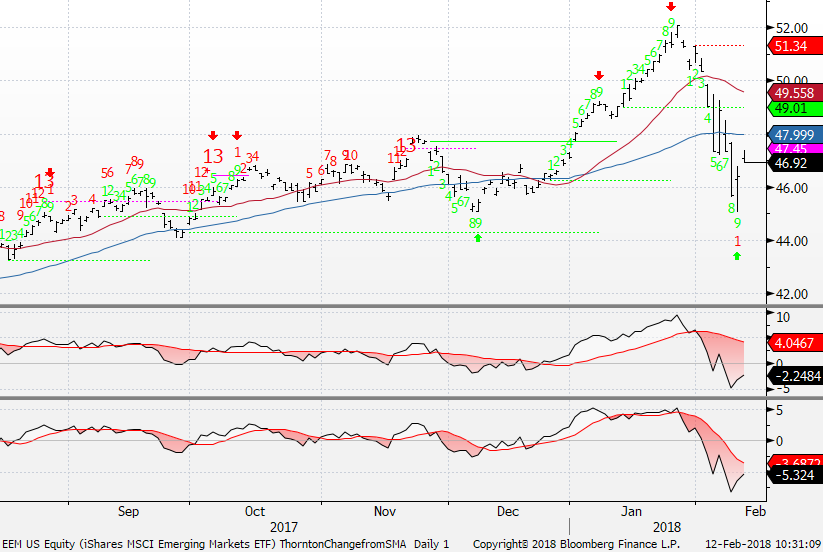
EEM bounced with the downside green Setup and likely will run into resistance between the 20 and 50 day moving averages.
|
|
|
|
|
|
|
|
|
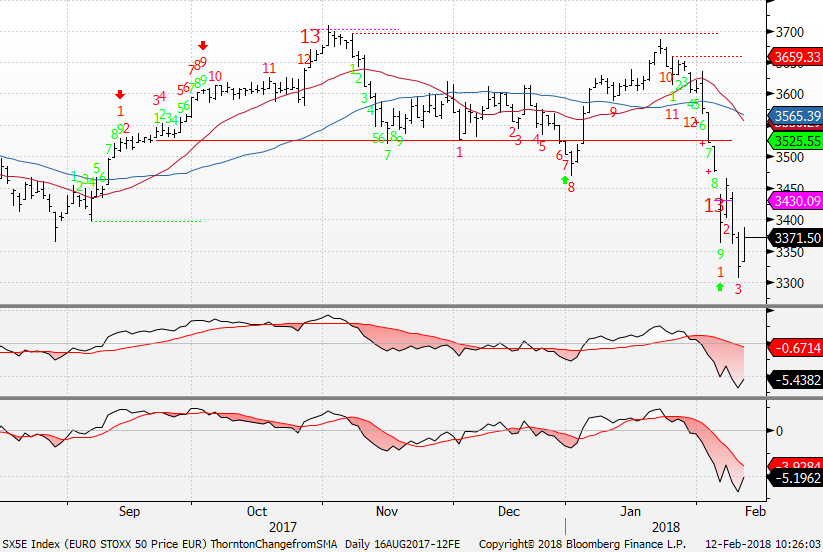
Euro Stoxx 50 looks broken as it couldn't bounce on it's green Setup 9 and has now a new secondary downside red Countdown on day 3 of 13. Sell bounces
|
|
|
|
|
|
|
A ton of US sectors. Most of them also have downside green Setup 9's suggesting a bounce
|
|
|
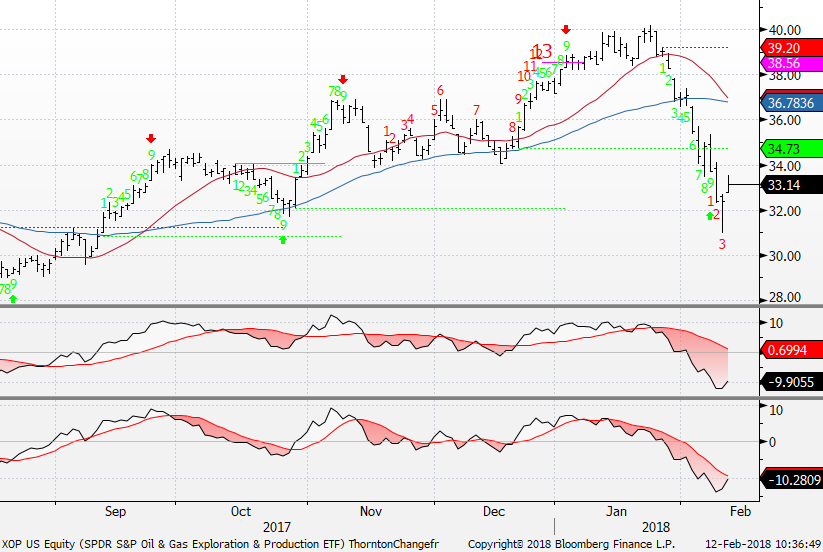
| XOP energy has a downside red Countdown. It was the most oversold sector ETF on my PPO monitor down 10% below the 50 day so today's bounce is welcome but sell into bounces
|
|
|
|
|
|
|
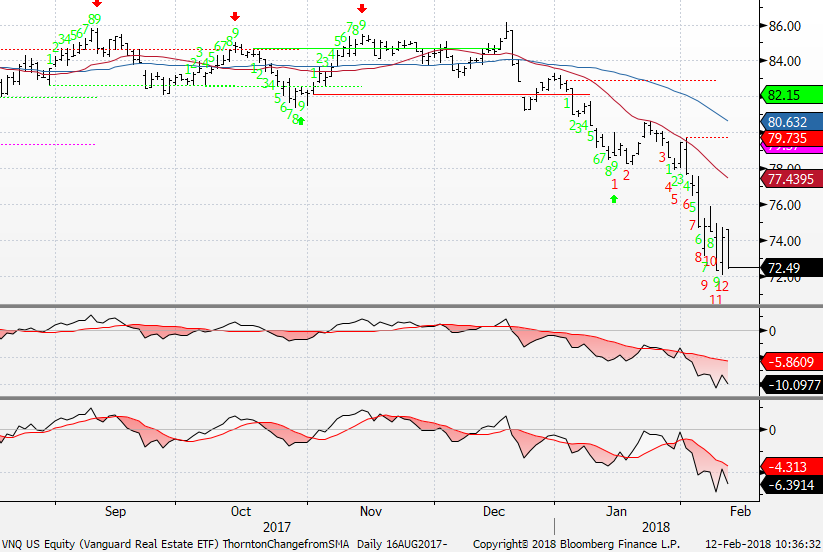
VNQ Real Estate is on day 12 of 13 and is getting close to exhausted. Another bond proxy so perhaps we'll get that bond bounce too
|
|
|
|
|
|
|
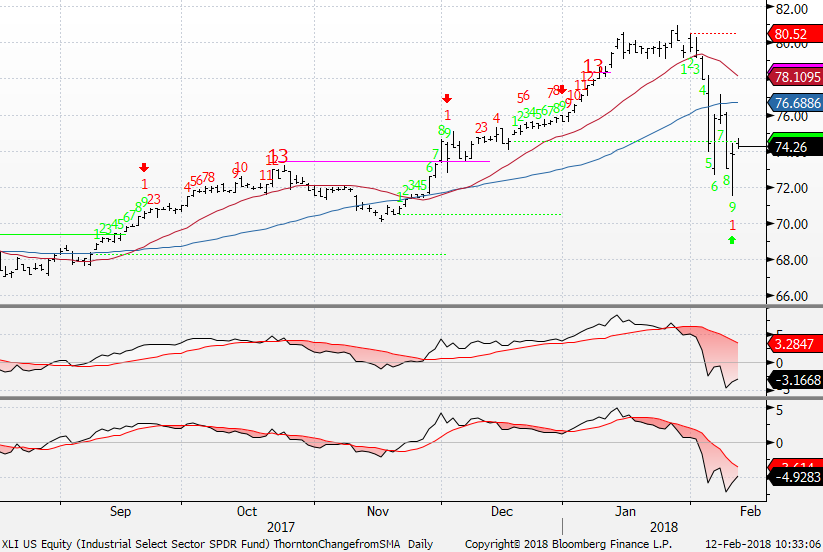
Industrials bouncing after green Setup 9
|
|
|
|
|
|
|
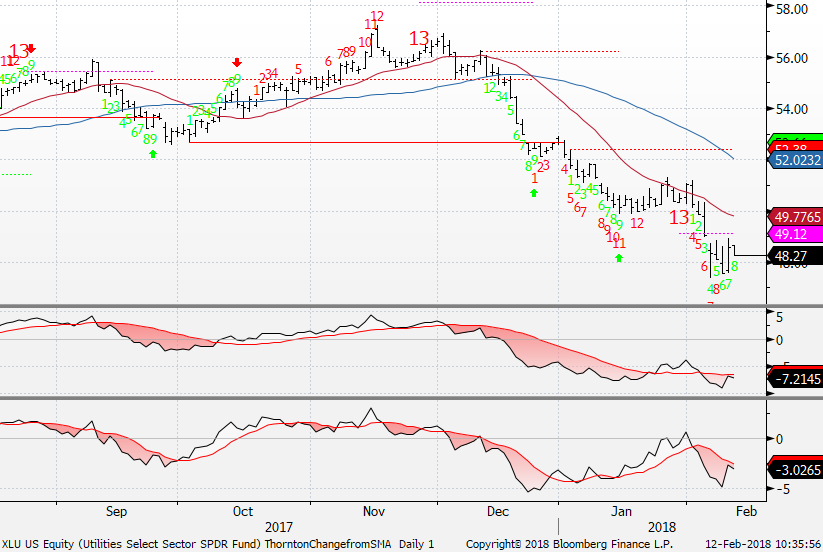
| Utilities legged down after the downside exhaustion and I've held it as I'm using it as a defensive bond proxy. It's not working so far and if the green Setup tomorrow can't turn this soon, I'll exit at a loss.
|
|
|
|
|
|
|
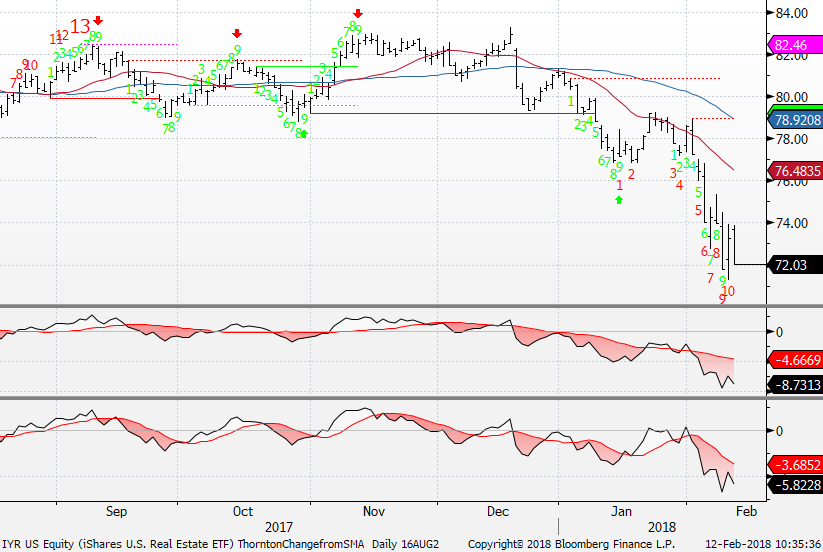
Another Real Estate ETF IYR also getting closer to downside exhaustion.
|
|
|
|
|
|
|
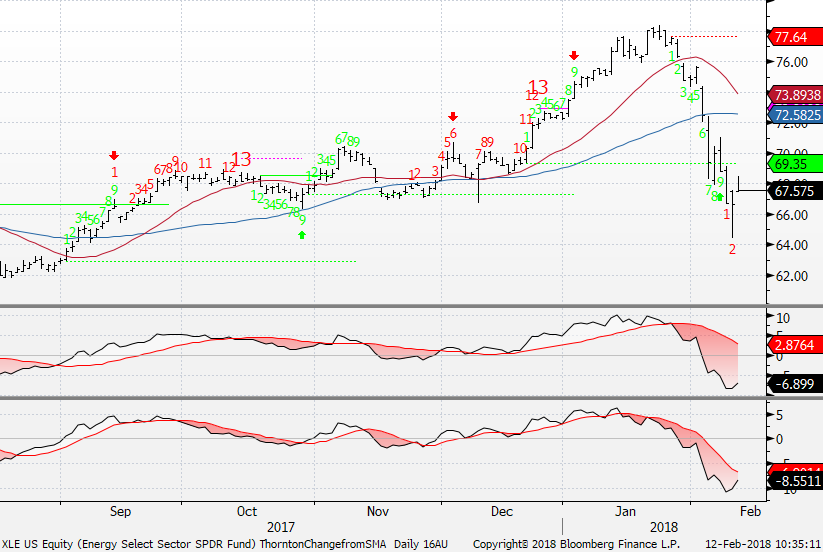
XLE energy like XOP is bouncing nice today but the downside red Countdown on day 2 of 13 is a concern
|
|
|
|
|
|
|
XLB Materials also is on day 2 of 13 and has really broken down
|
|
|
|
|
|
|
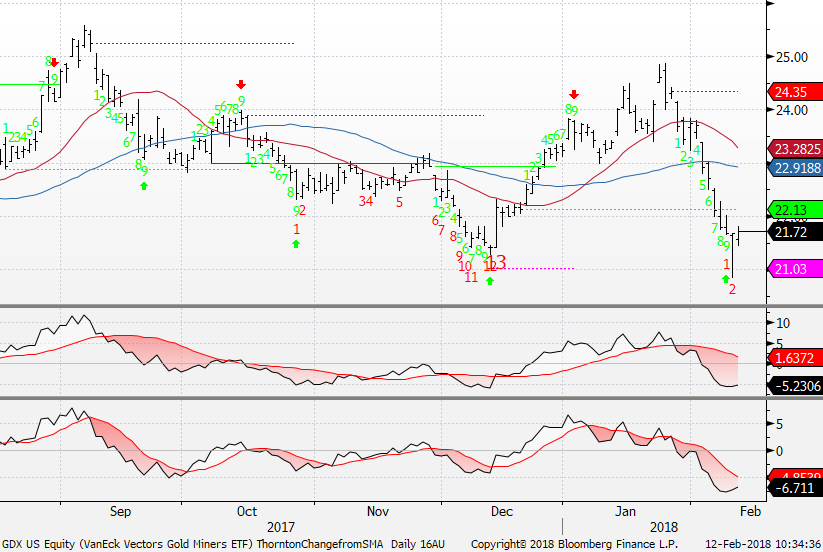
GDX Gold Miners is bouncing after the downside green 9 Setup but also has a new downside Countdown on day 2 of 13
|
|
|
|
|
|
|
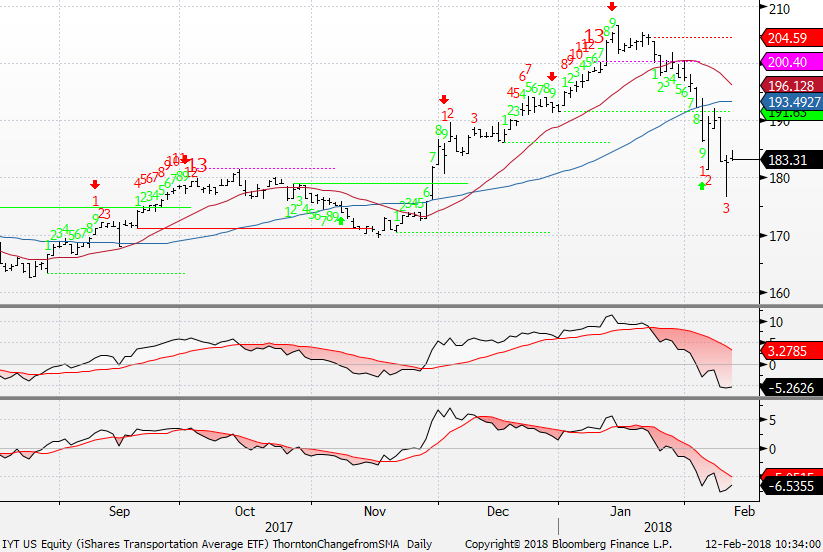
Transports same story on day 3 of 13 after a green Setup 9. Sell rallies
|
|
|
|
|
|
|
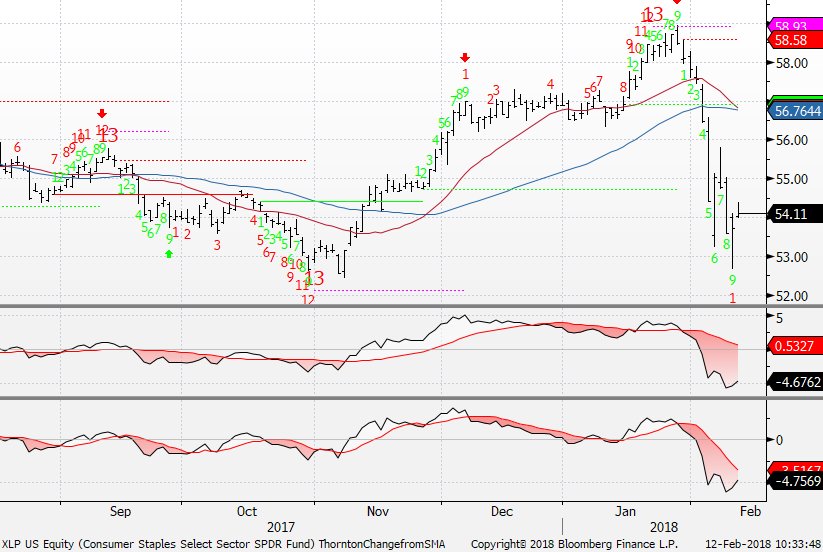
XLP Consumer Staples is bouncing after a green Setup 9.
|
|
|
|
|
|
|
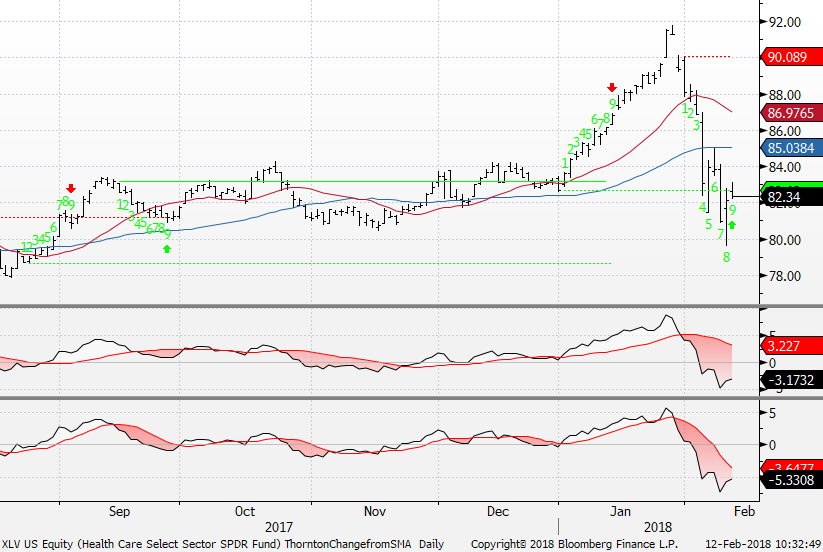
XLV Healthcare is holding support with it's downside green Setup 9
|
|
|
|
|
|
|
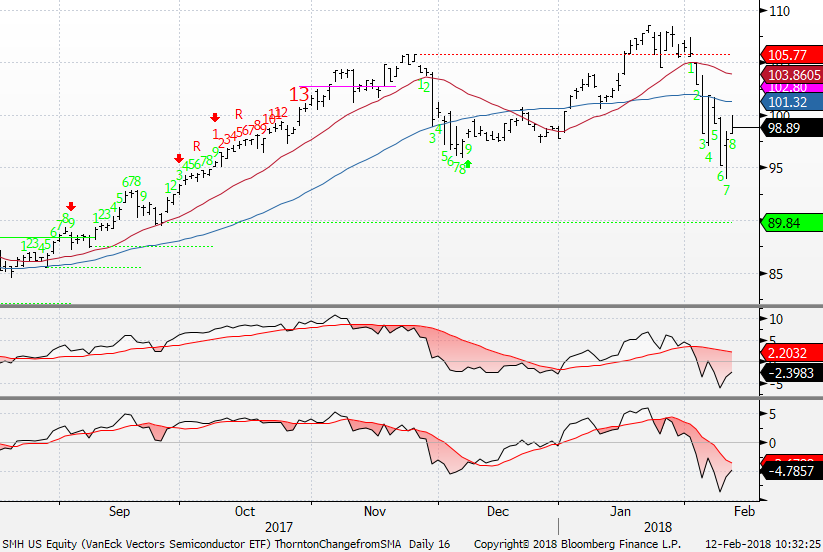
SMH Semiconductors is on day 8 of 9 with it's green Setup count. It bounced after the last one
|
|
|
|
|
|
|
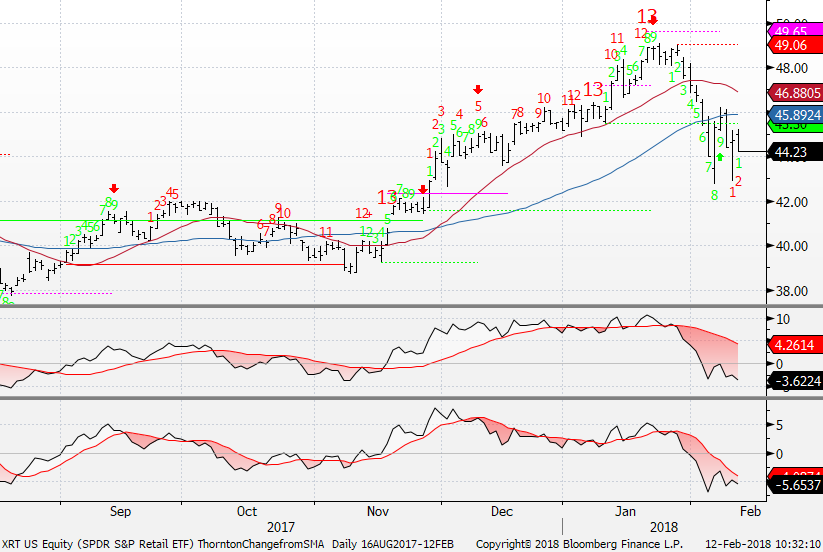
XRT Retail another one with a new red Countdown on day 2 of 13.
|
|
|
|
|
|
|
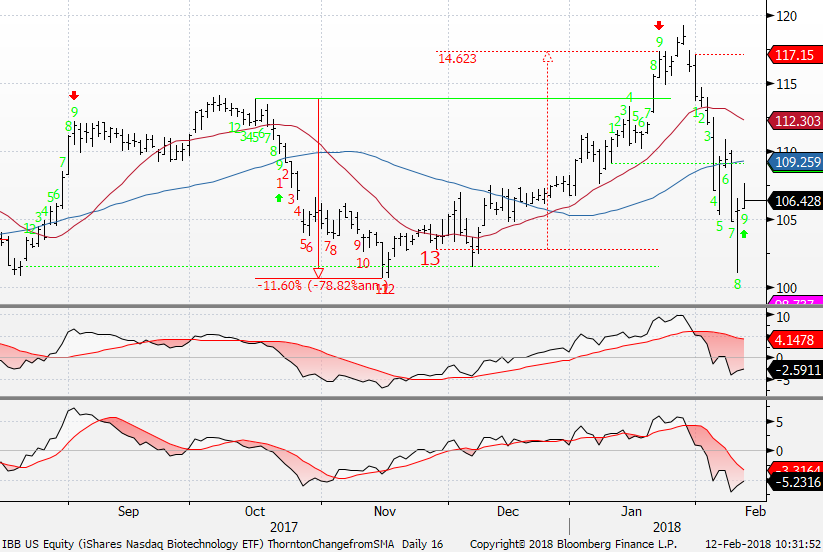
IBB Biotech like XLV has a clear green Setup 9 today.
|
|
|
|
|
|
|
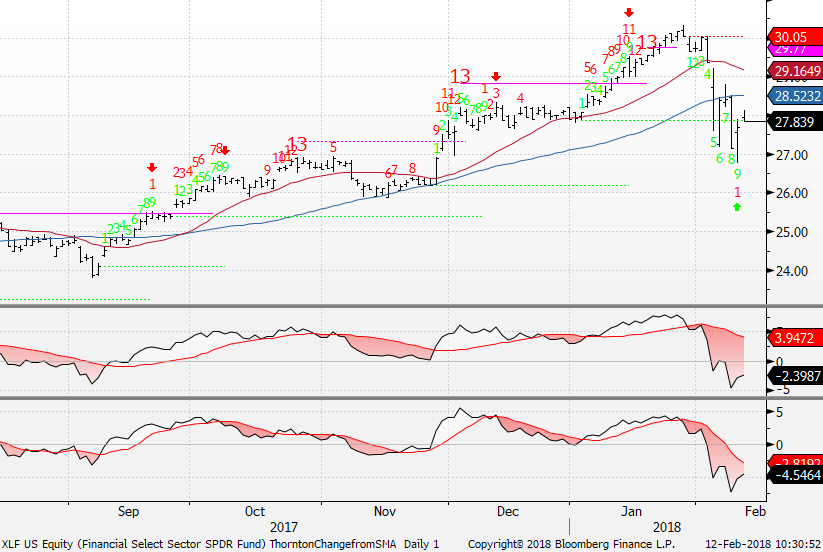
XLF Financials another one bouncing after the green Setup 9.
|
|
|
|
|
|
|
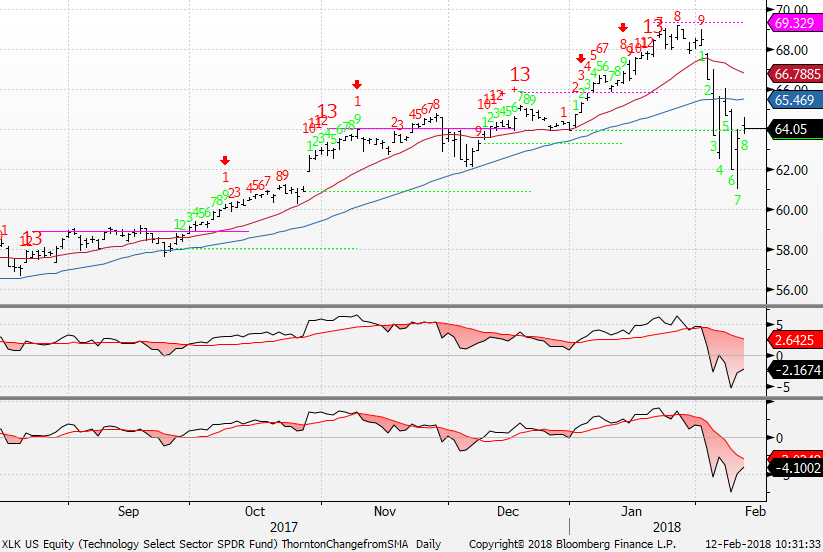
| XLK Technology like SMH is on day 8 of 9 with it's green Setup count
|
|
|
|
|
|
|
|
|
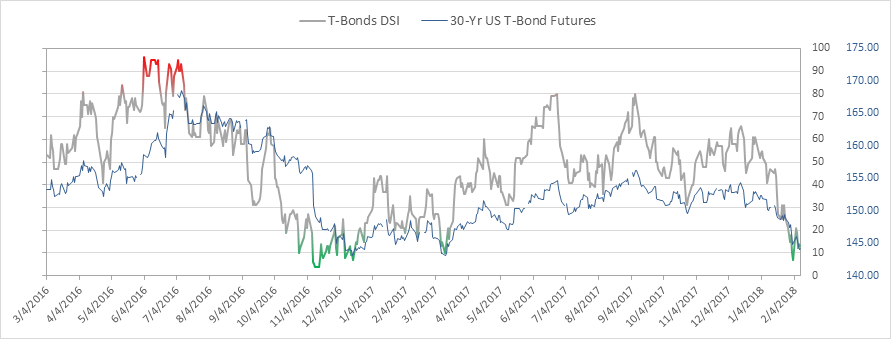
Bond sentiment is at 13% and remains oversold.
|
|
|
|
|
|
|
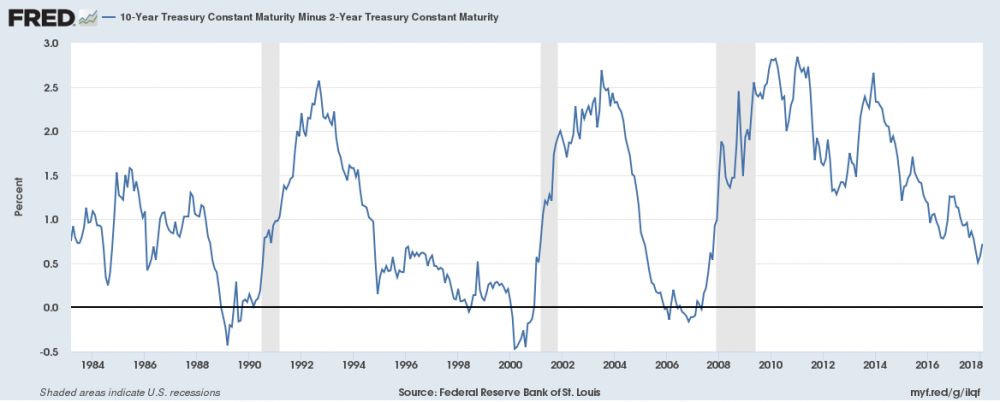
The FRED chart of the 2/10 on a long term time frame is interesting since the narrative is that recessions occur with the curve is inverted but these following charts make me believe the curve is going to steepen and perhaps this means a difficult market and economic recession is in the future.
|
|
|
|
|
|
|
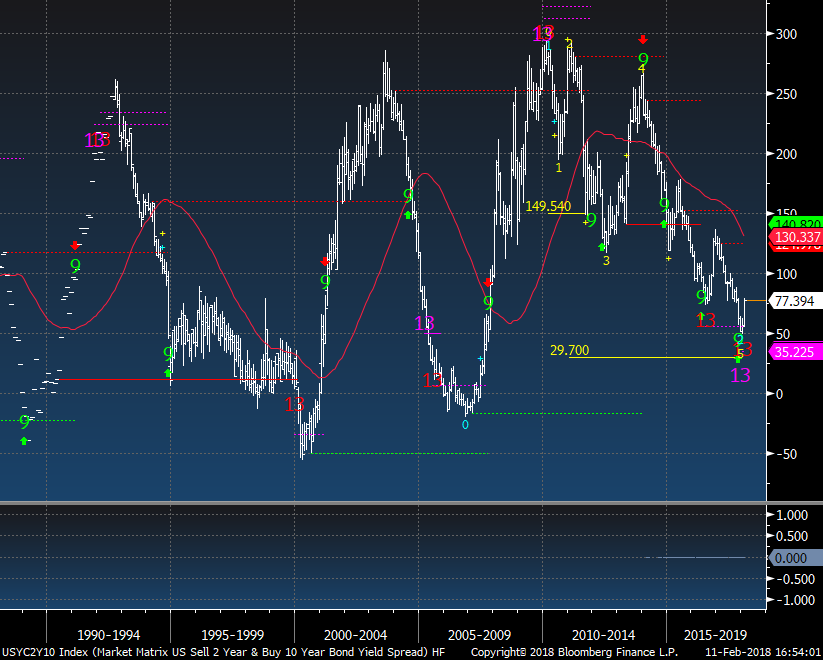
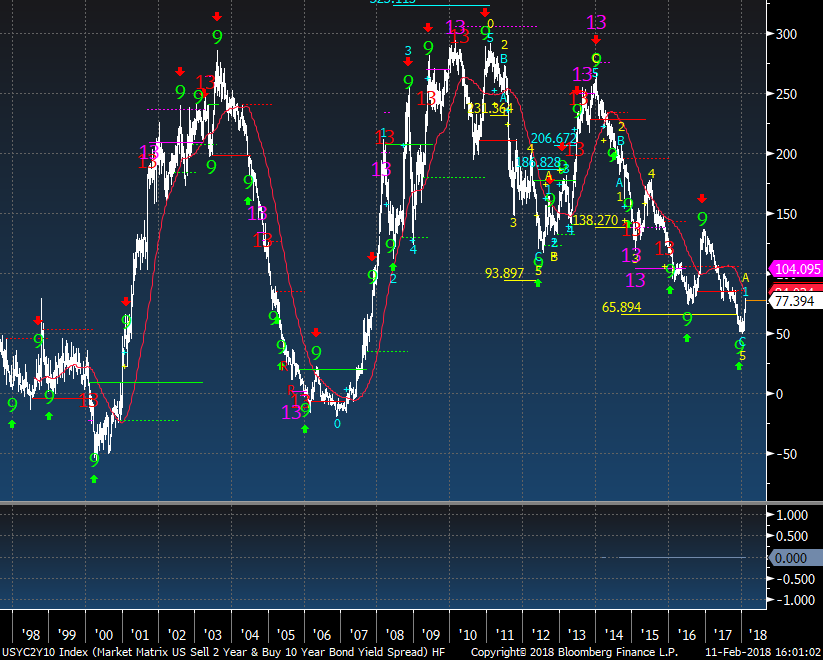
The monthly chart of the 2/10 with the DeMark indicators shows some interesting exhaustion signals near tops and bottoms.
|
|
|
|
|
|
|
Adding to the conviction is the weekly chart with upside and downside exhaustion signals at inflection points
|
|
|
|
|
|
|
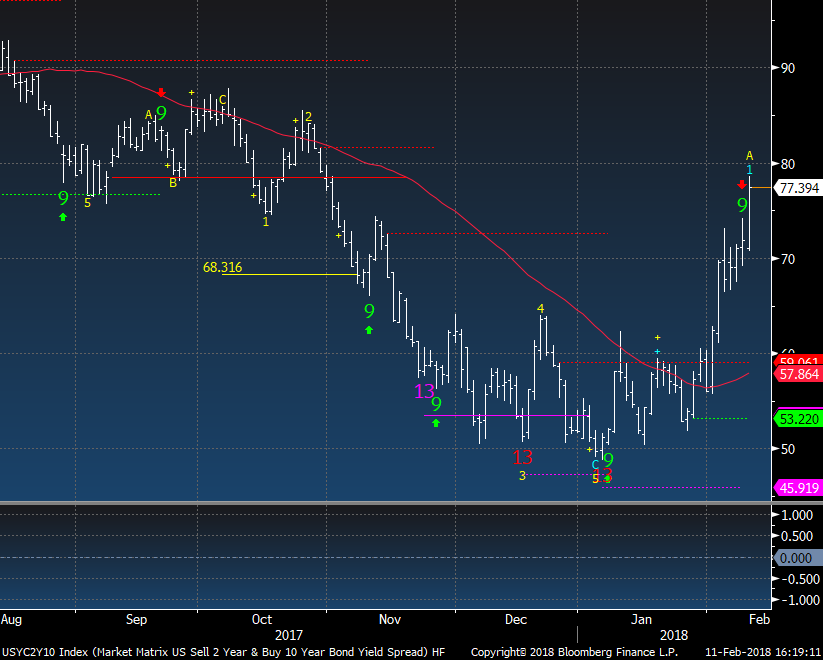
| The daily had some exhaustion in December and early January. This looks like a strong steepening move
|
|
|
|
|
|
|
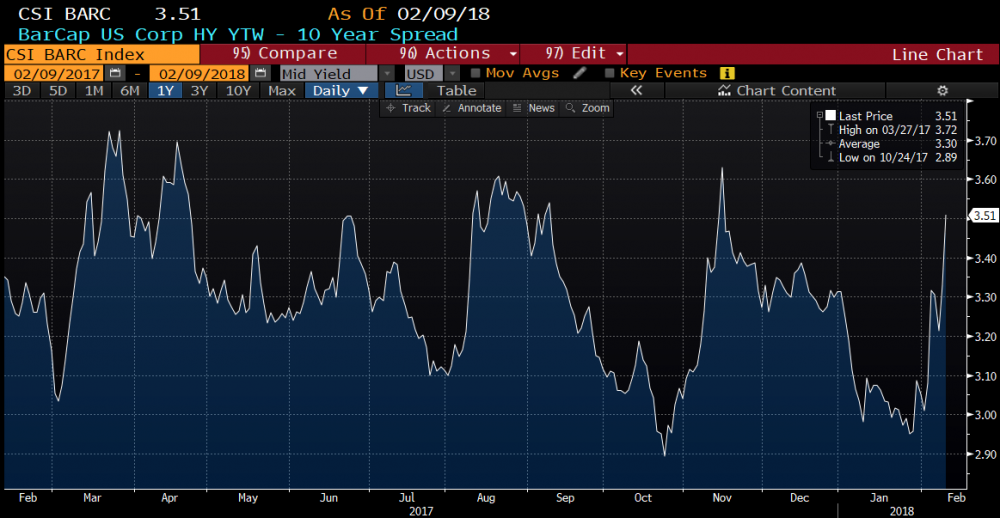
High Yield vs 10 year spread moved wider last week
|
|
|
|
|
|
|
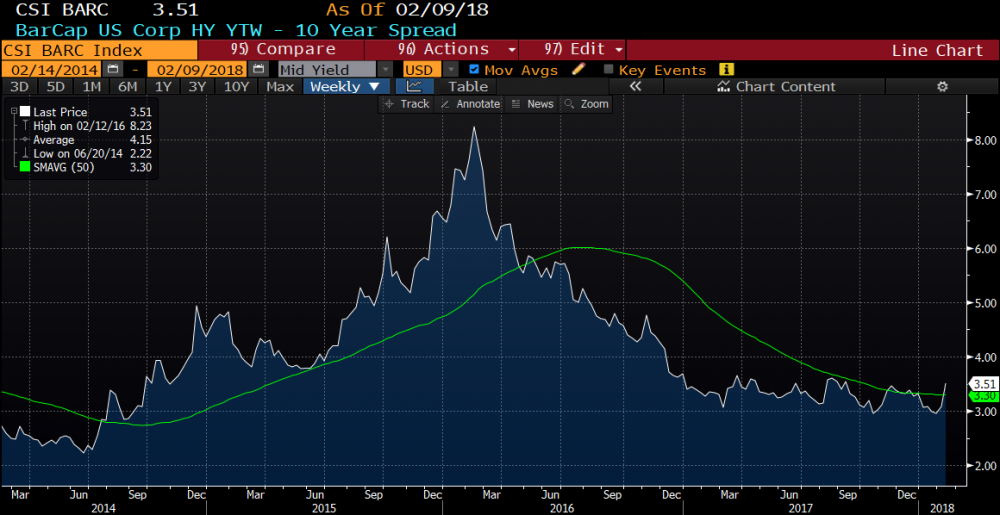
The weekly of the same chart looks like it want's to break out of a year long base. The last time it moved above the 50 week moving average it didn't stop.
|
|
|
|
|
|
|
This is a nice overlay with the SPX and 2/10 spread correlation
|
|
|
|
|
|
|
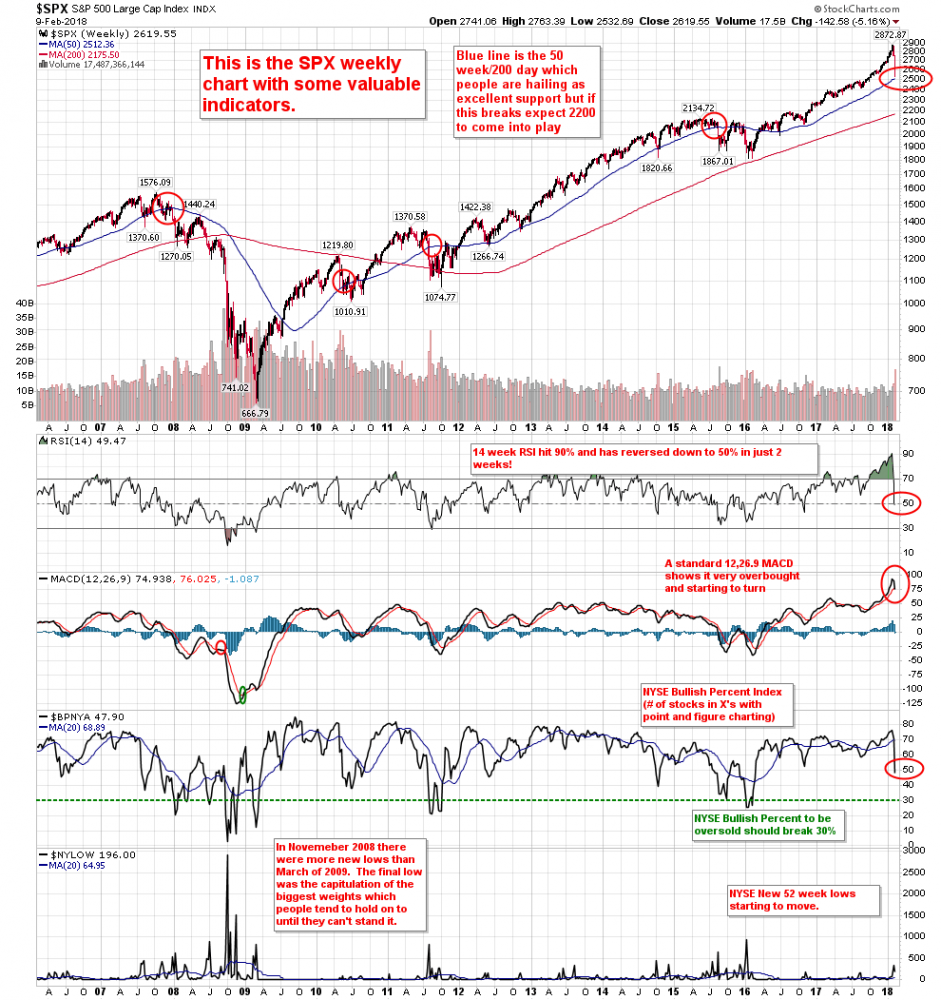
S&P 500 Weekly Indicators just starting to turn lower
|
|
|
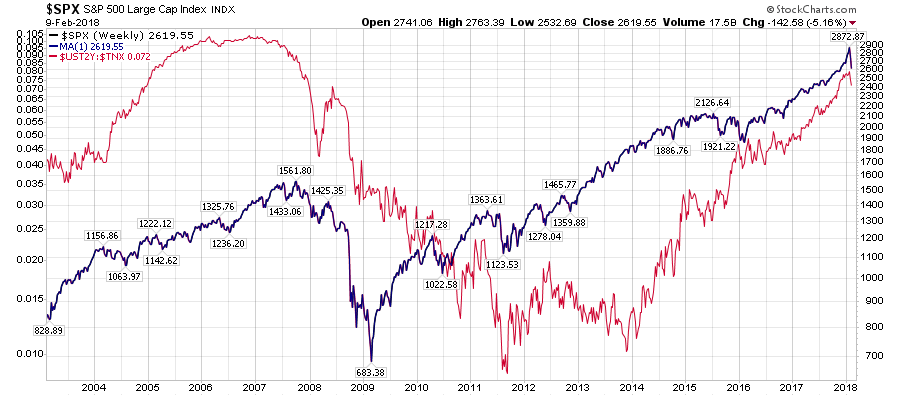
SPX weekly has several indicators that are not comparably oversold as other periods.
|
|
|
|
|
|
|
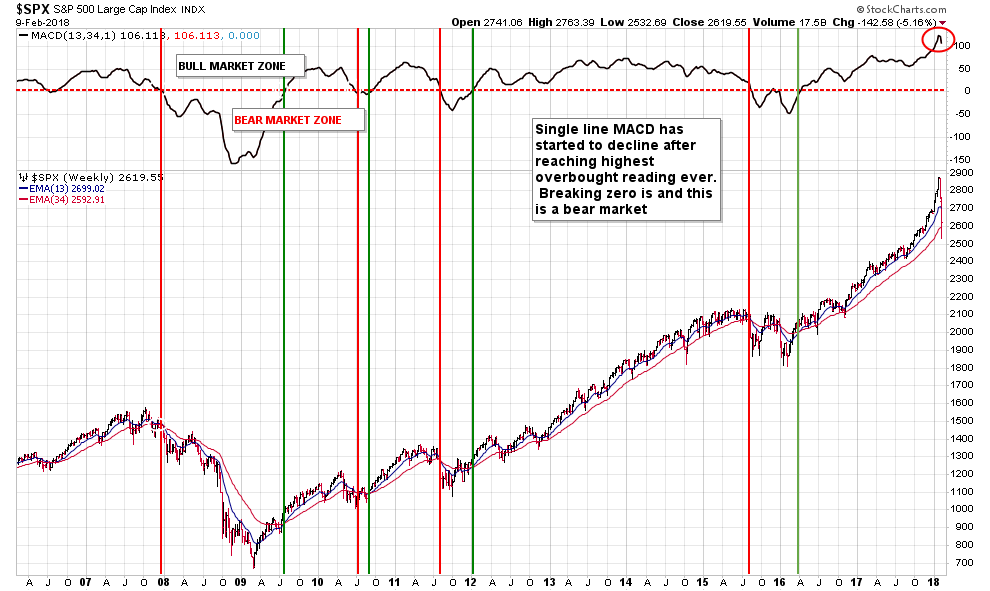
This is the SPX weekly chart with a single line MACD on top that shows how overbought and how it just started to hook down. This is my point that this indicator will take time to fully correct and if it breaks the 0 line this will be a bear market. I created this chart in 2007 and now can get dusted off
|
|
|
|
|
|
|
|
|
DEMARK SCREENS - Daily, Weekly, Monthly Upside/Downside Exhaustion Signals
|
|
|
Daily/Weekly DeMark upside/downside exhaustion signals (Sequential) Weekly updated on Monday's. Price flips occur when a stock closes higher/lower than four previous closes.
S&P 1500 Universe:
DAILY UPSIDE 13: SKX
DAILY DOWNSIDE 13: SRDX
DAILY UPSIDE WITH PRICE FLIP REVERSAL DOWN: CMTL, EZPW
DAILY DOWNSIDE WITH PRICE FLIP REVERSAL UP: BLKB, BLL, GPRE, HAS
Updated: 2/5/18
WEEKLY UPSIDE 13: ABMD, AON, AXE, BF/B, BIIB, BOFI, BR, CSCO, DGX, GD, LMT, MAR, RL, ROST, SGY, SPPI, STT, SYY, UFS, WAT, WSO
WEEKLY DOWNSIDE 13: BELFB, EGOV, FSP, INT, RRC
Updated: 2/1/1
MONTHLY UPSIDE 13: CHD, CLGX, CLX, CNMD, DVA, FICO, IDCC, MSCI, ORLY, PAYX, TFX, VMC, XYL
MONTHLY DOWNSIDE 13: GPOR
Euro Stoxx 600 Universe:
DAILY UPSIDE 13: NONE
DAILY DOWNSIDE 13: BN FP, EDF FP, RTO LN, SN/ LN, SVT LN
DAILY UPSIDE WITH PRICE FLIP REVERSAL DOWN: ABE SM
DAILY DOWNSIDE WITH PRICE FLIP REVERSAL UP: BMPS IM
Updated: 2/5/18
WEEKLY UPSIDE 13: ELM LN, JE/ LN, MC FP, TDC DC
WEEKLY DOWNSIDE 13: AA/ LN, NG/ LN, SGC LN
Updated: 2/1/18
MONTHLY UPSIDE 13: COFB BB, GAS SM, GKN LN, ING FP, KINVB SS, OML LN, VIS SM
MONTHLY DOWNSIDE 13: NONE
|
|
|
Unsubscribe me from Hedge Fund Telemetry
Hedge Fund Telemetry LLC, P.O. Box 4675, Greenwich, CT 06861, United States
CONFIDENTIALITY NOTE and DISCLAIMER: This message is for the named person's use only. It may contain confidential, proprietary or legally privileged material. No confidentiality or privilege is waived by any accidental or unintentional transmission. If you receive this message in error, please immediately delete it and all copies of it from your system, destroy any hard copies and notify the sender. You must not, directly or indirectly, use, disclose,
distribute, print or copy any part of this message if you are not the intended recipient. Hedge Fund Telemetry LLC. cannot guarantee the confidentiality of the material transmitted; therefore, information of a sensitive or confidential nature should not be transmitted. There is risk in trading markets. Hedge Fund Telemetry LLC reports are based on information gathered from various sources and believed to be reliable, but are not guaranteed as to accuracy and completeness. The information is subject to change without notice and Hedge Fund Telemetry LLC has no obligation to provide any updates or changes. Hedge Fund Telemetry LLC is providing this data for informational and educational purposes and does not believe that it is sufficient to base an investment decision on. This information should not be regarded as a solicitation or recommendation of any particular security or to engage in any trading strategy. One should always check with your licensed financial
advisor to determine suitability of any investments.
|
|
|
|
|