|
|
|
|
|
|
|
|
Yesterday I highlighted some cautious signs that are making me concerned for a meaningful pullback. One of my concerns is that the US markets could drop through a trap door almost without a catalyst or clear advanced warning. Seeing the bond market bounce is a sign of risk off. The Russell 2000 has dropped 4% from the highs in June and the Transports Index has dropped 8% in the past couple weeks. Financials are trading at or near 2018 lows. What is dangerous is that markets
become dislocated (or crash if you may) when they are oversold at support. The risk is that recent buyers (dip buyers) and the people who have held despite the YTD draw down just give up. We are seeing this type of action around the world with emerging markets and notably in China and Hong Kong. Many major indexes have had in the past couple days downside DeMark green Setup 9's which tend to either see bounces that are short lived or the trap door scenario as a new red Sequential Countdown to 13 starts. This same green Setup 9 happened on February 9th and the market reversed up. The difference was S&P bullish sentiment was at 9% bulls and today it is 40% and dropping. Another couple differences between those periods is that bonds were falling ahead of that low and bonds have been rallying for 5 weeks and the USD was steady at lows and now it has been lifting. A stronger USD will play into this quarter's earnings results as a headwind too.
In
summary, one should and can take some defensive measures by raising cash, taking some long exposure off, and tightening stops. I have some short ideas on the Trading Ideas sheet as usual. I hope to have the weekly Currency Focus email out in a few hours. I reorganized it with most important currencies on the top and least important at the bottom. Get through half of the report and you get a medal.
Notable:
- US Markets - Sentiment continues lower, DeMark Green Setup 9's a plenty
- Hedge Fund Telemetry Trade Ideas - Added short some financials to press
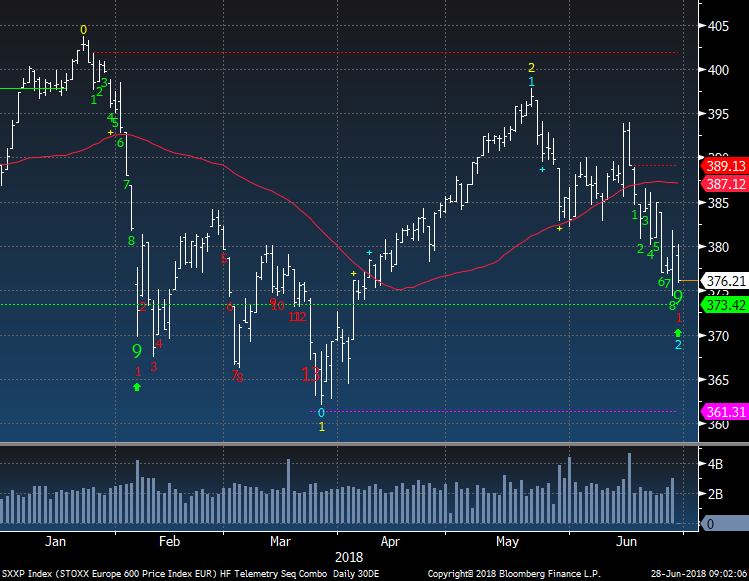
- European Index - Green Setup 9's too.
- EEM vs SPY A busted trade? Brazil, Bloomberg World Index
- Asian Markets - Shanghai has gone through the trap door
- India Nifty 50 -
Watch the next support level
- Hedge Fund Telemetry Extend and Pretend Index - Down more today
- Fed Ex - Has fallen hard and is a good example of a trap door stock
- Financials - Some new short ideas
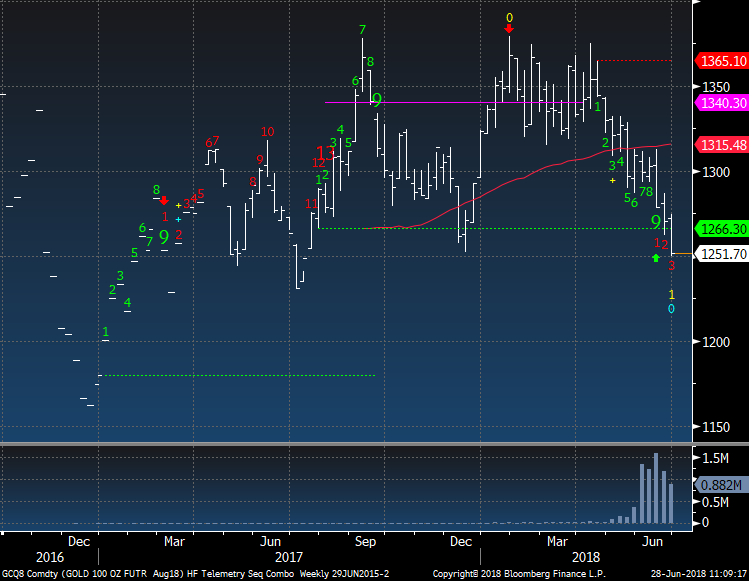
- Gold Update - Gold Futures on day 12/13 so we are closer
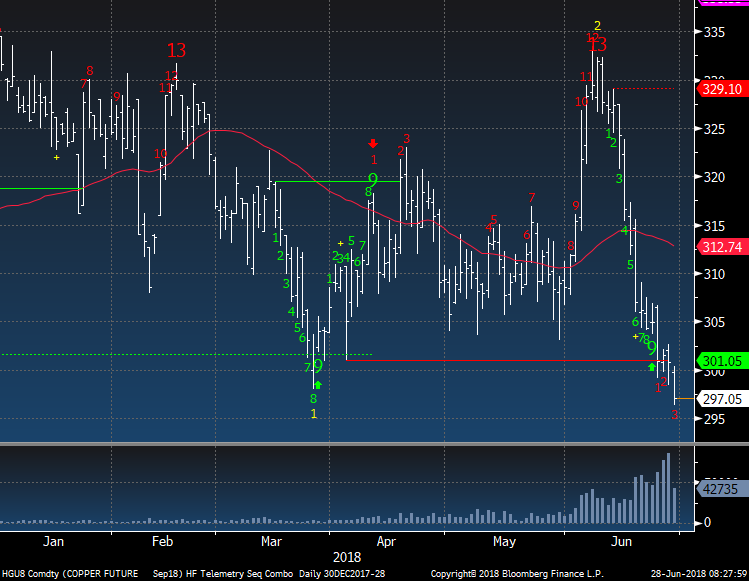
- Copper Update - Breaking down
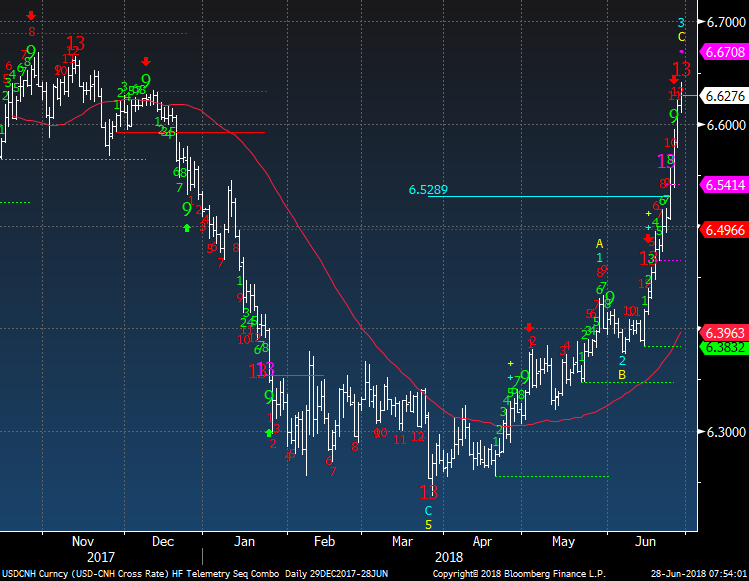
- Chinese Yuan - Exhaustion signal but in wave 3 so have to be cautious
with that signal
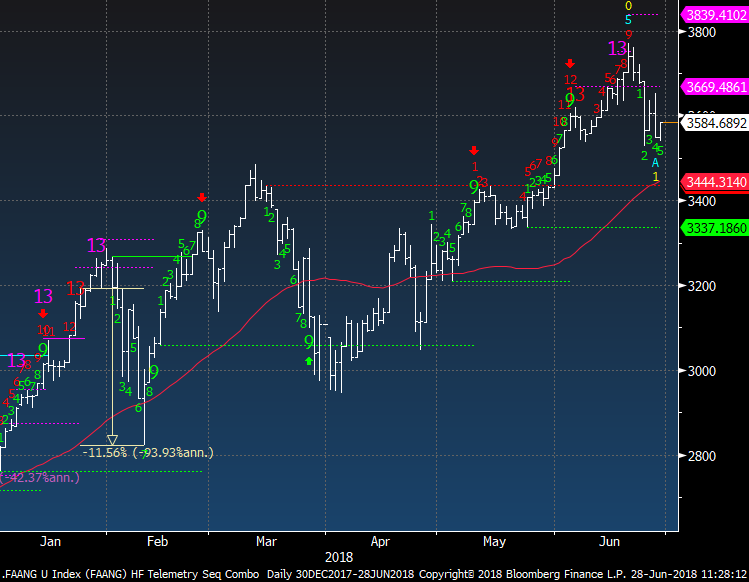
- FAANG and Apple Update
- Crude and Energy Thoughts - XOP upside 13 exhaustion today
- Currencies - Will send Currency Focus later
- Bond Update - Still looks buyable despite sentiment now elevated
- DeMark Screens - Daily, Weekly,
Monthly upside/downside exhaustion signals within the S&P 1500 and Euro Stoxx 600
|
|
|
|
|
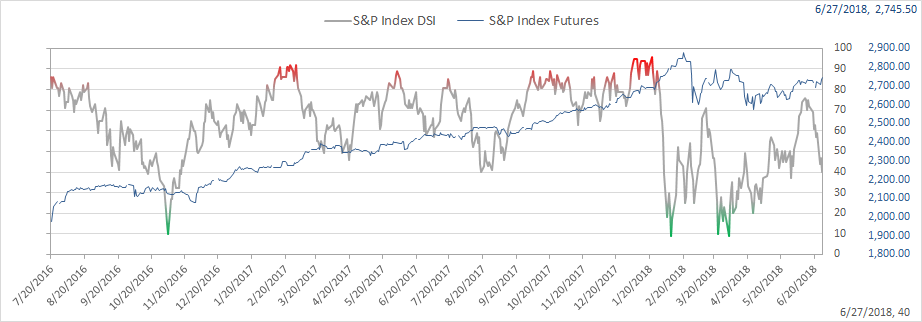
Here's a link to the Hedge Fund Telemetry market sentiment page with 40 charts of sentiment including equities, bonds, currencies, and commodities updated each day.
SPX bullish sentiment is at 40% down from 47%
|
|
|
|
|
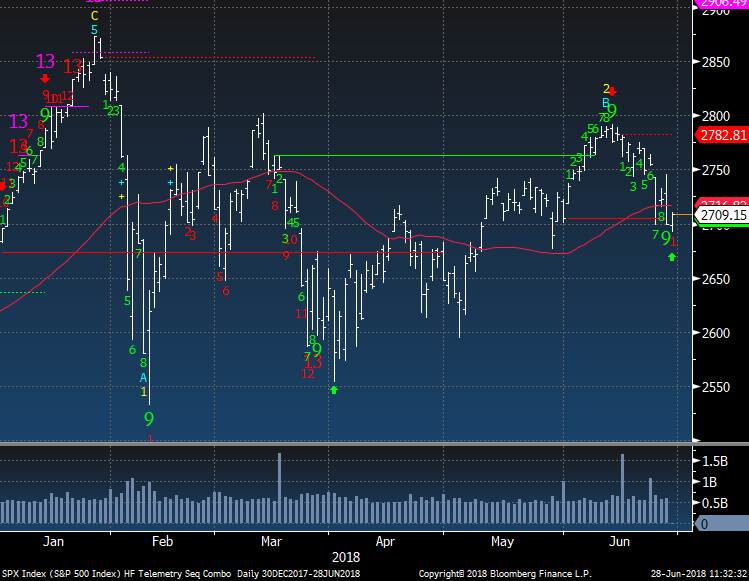
SPX cash index as you see has the downside green Setup 9 and now a red Countdown 1 of 13. The last time this happened the red Countdown did complete however it an unusual way! The solid red line is the TDST support like which was dottted green but has qualified itself. This is a DeMark thing that I don't have to get into the details but let me just say when qualified the odds for a downside 13 are greatly increased.
|
|
|
|
|
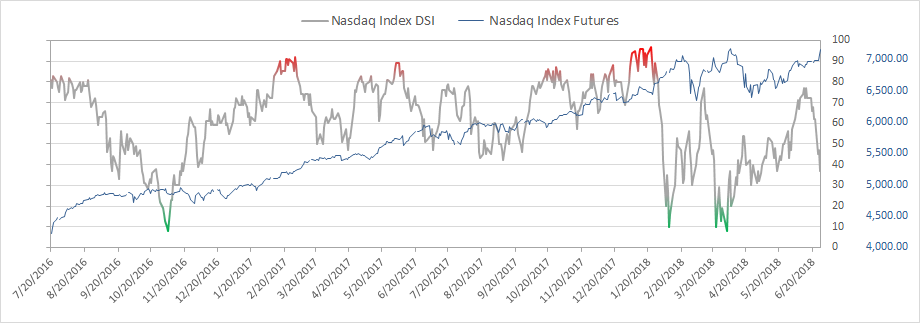
Nasdaq bullish sentiment is at 37% down from 47%
|
|
|
|
|
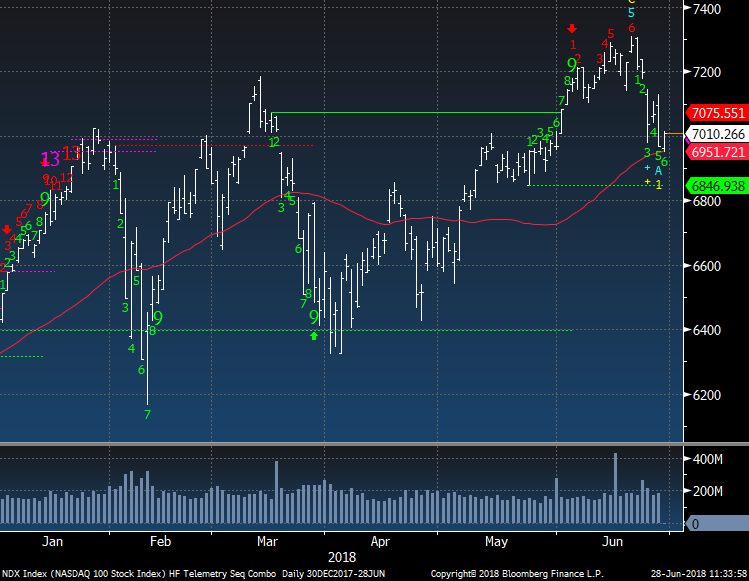
NDX cash index has been much stronger than the other indexes and has a both a green Setup 6/9 on the downside and a red 6/13 on the upside. If the green Setup completes on the downside the upside red Countdown will be cancelled. Watch 6846 for support. That is the most important thing on this chart
|
|
|
|
|
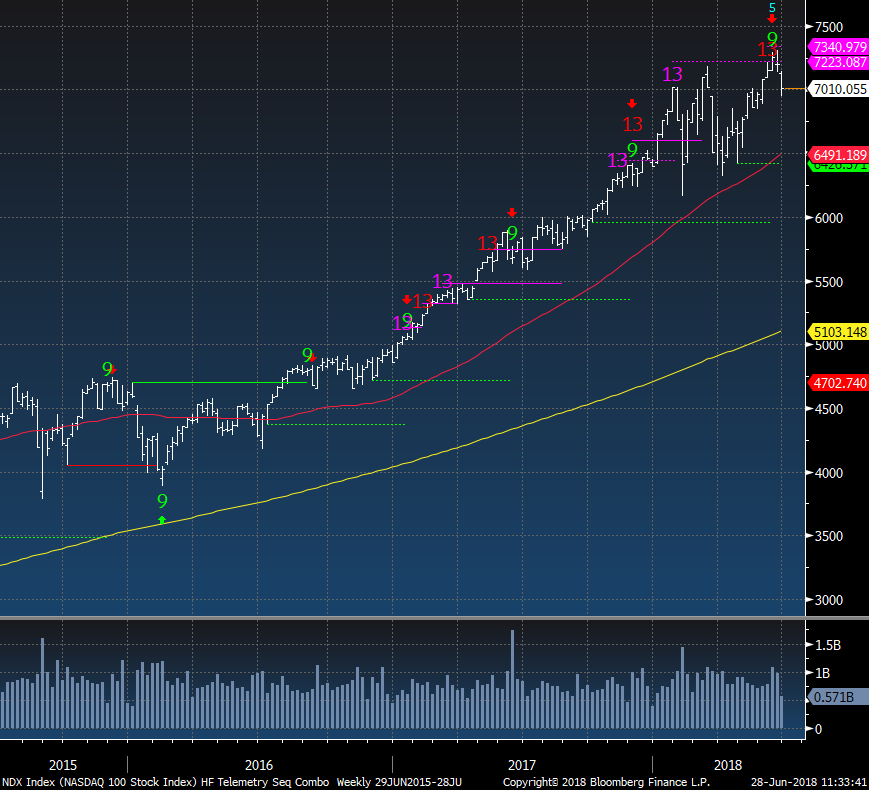
NDX weekly did get recent upside exhaustion and has slightly rolled over.
|
|
|
|
|
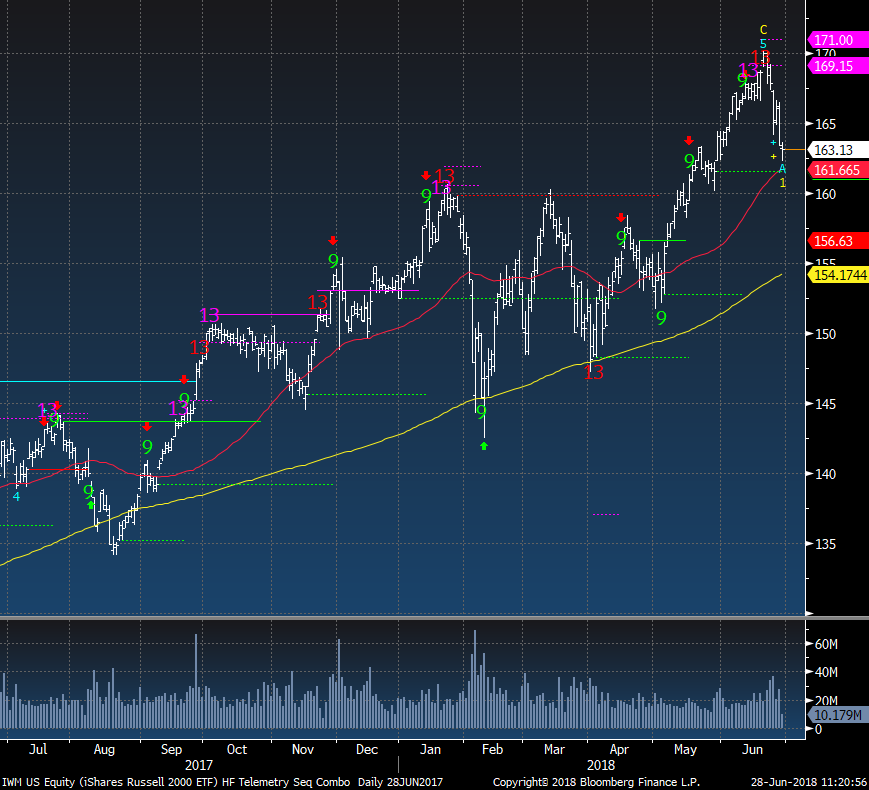
Russell 2000 IWM is down 4% off the highs after there were some upside exhaustion signals. 161 is support.
|
|
|
|
|
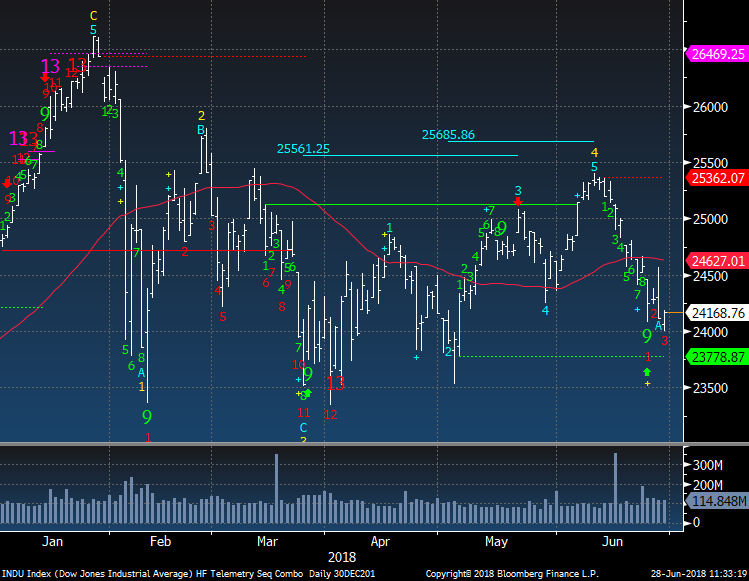
Dow Jones looks the most like it could go through the trap door as it is on day 3 of 13 with a downside Countdown. This is different from the February low
|
|
|
|
|
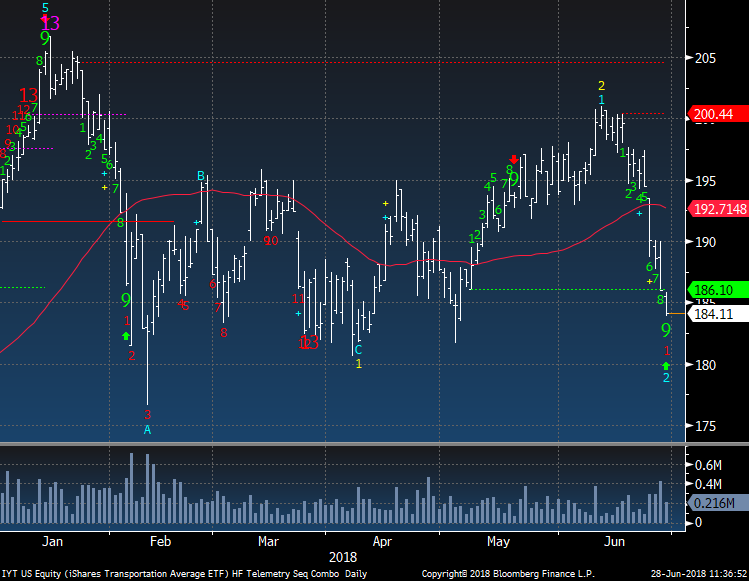
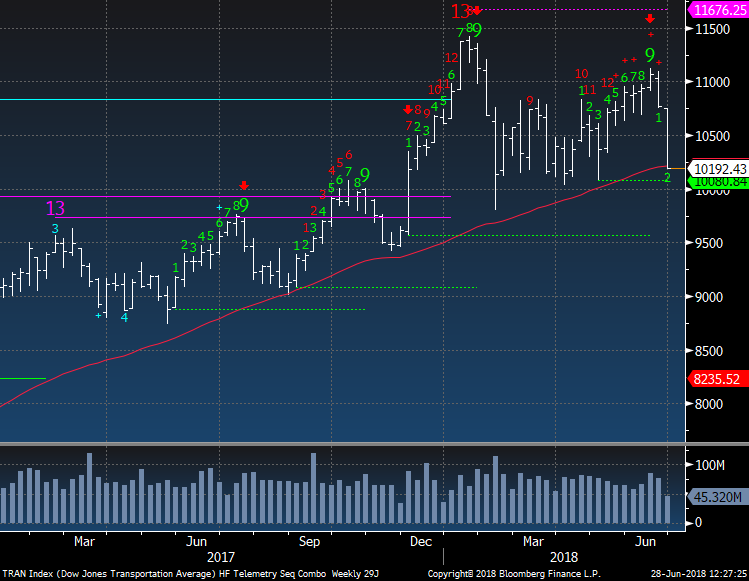
Transports have given back all the recent gains and has the green Setup 9 and red Countdown 1 too. Another index that could see a trap door if there is some more downside action
|
|
|
|
|
This is the Transports weekly and in 2 week it has taken off 1000 points. This is right at support and I think you see what I mean by trap door
|
|
|
|
|
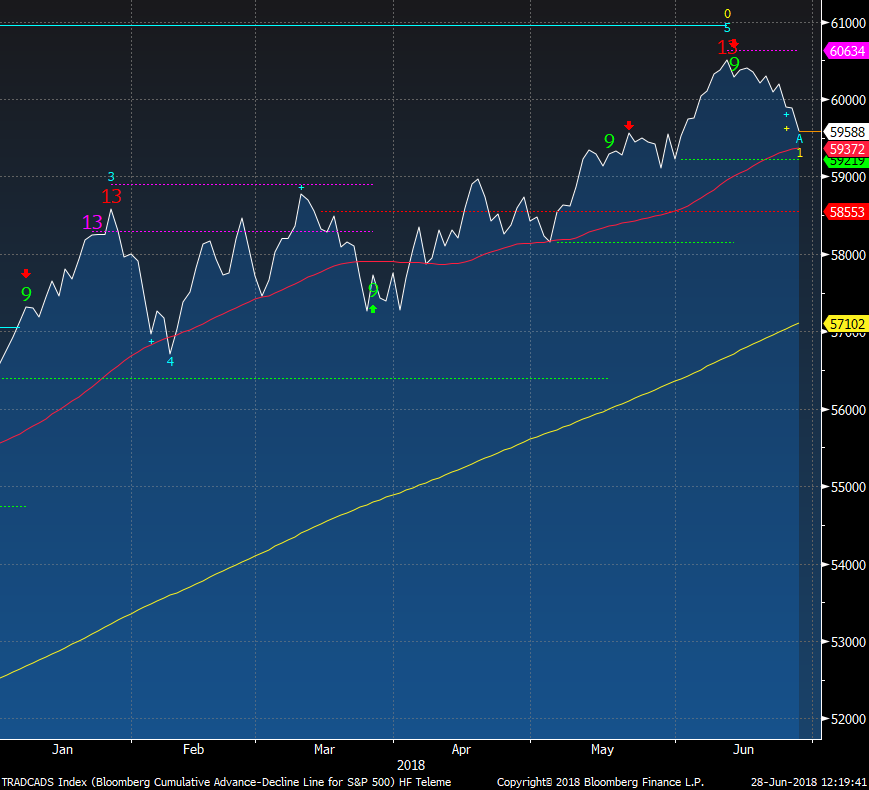
S&P cumulative breadth had upside exhaustion signals and has rolled over and we saw the same signals in January too
|
|
|
|
|
|
|
Hedge Fund Telemetry Trade Ideas
|
|
|
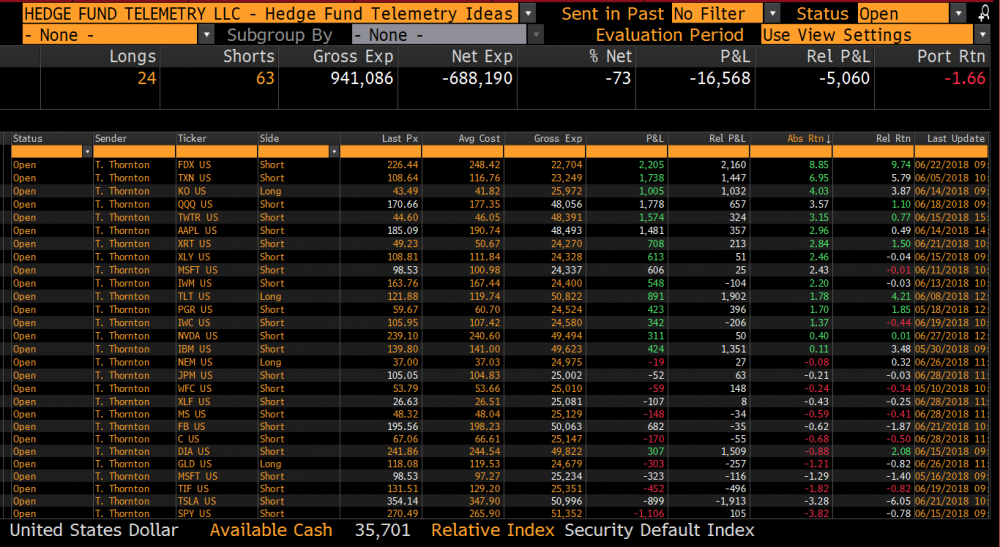
Trade Ideas - added short 2.5% size XLF, JPM, C, MS - trying to press these
|
|
|
|
|
|
|
|
|
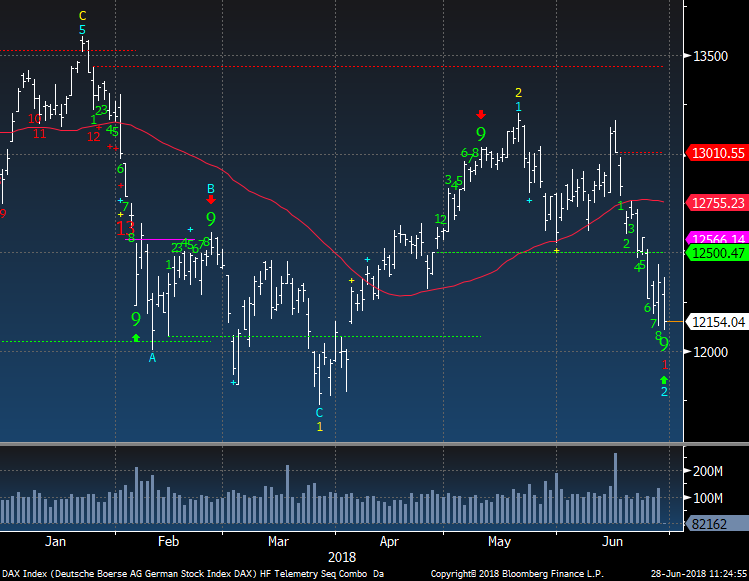
DAX had a pending upside red Countdown cancel today as the green Setup 9 was confirmed. Trap door is at 12,000
|
|
|
|
|
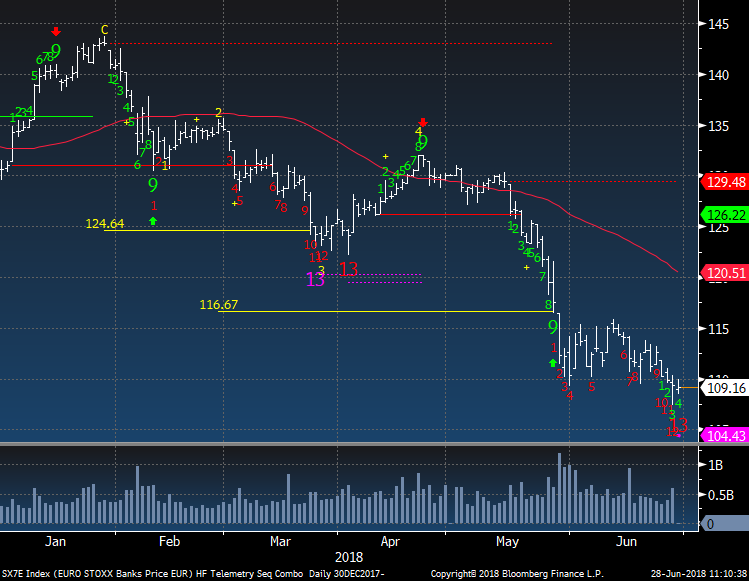
Oh my God! The Euro Bank index has a downside red Countdown 13 in Wave 5. This is a positive and this MUST reverse up within the next 5 days.
|
|
|
|
|
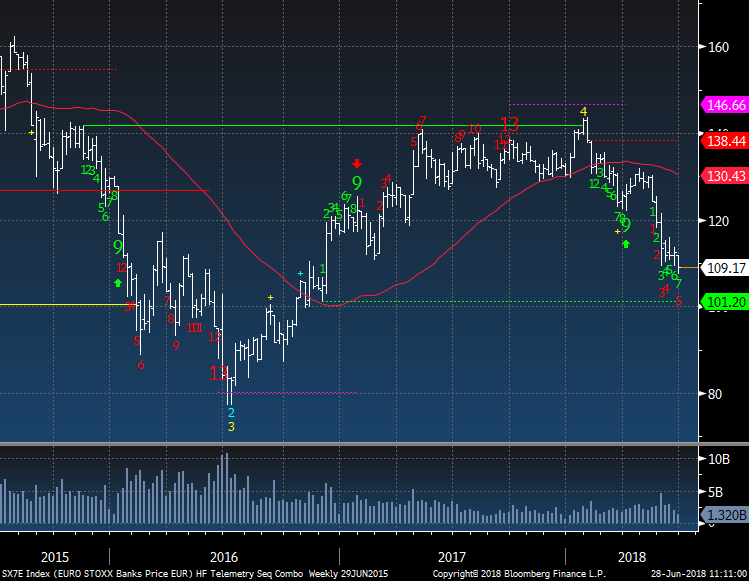
Just as when I got excited I am showing you the weekly of the Euro Bank index and it only is on week 5 of 13 with a downside red Countdown. The last downside weekly Countdown was a good spot to buy
|
|
|
|
|
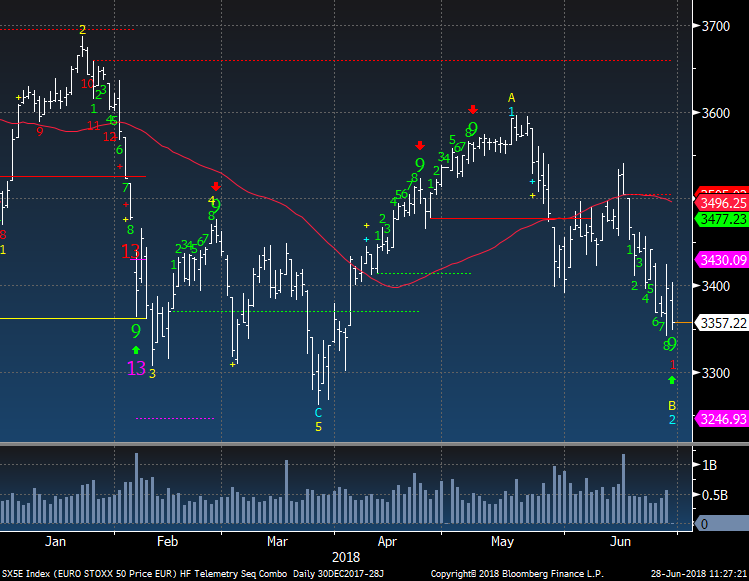
Euro Stoxx 50 same as DAX. Trap door at 3300
|
|
|
|
|
|
|
|
|
|
|
EEM vs SPY - A busted trade? Brazil and Bloomberg World Index
|
|
|
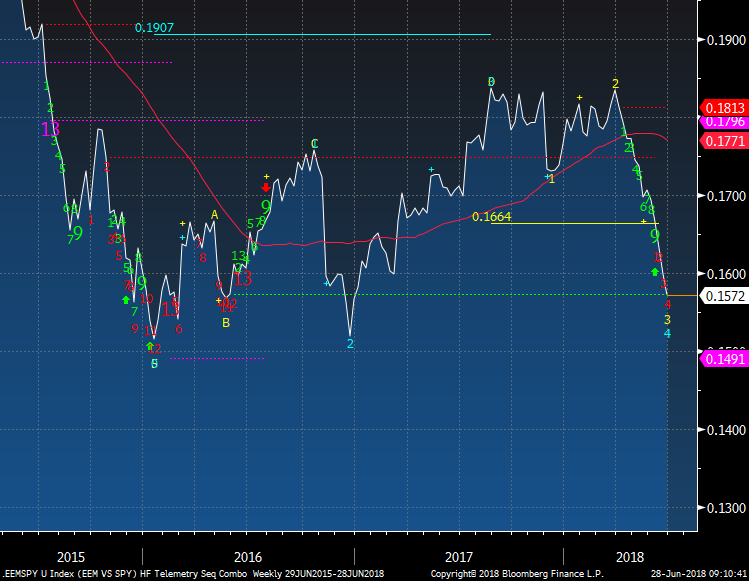
EEM vs SPY was a big consensus trade in the last year and was working however this has dropped hard and could make a new multi year low. It is on week 4 of 13 and at support right now
|
|
|
|
|
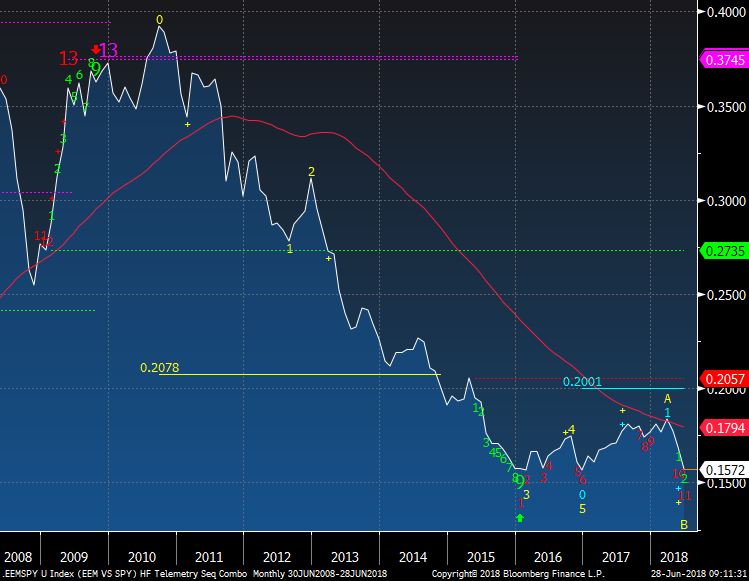
The monthly of the EEM vs SPY always had a downside red Countdown that made me concerned that the real turn up was not going to go as people planned. It is now on month 11 of 13 so perhaps there is a trade soon with lower risk.
|
|
|
|
|
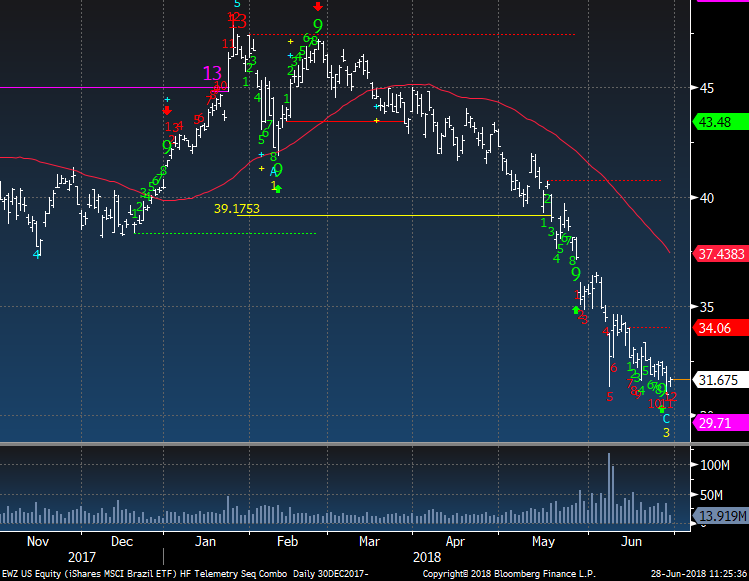
Brazil has been awful and I have been negative since January. It is on day 12 of 13 so a bounce could start in the coming days. Keep in mind it is in wave 3 which has a corrective lower high bounce wave 4 ahead then followed by a lower low wave 5. If you trade this on the long side, do so small and tight. I am not a big fan of buying or selling exhaustion signals in wave 3.
|
|
|
|
|
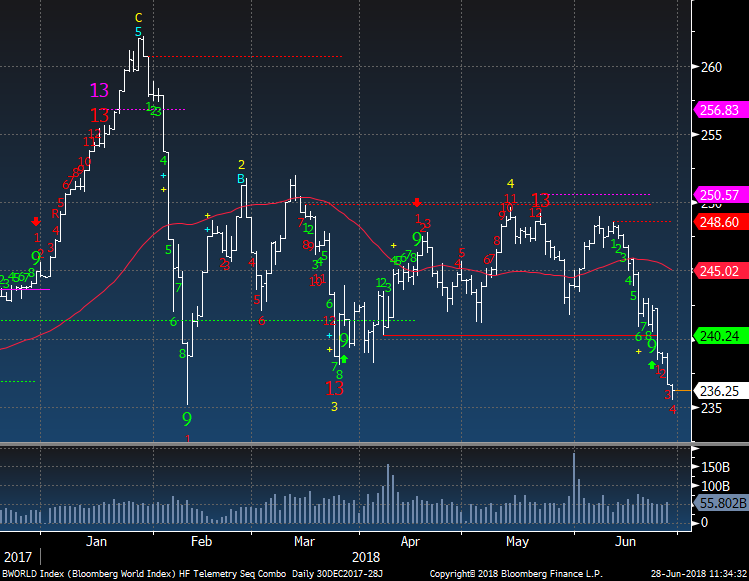
Bloomberg World Index is making new closing lows and is on day 4 of 13 with a downside Countdown.
|
|
|
|
|
|
|
|
|
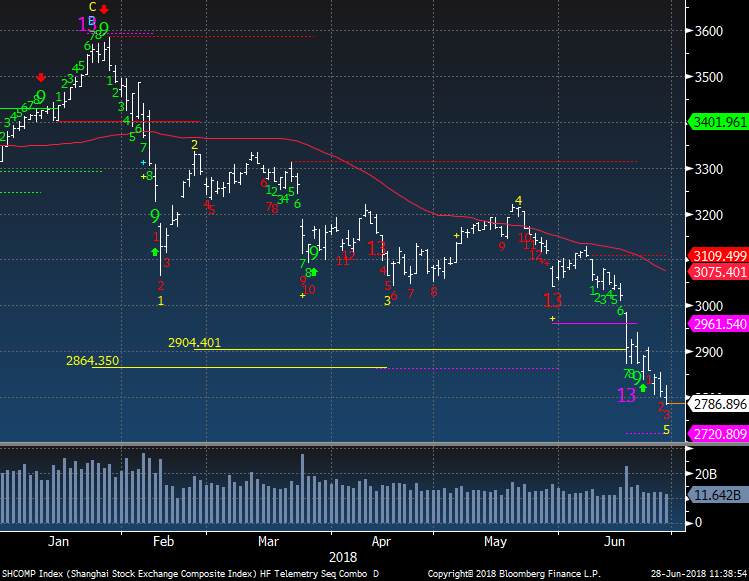
Shanghai has already dropped through the trap door
|
|
|
|
|
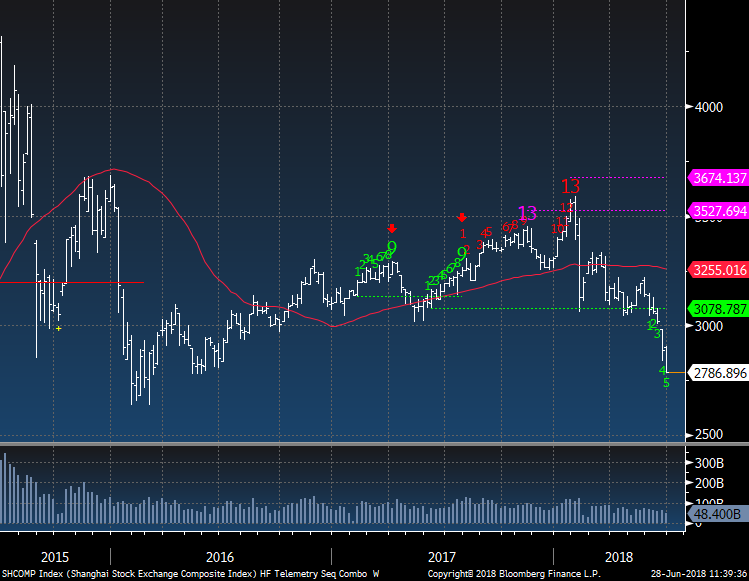
To better illustrate this the weekly clearly shows how it broke support
|
|
|
|
|
|
|
|
|
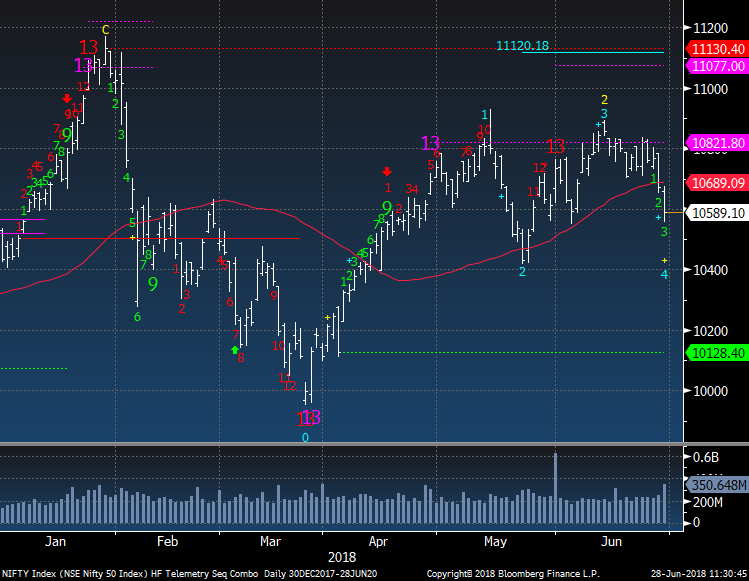
India's Nifty 50 broke under the 50 day and now has support at 10,400
|
|
|
|
|
|
|
Hedge Fund Telemetry Extend and Pretend Index
|
|
|
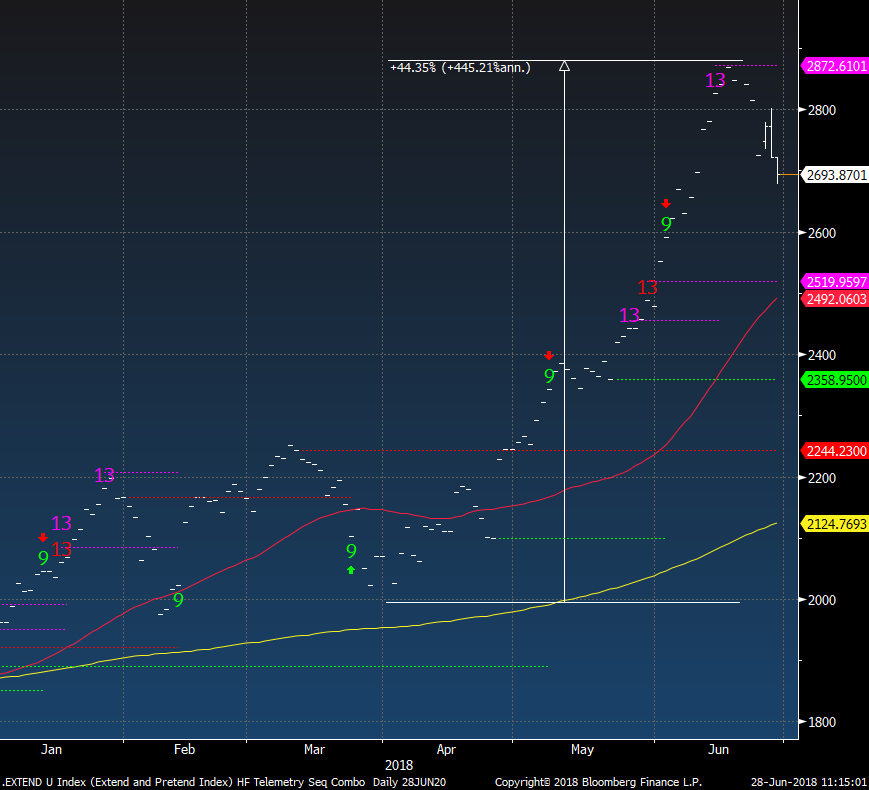
This 20 stock custom index has very extended stocks and is down another 1% today. Email me for the list
|
|
|
|
|
|
|
|
|
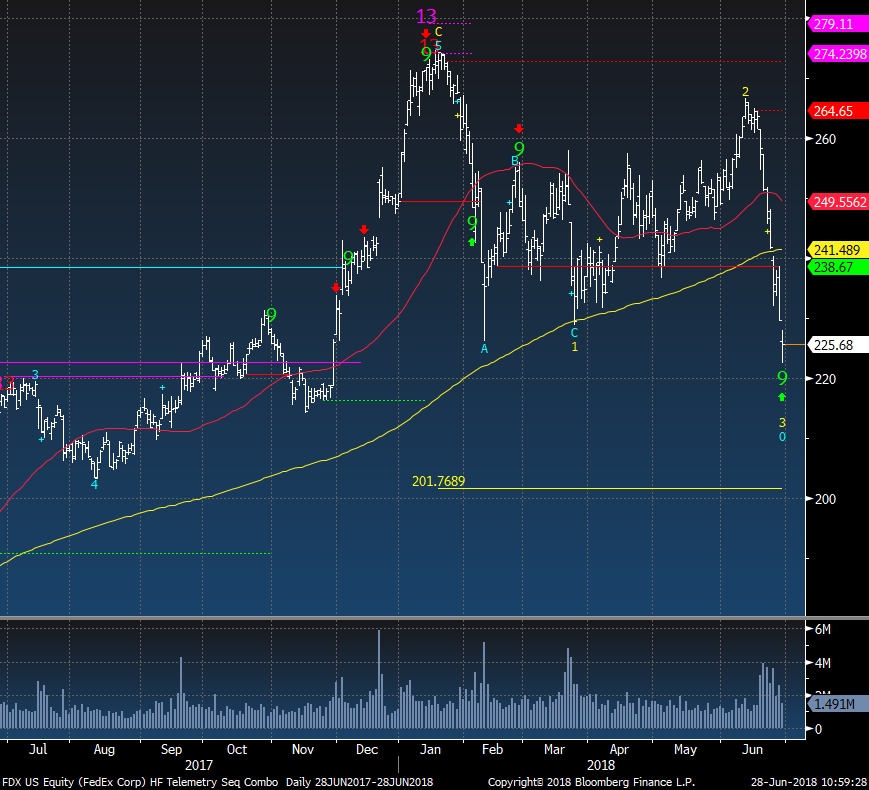
Fed Ex has dropped through the trap door and now is at a new 7 month low. It is make or break with the green Setup 9. I am holding the short in the Trade Ideas sheet for now
|
|
|
|
|
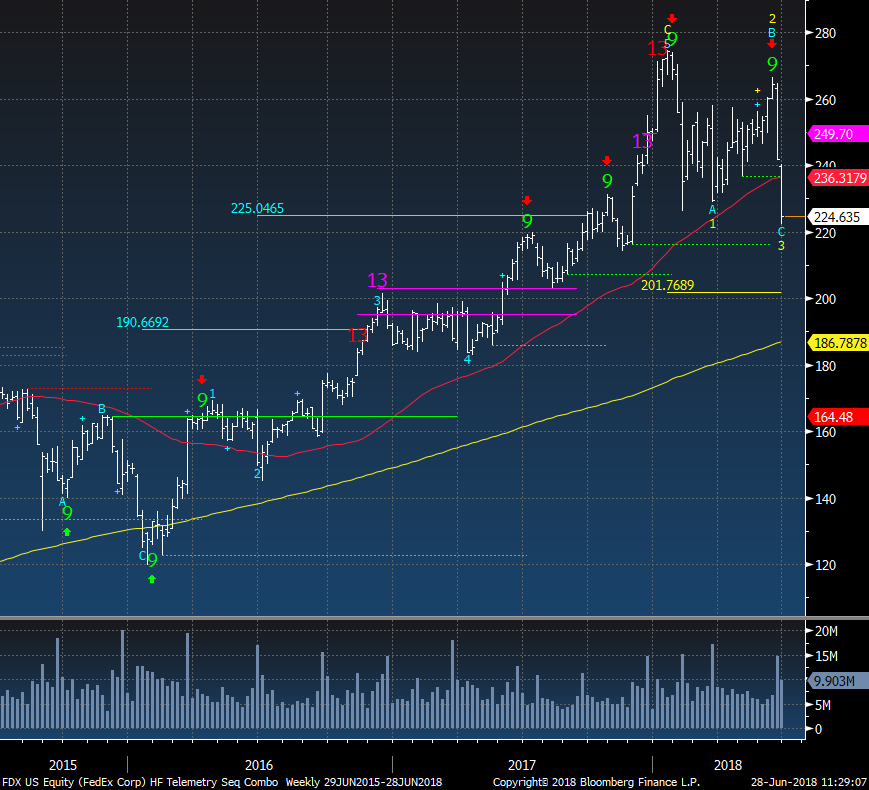
FDX weekly. No comment needed
|
|
|
|
|
|
|
Financials - New Short Ideas
|
|
|
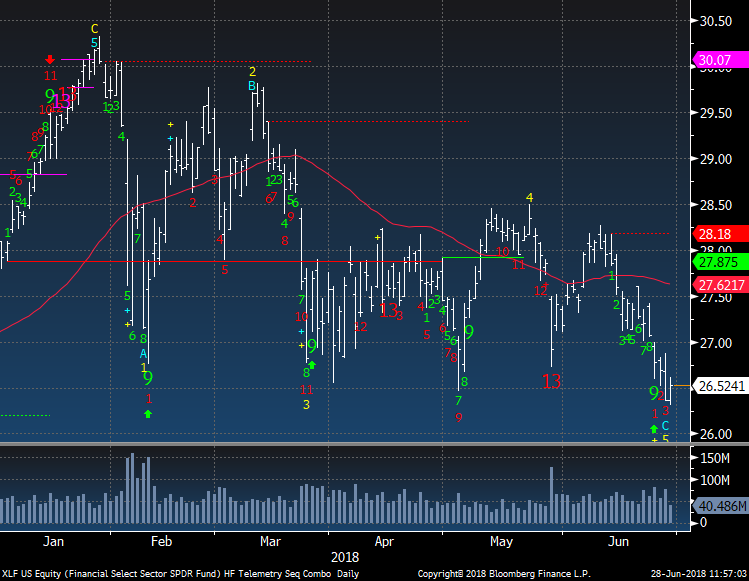
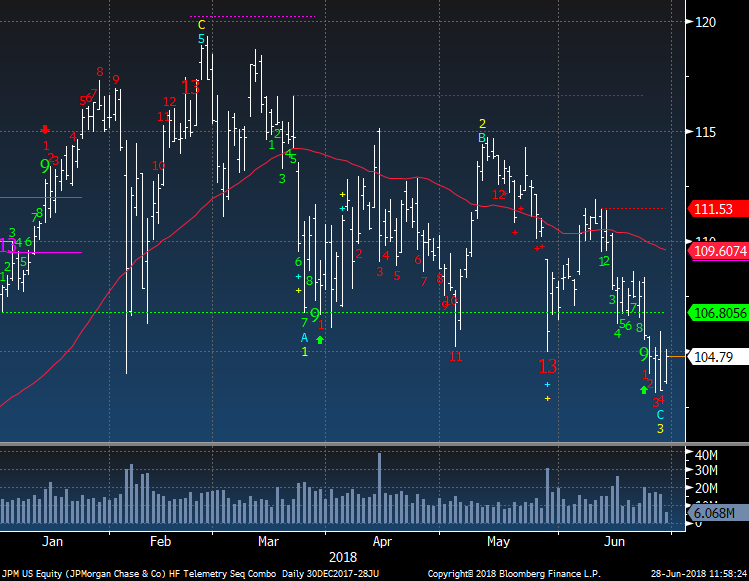
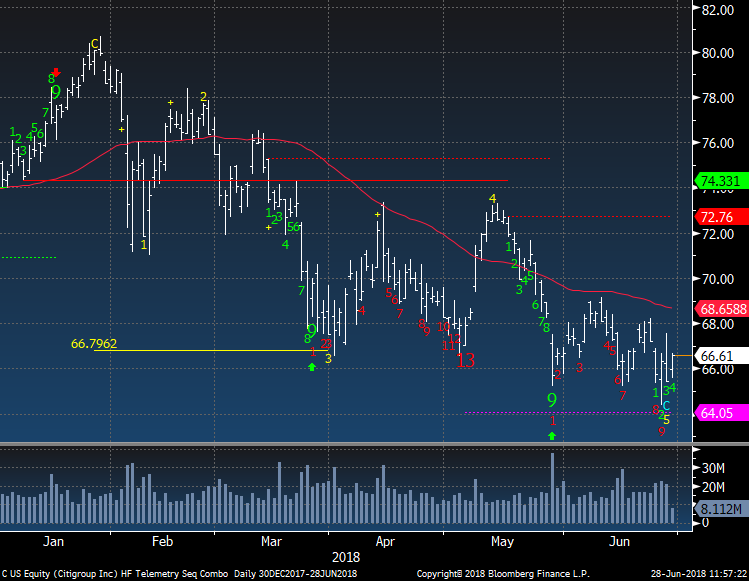
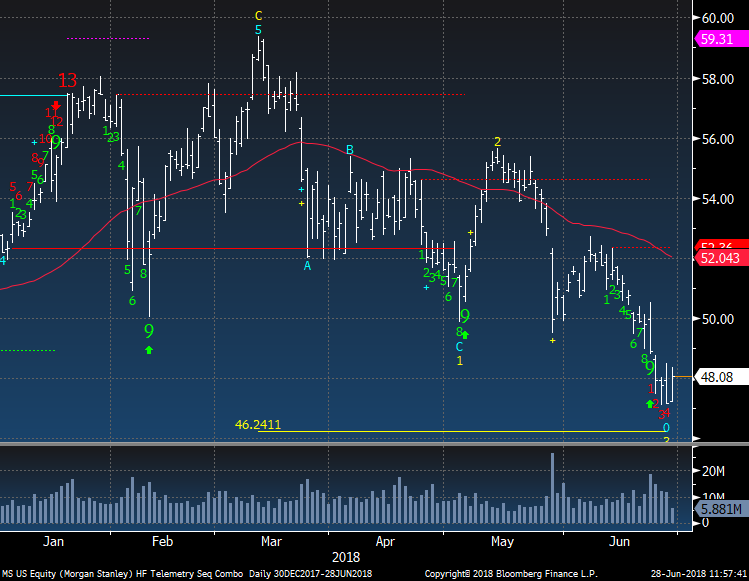
As you know, I have been off and on short financials this year and I added back today all 4 of the next charts of XLF, JPM, C, and MS. All of them have downside red Countdowns in progress and are bouncing today at support. This trade is a "press" as I am making a bet on the trap door ahead. And I do not believe there are many shorts involved here as these are crowded longs.
|
|
|
|
|
|
|
|
|
|
|
|
|
|
|
|
|
|
|
|
|
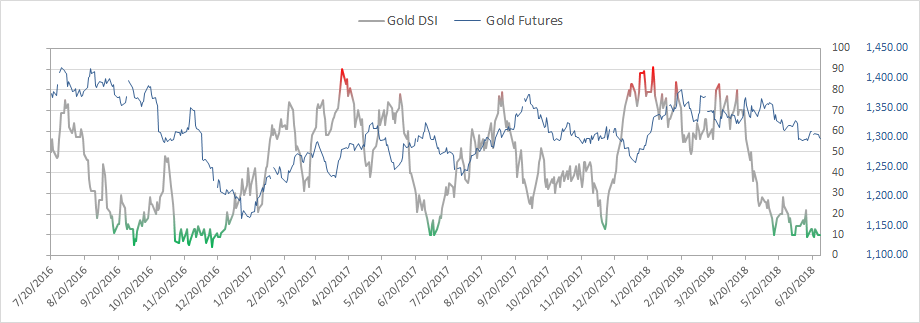
Gold bullish sentiment is at 10% for the 3rd day in a row
|
|
|
|
|
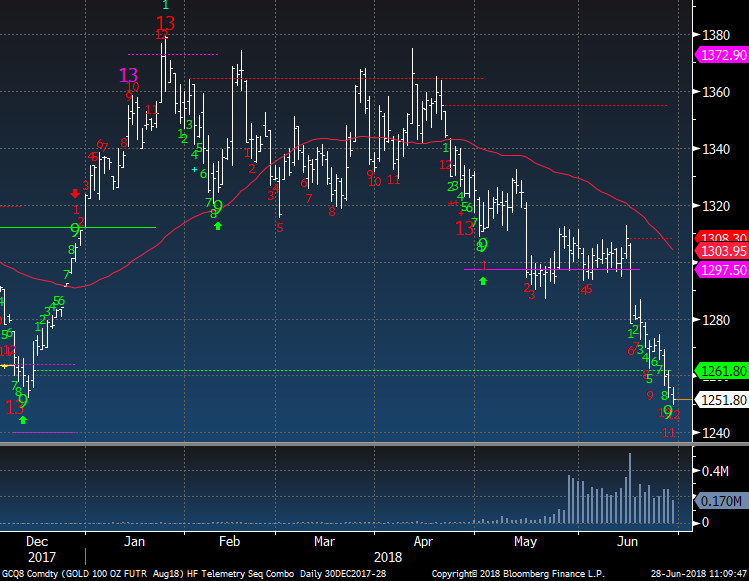
Gold Futures on day 12 of 13 with the downside Countdown. GLD did get the 13 the other day and I have been waiting for the futures to move in sync
|
|
|
|
|
Before we get too excited on Gold, the weekly is on week 3 of 13 with a downside Countdown. I am more inclined to be tight with stops due to this
|
|
|
|
|
|
|
|
|
Copper really dropped hard after the upside exhaustion and now is breaking lows with a downside Countdown on day 3 of 13.
|
|
|
|
|
|
|
|
|
USDCNH has a Countdown 13 today and a bounce is due but it will be a wave 4 that will follow with an even larger down move in the Yuan. (inverted)
|
|
|
|
|
|
|
|
|
FAANG custom index isn't making very convincing bounces
|
|
|
|
|
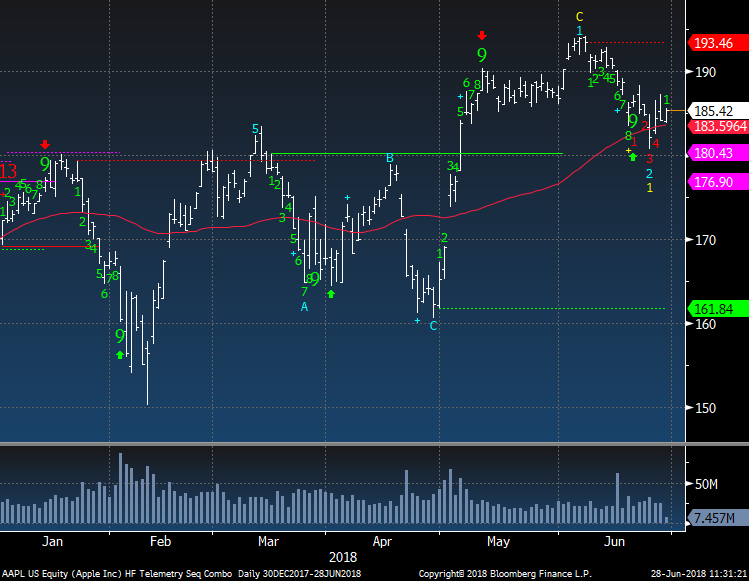
AAPL has a downside red Countdown on day 4 of 13. A bounce back to 190 is where I would short this if you're looking to do something here.
|
|
|
|
|
|
|
Crude and Energy Thoughts
|
|
|
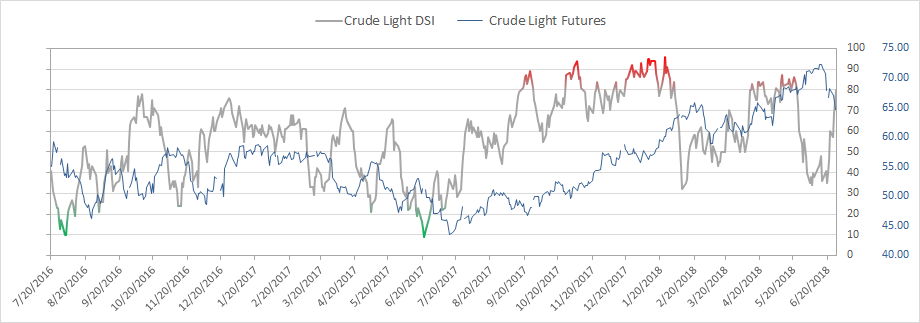
Crude bullish sentiment is at 80% and is now in extreme territory
|
|
|
|
|
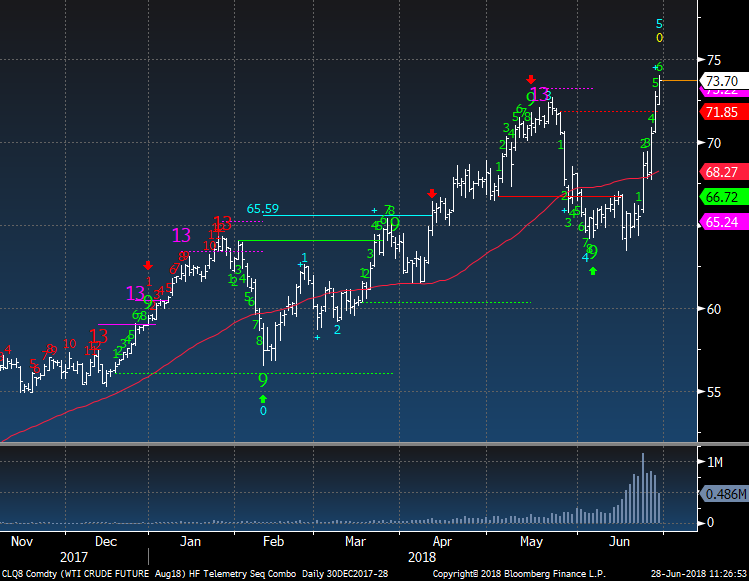
Crude has crashed to the upside. It will be interesting to see if the high sentiment slows this move
|
|
|
|
|
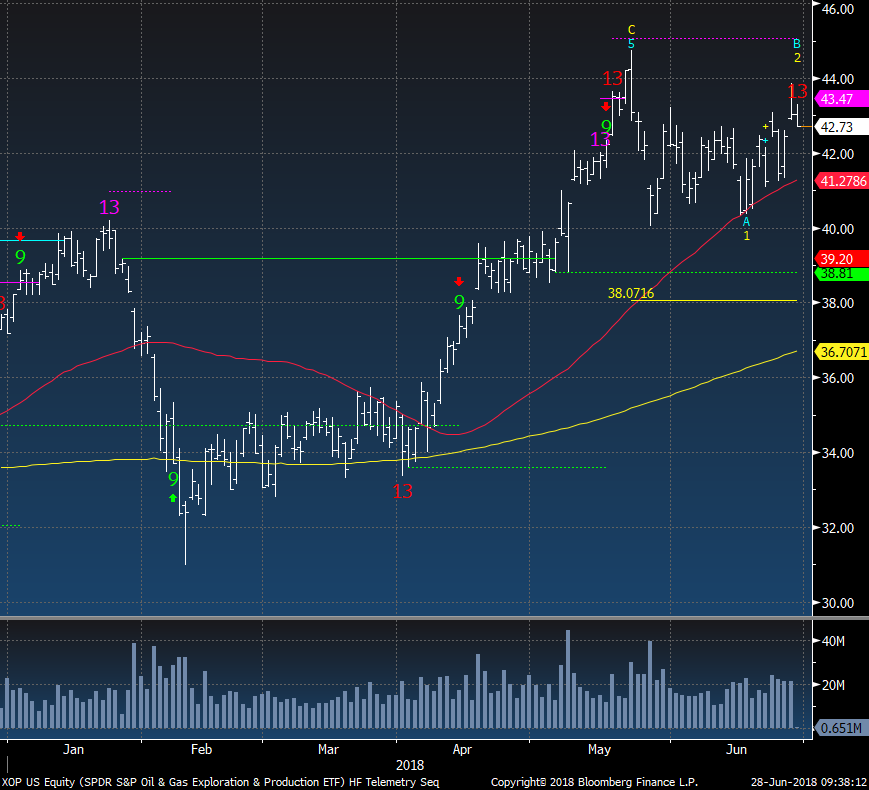
XOP Energy ETF did get the upside 13 exhaustion today as we have been anticipating.
|
|
|
|
|
|
|
|
|
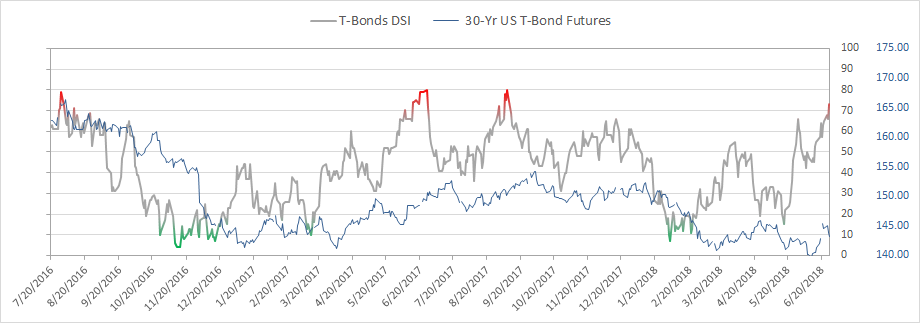
Bond bullish sentiment is at 73% and is becoming elevated. I could see this going over 90%
|
|
|
|
|
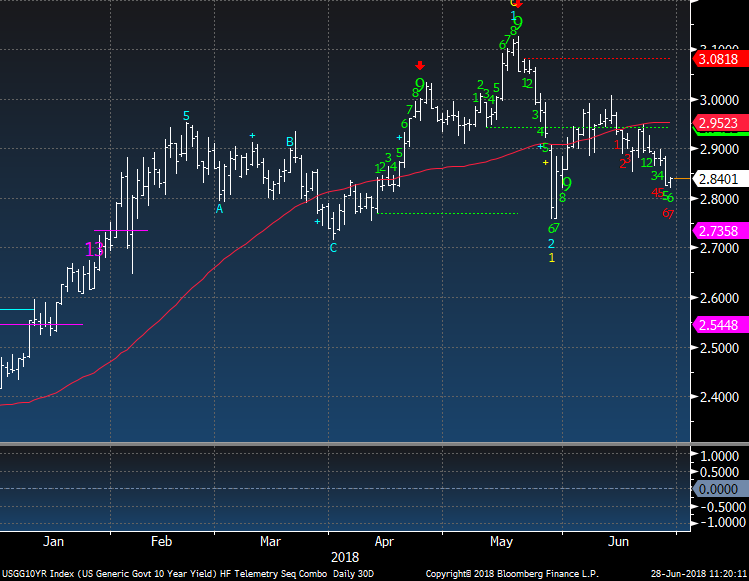
US 10 year yield has a downside red Countdown on day 7 of 13. Risk off
|
|
|
|
|
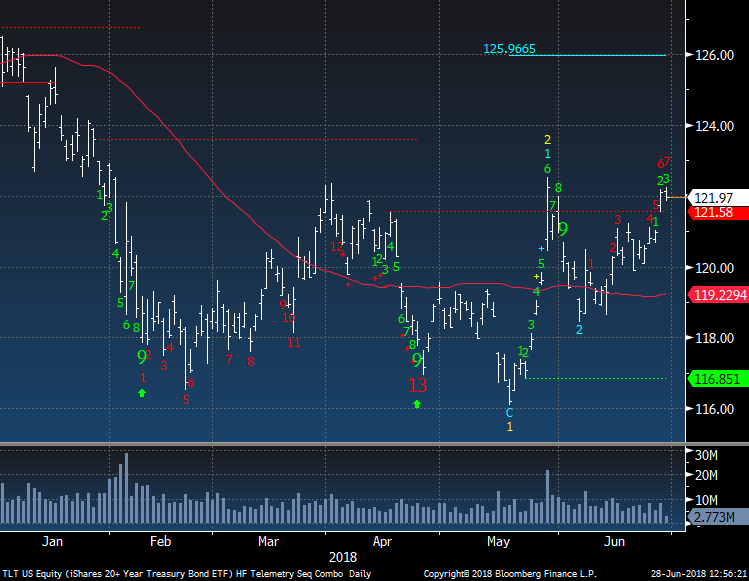
TLT Bond ETF is on day 7 of 13 with an upside Countdown.
|
|
|
|
|
|
|
DEMARK SCREENS - Daily, Weekly, Monthly Upside/Downside Exhaustion Signals
|
|
|
Daily/Weekly DeMark upside/downside exhaustion signals (Sequential) weekly updated on Monday's and monthly on the first day of the new month. Price flips occur when a stock closes higher/lower than four previous closes and increases conviction of a price turn.
The upside 13's are sell signals and downside 13's are buy signals. Price flip's are confirmation signals that increases potential for a price trend change. For example, if you are long a stock and there is an upside 13, you will want to take cautious action by selling down or out of a position. If initiating a short sale with the upside 13's, we tend to start with a 1/2 size and add with the downside price flip. The opposite is true for when there are downside 13's. Take a 1/2 size position
and add with the upside price flip. The DeMark Indicators are designed to assist the user with buying into weakness and selling into strength to anticipate trend exhaustion. Selling into a rally and buying into a decline often afford the opportunity to exit a trade without too serious a loss if wrong.
S&P 1500 Universe:
DAILY UPSIDE 13: DO, FF, PG
DAILY DOWNSIDE 13: BGG, FII, MSTR, TRV, WPP, XRX
DAILY UPSIDE WITH PRICE FLIP REVERSAL DOWN: DCOM, FRAN, GPS, LXP, SAM, SONC, VNO
DAILY DOWNSIDE WITH PRICE FLIP REVERSAL UP: ARRS, CB, HRS, XYL
Updated: 6/25/18
WEEKLY UPSIDE 13: BLKB, CRVL, GOOG, HMSY, IDXX, JCOM, MATX, NEE, NP, NWBI, PAYX, SHLM, TBI, VIVO
WEEKLY DOWNSIDE 13: CPWR, PRA
Updated: 6/4/18
MONTHLY UPSIDE
13: BJRI, IDA, NSP, PFS, PVH, SCSC, SYY, TSCO, VDSI, VLO
MONTHLY DOWNSIDE 13: CLW, LQDT
Euro Stoxx 600 Universe:
DAILY
UPSIDE 13: DSY FP
DAILY DOWNSIDE 13: AKZA NA, BPOST BB, JM SS, LHA GR, TEF SM, TOP DC
DAILY UPSIDE WITH PRICE FLIP REVERSAL DOWN: BOKA NA, COLR BB, RMV LN, SWEDA SS
DAILY DOWNSIDE WITH PRICE FLIP REVERSAL UP: AKZA NA, HUH1V FH, WTB LN
Updated: 6/25/18
WEEKLY UPSIDE 13: EDF FP, INF LN, MTX GR, OCDO LN, SCHA NO
WEEKLY DOWNSIDE 13: LRE LN, MAESKB DC
Updated: 6/4/18
MONTHLY UPSIDE 13: ADS GR, AMEAS FH, AV/ LN, BVS LN, DG FP, HELN SW, HLMA LN, ITRK LN, LEG GR, NESTE FH
MONTHLY DOWNSIDE 13: NONE
|
|
|
Unsubscribe me from Hedge Fund Telemetry
Hedge Fund Telemetry LLC, P.O. Box 4675, Greenwich, CT 06861, United States
CONFIDENTIALITY NOTE and DISCLAIMER: This message is for the named person's use only. It may contain confidential, proprietary or legally privileged material. No confidentiality or privilege is waived by any accidental or unintentional transmission. If you receive this message in error, please immediately delete it and all copies of it from your system, destroy any hard copies and notify the sender. You must not, directly or indirectly, use, disclose,
distribute, print or copy any part of this message if you are not the intended recipient. Hedge Fund Telemetry LLC. cannot guarantee the confidentiality of the material transmitted; therefore, information of a sensitive or confidential nature should not be transmitted. There is risk in trading markets. Hedge Fund Telemetry LLC reports are based on information gathered from various sources and believed to be reliable, but are not guaranteed as to accuracy and completeness. The information is subject to change without notice and Hedge Fund Telemetry LLC has no obligation to provide any updates or changes. Hedge Fund Telemetry LLC is providing this data for informational and educational purposes and does not believe that it is sufficient to base an investment decision on. This information should not be regarded as a solicitation or recommendation of any particular security or to engage in any trading strategy. One should always check with your licensed financial
advisor to determine suitability of any investments.
|
|
|
|
|