|
|
|
|
|
|
Caution signs I've seen before and am seeing now
|
|
|
Sorry for the late note today. Just got jammed with a few client conference calls. Yes I do calls with clients and often with video so you can see my screens live.
I continue to see caution signs that make me quite concerned with global markets. And quite the reversal today too. I will discuss some on today's note and more in the coming days. Let's get to it...
Notable:
- US Markets - Sentiment under 50%. Green Setup 9's could be support or new Countdowns could start soon. Seasonality is a little choppy and stressful
- Hedge Fund Telemetry Trade Ideas - PG, OXY and BRK/B removed, NVDA added
- Credit Spread Update - Keep an eye on these in the coming days
- Currencies - Continuation with USD
up, Euro down, Yuan down (risk here)
- Asian Update - More breakdowns
- Gold Update - Still some risk as not everything has lined up but enough to have a small long
- Crude and Energy Update - XOP is on day 12/13 so careful with false breakout
- Global Index and EEM Update
- Hedge Fund Telemetry Extend and Pretend Index - Downside ahead
- Cumulative Breadth -
Rolling over like it did in January
- PG - Take Profits
- Financials at Risk?
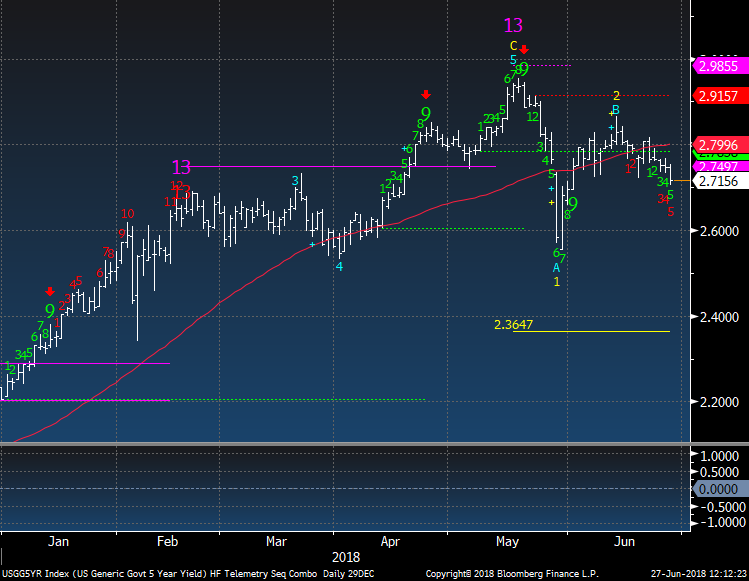
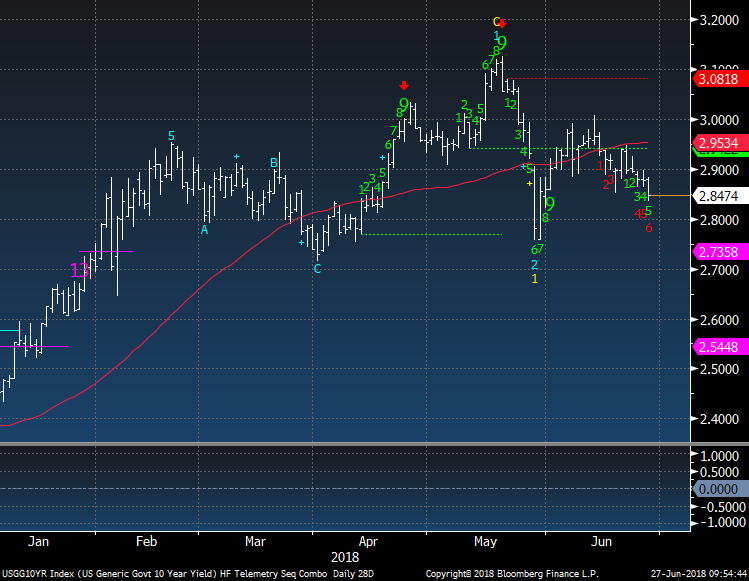
- Bond Update - 5 and 10 year yields look lower with favorable seasonality too
- DeMark Screens - Daily, Weekly, Monthly upside/downside exhaustion signals within the S&P 1500 and Euro Stoxx 600
|
|
|
|
|
|
|
Here's a link to the Hedge Fund Telemetry market sentiment page with 40 charts of sentiment including equities, bonds, currencies, and commodities updated each day.
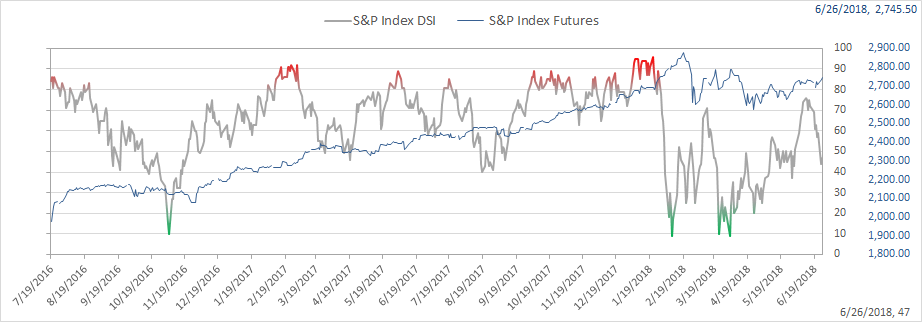
SPX bullish sentiment is at 47% and below the 50% mid point. Yesterday's bounce in the market didn't get sentiment moving up much
|
|
|
|
|
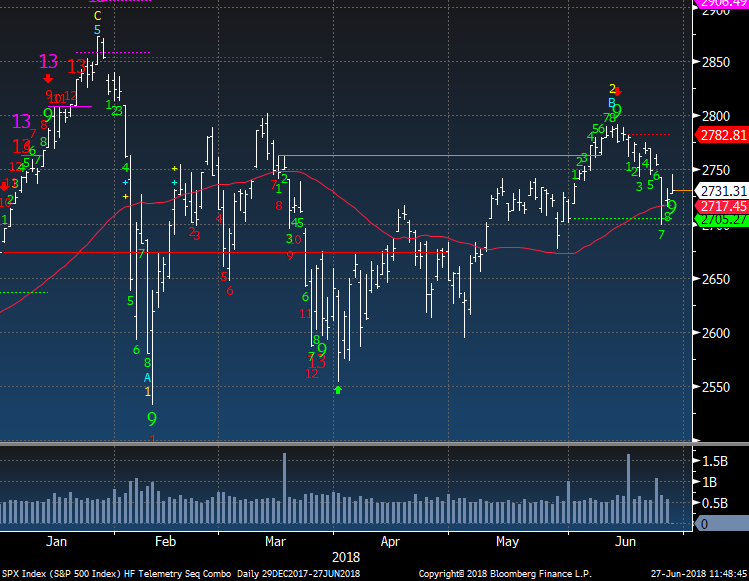
SPX cash index does a couple potential positives. First the green Setup 9 could see a bounce and the 2705 green dotted TDST line worked as support. The risk is that now that we have the green Setup 9 a new red Countdown could start. For info on how the Sequential, Setup and other DeMark Indicators here's the DeMark Primer of the basics
|
|
|
|
|
S&P Seasonality gets tougher in the coming quarter
|
|
|
|
|
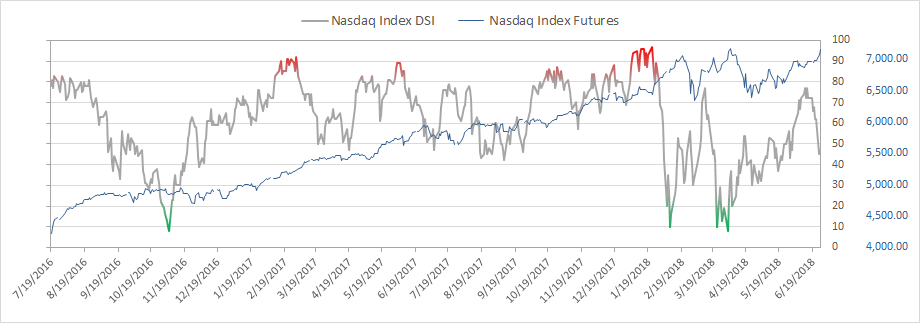
Nasdaq bullish sentiment is at 47%
|
|
|
|
|
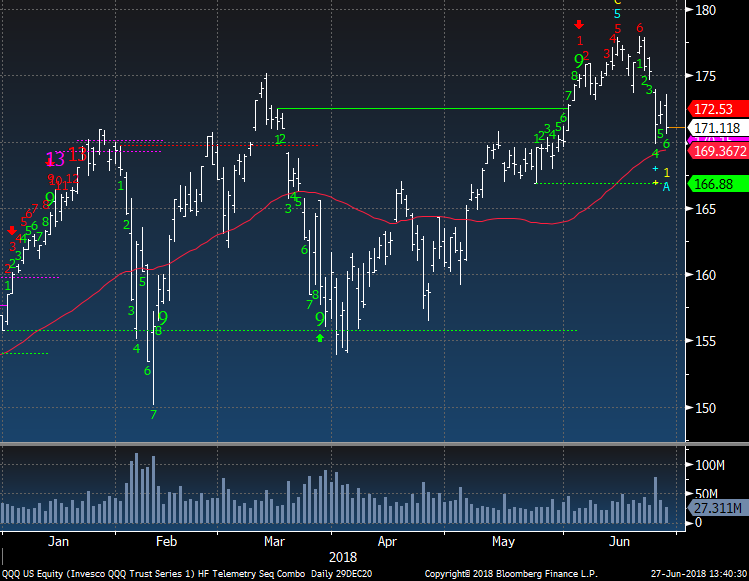
QQQ does have an upside pending red Countdown on day 6 of 13 however this could be cancelled if the green downside Setup 9 completes. This would take 3 more down days with closes lower than 4 previous closes - again hit the DeMark Primer for how cancellation happens
|
|
|
|
|
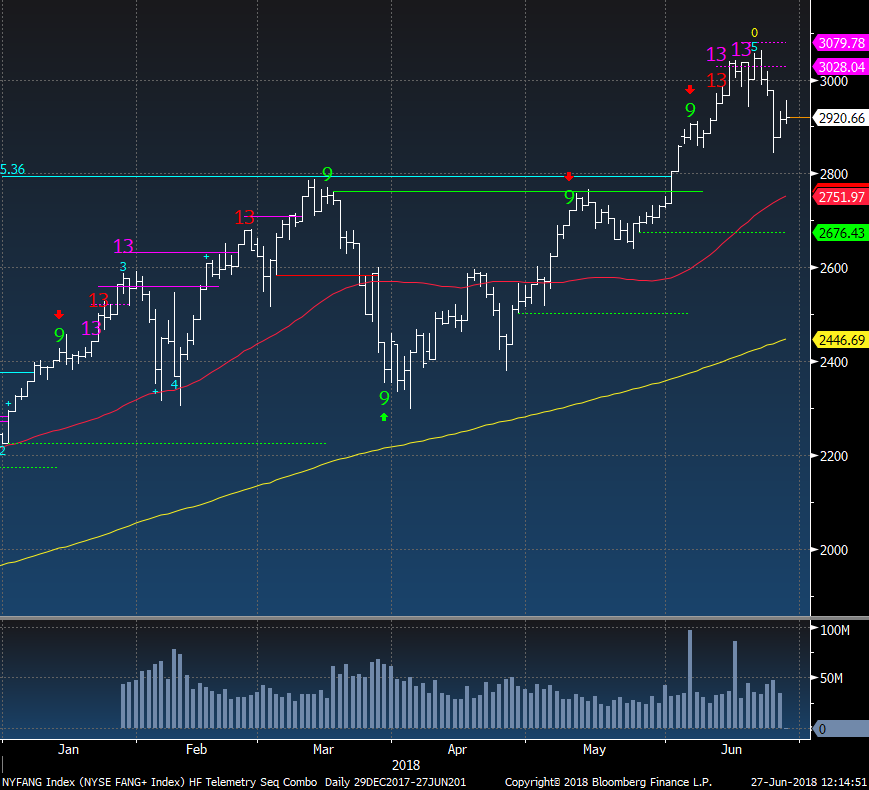
FANG+ did have the recent upside exhaustion signals and now it's rolling over but a long way from the 50 day so there's some runway before support
|
|
|
|
|
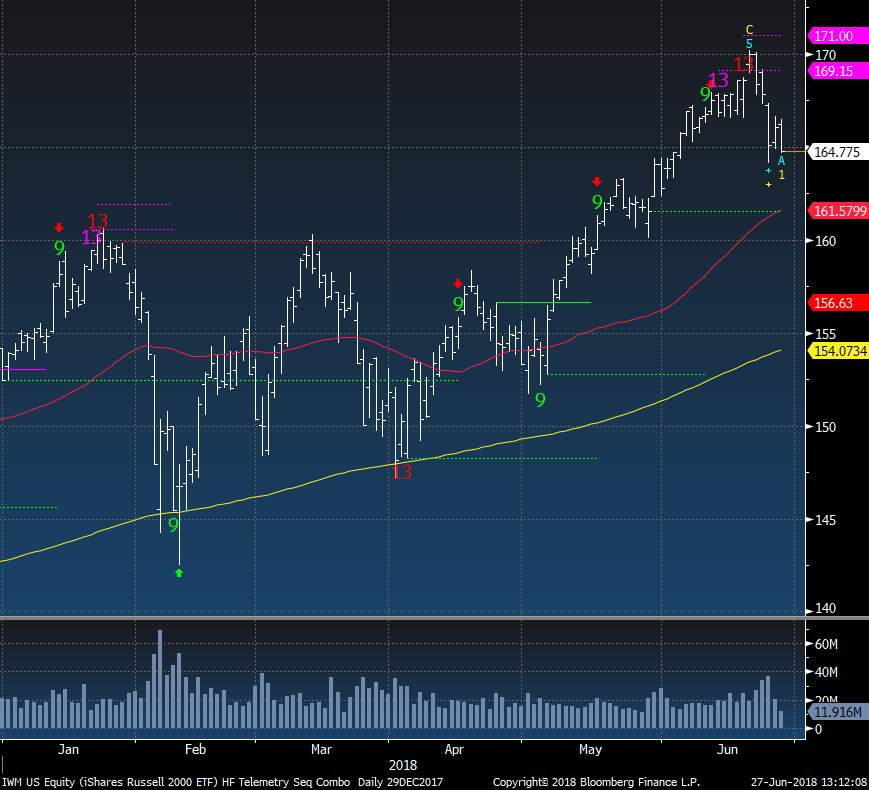
IWM Russell 2000 ETF also had some upside exhaustion and is rolling over. For an index "immune" to China tariff's it's not acting so great.
|
|
|
|
|
|
|
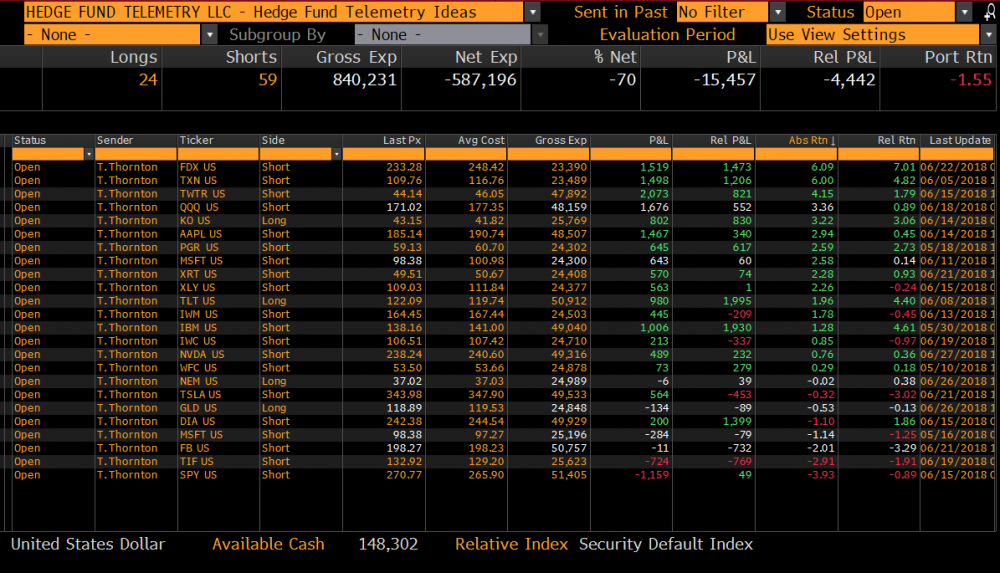
Hedge Fund Telemetry Trade Ideas
|
|
|
Trade Ideas - Removed BRK/B short +2%, PG long +6.5%, OXY -1.4% Added to NVDA short. added to cash
|
|
|
|
|
|
|
|
|
Some people look at basic spreads of JNK vs TLT and it is widening and if this continues people's alarm bells will start to go off.
|
|
|
|
|
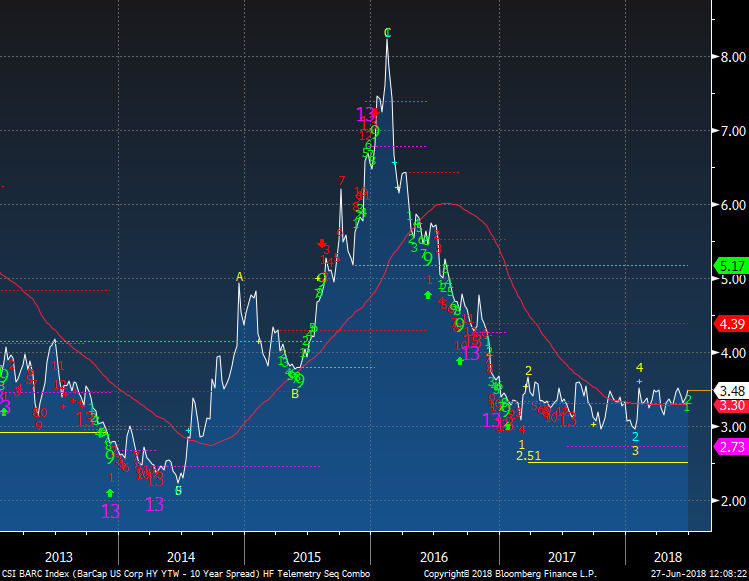
For more seasoned pros this is the spread we watch. Barclays High Yield vs US 10 Year. This is the weekly and it's likely to see a breakout soon. (Spread widening)
|
|
|
|
|
|
|
|
|
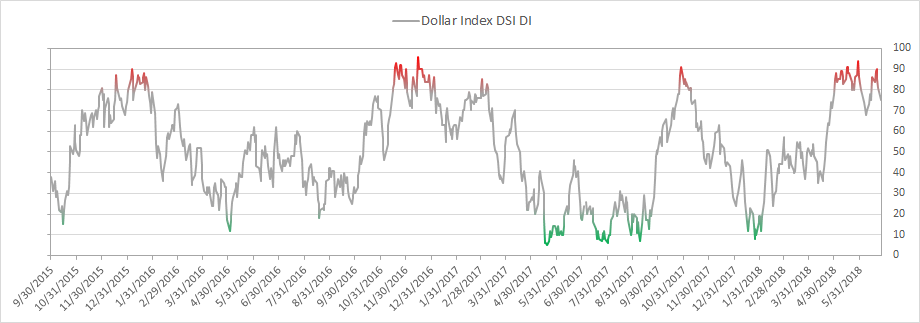
US Dollar bullish sentiment is at 78% and should see a lift on today's poll
|
|
|
|
|
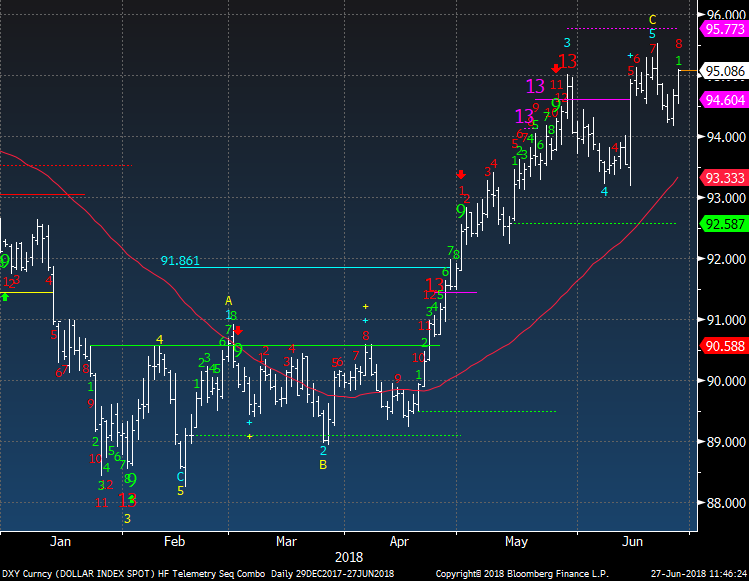
US Dollar Index is now on day 8 of 13 with a red upside Sequential Countdown. The wave 5 upside target is at 98. Alarm bells will be ringing there
|
|
|
|
|
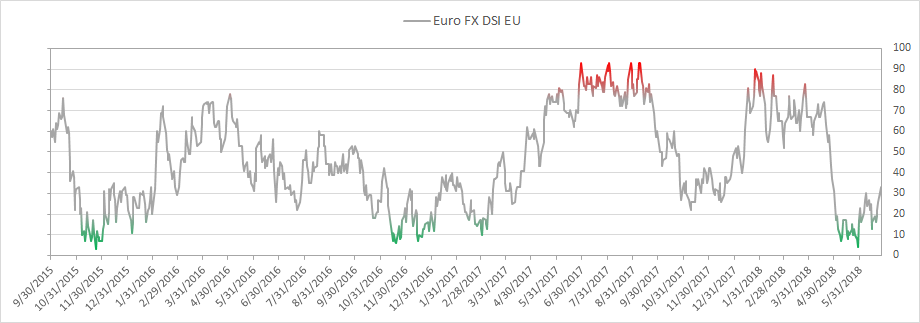
Euro bullish sentiment is at 26% and down from previous high of 33%
|
|
|
|
|
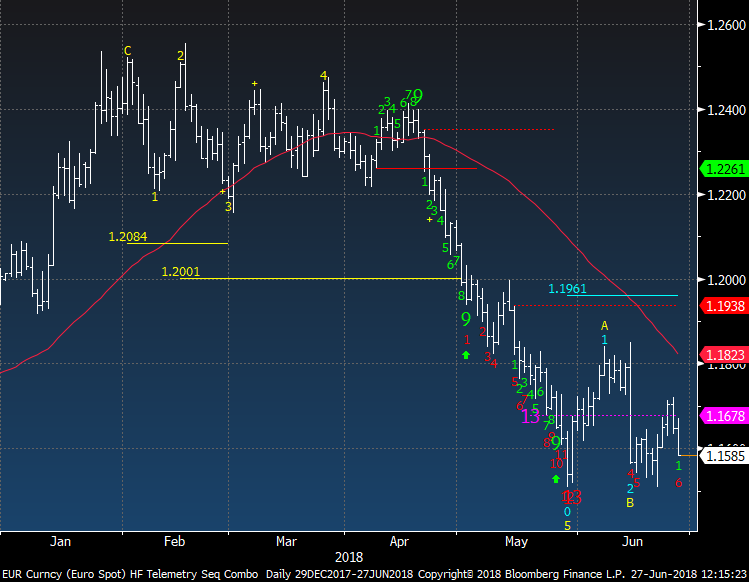
Euro spot is now on day 6 of 13 with a downside Countdown
|
|
|
|
|
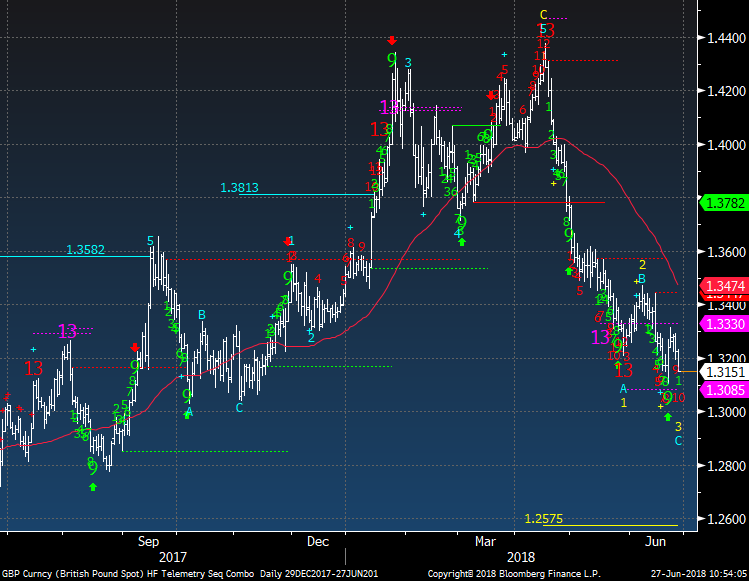
GBP British Pound is on day 10 of 13 with its Countdown and has a wave 3 downside price objective of 1.2575.
|
|
|
|
|
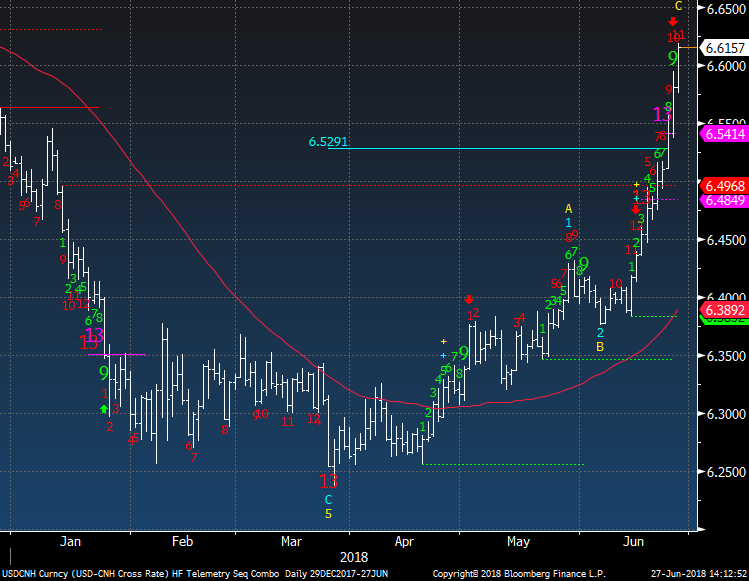
Chinese Yuan continues to drop vs USD and this type of action is very concerning for global markets
|
|
|
|
|
|
|
|
|
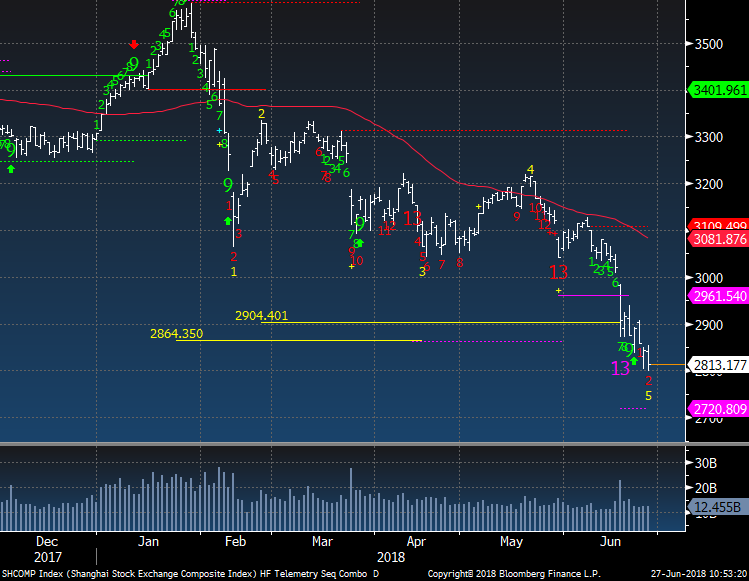
Shanghai breaking lower and is on day 2 of 13 with a downside Countdown
|
|
|
|
|
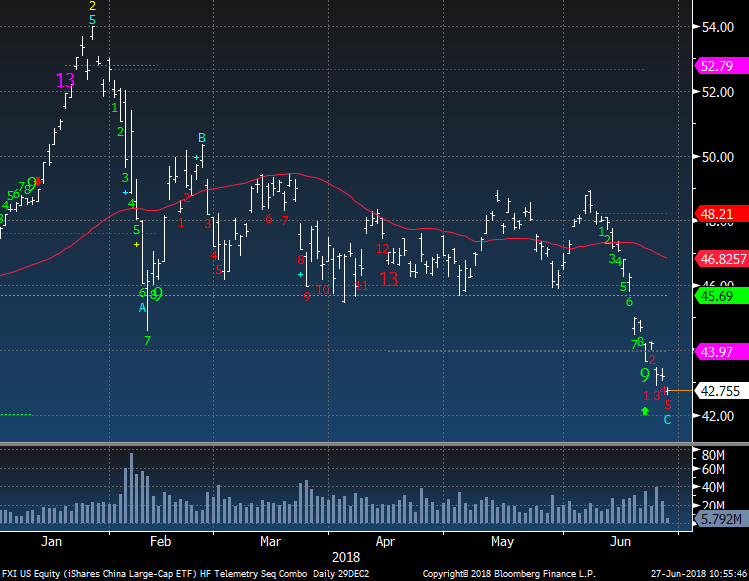
FXI Hong Kong China ETF breaking and is on day 5 of 13.
|
|
|
|
|
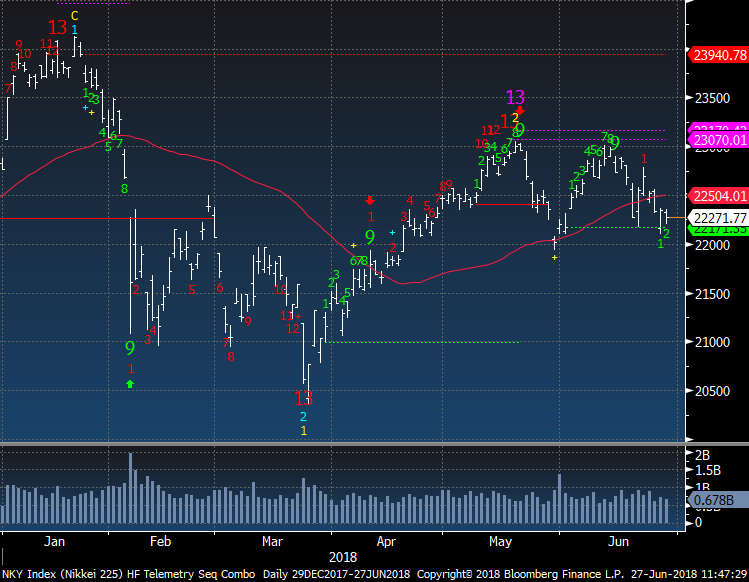
Nikkei has support at 22,000. I expect it to break and there is an air pocket below
|
|
|
|
|
|
|
|
|
Gold bullish sentiment is at 10%
|
|
|
|
|
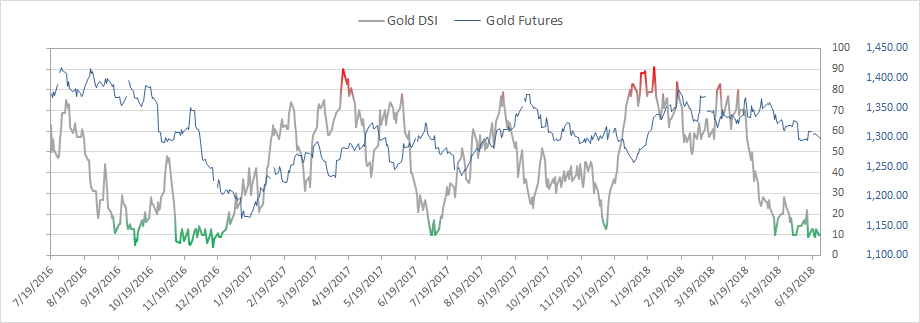
Gold seasonality should see a bottom in July and a move higher into late Q3. Still some potential weakness
|
|
|
|
|
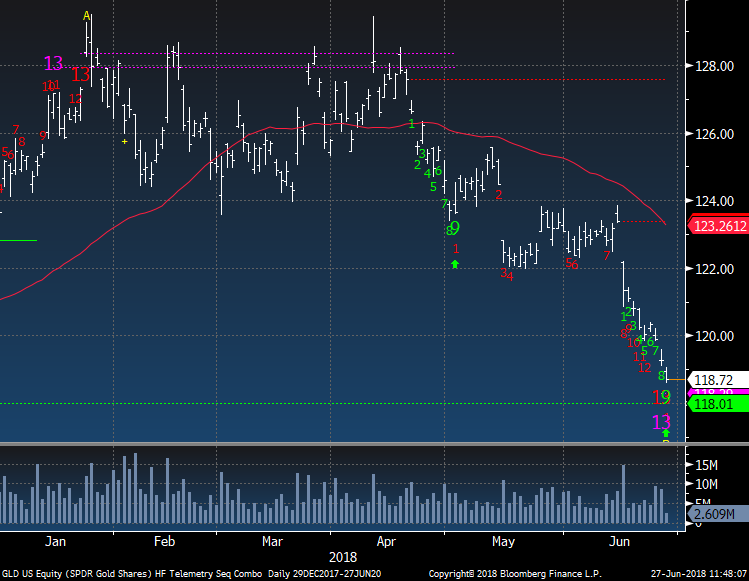
GLD did get the downside exhaustion signals and I started a small long position in GLD. I'm not overly confident until..
|
|
|
|
|
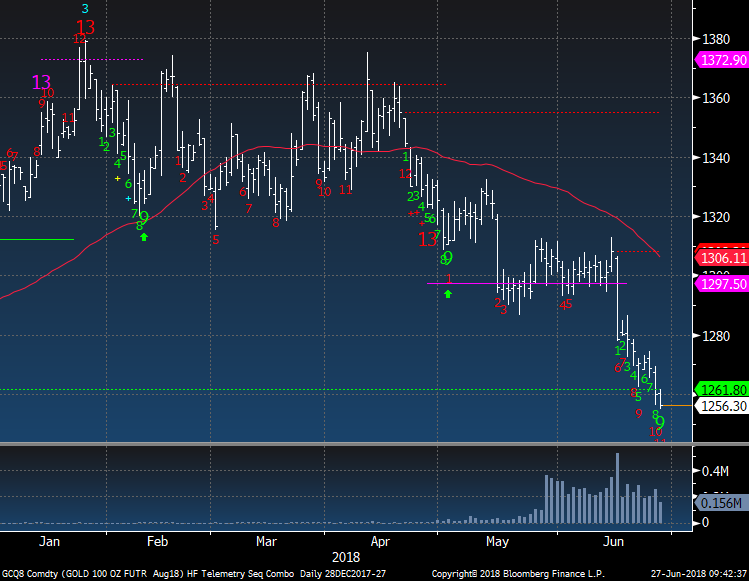
Gold Futures needs to fully exhaust on the downside and it's on day 11 of 13. I will add when there is a price flip up when it trades above the high of 4 previous days
|
|
|
|
|
|
|
|
|
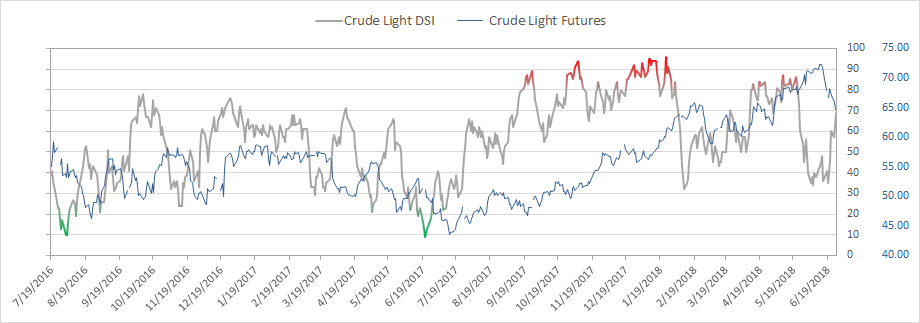
Crude bullish sentiment is at 69% and really has moved quickly from 7 days ago when it was 35%
|
|
|
|
|
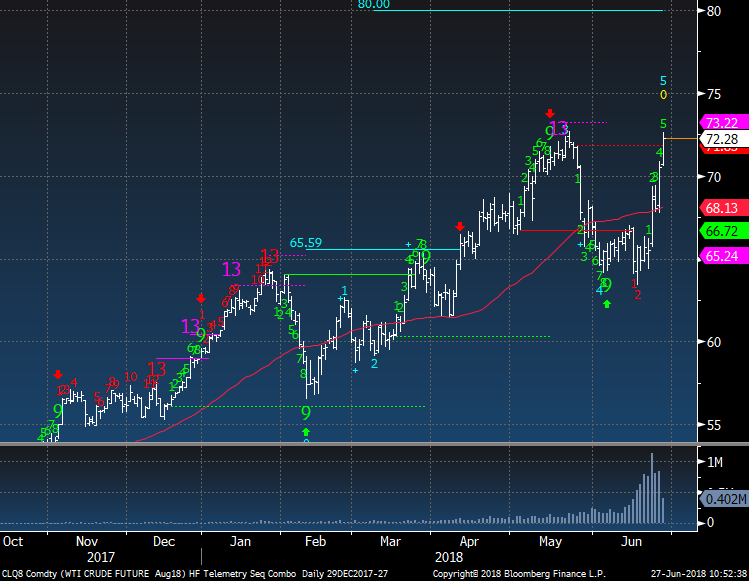
WTI Crude has moved higher negating the downside wave pattern and now it's reverted back into the 5th wave and could go for the 80.00 price objective.
|
|
|
|
|
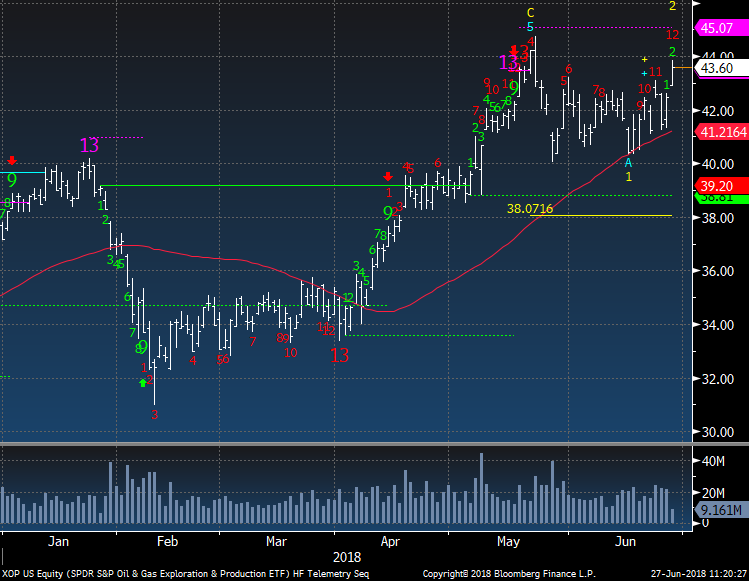
XOP Energy ETF has held in better than other energy stock ETF's but it is now on day 12 of 13 so be cautious thinking this is a breakout worth buying here.
|
|
|
|
|
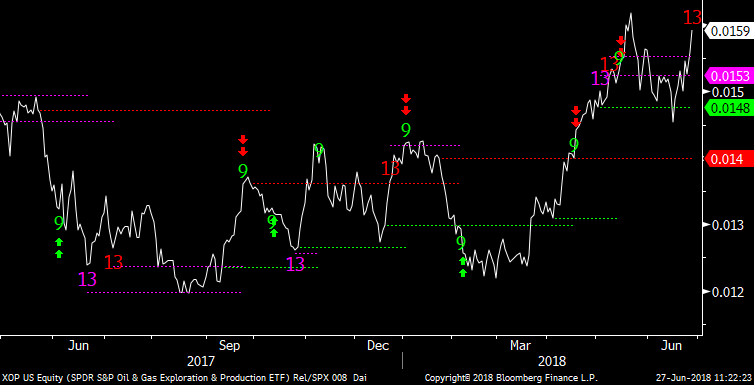
XOP vs SPX ratio on a daily time frame has an upside exhaustion 13 too and perhaps this is an early warning indicator
|
|
|
|
|
|
|
Vanguard Total International and EEM
|
|
|
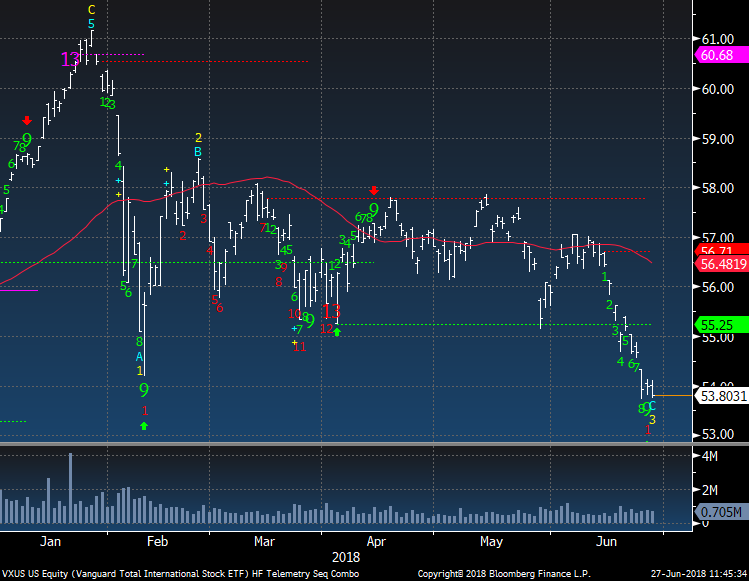
This doesn't look so good making new 2018 lows
|
|
|
|
|
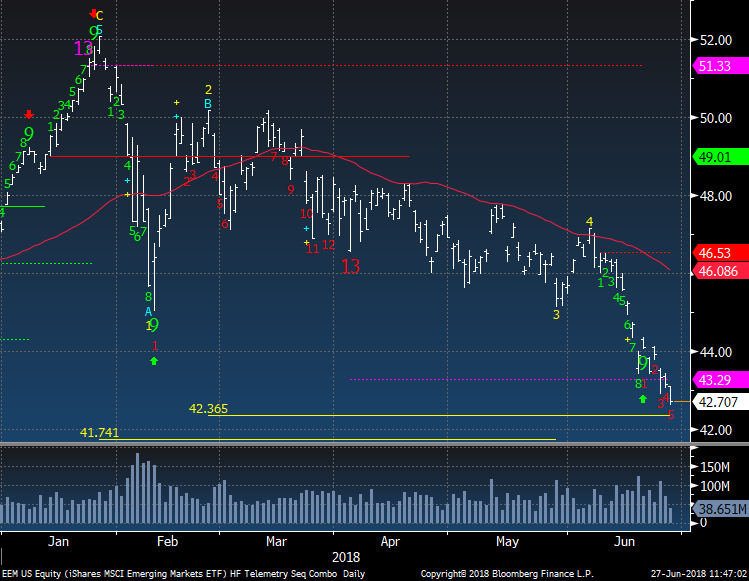
EEM Emerging Markets continues lower and is on day 6 of 13 with a downside Countdown. I have been negative on this from January. It is nearing the downside wave 5 price objective so perhaps when the USD makes a top this will bounce too. But from what level?
|
|
|
|
|
|
|
Hedge Fund Telemetry Extend and Pretend Index
|
|
|
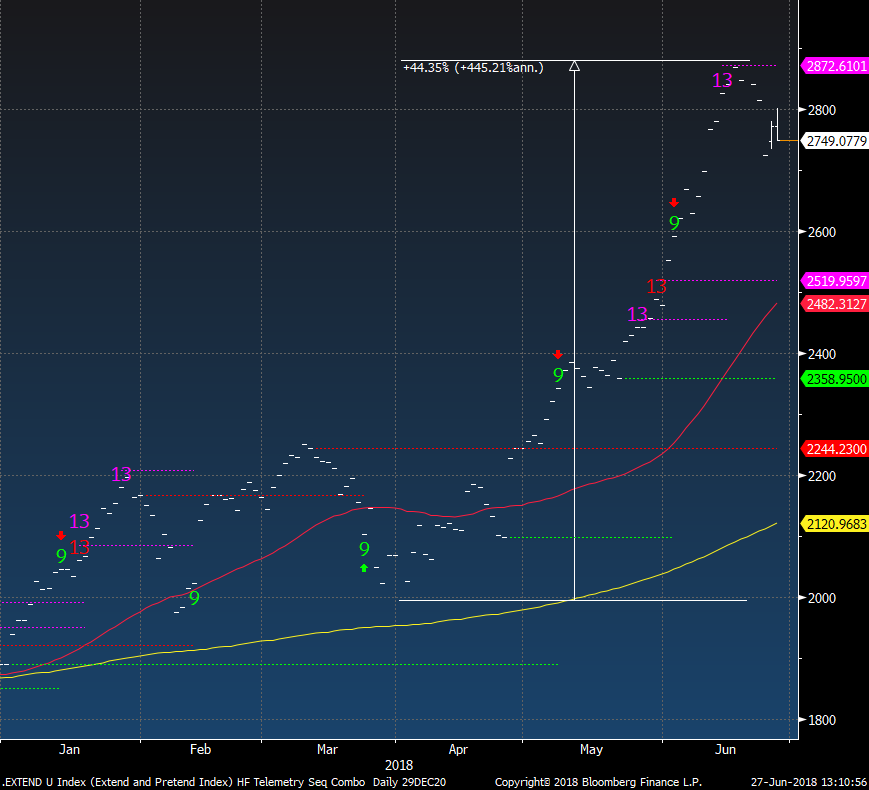
This custom index of the most overbought US stocks (20 of them and email me if you need the list). This has real downside risk
|
|
|
|
|
|
|
|
|
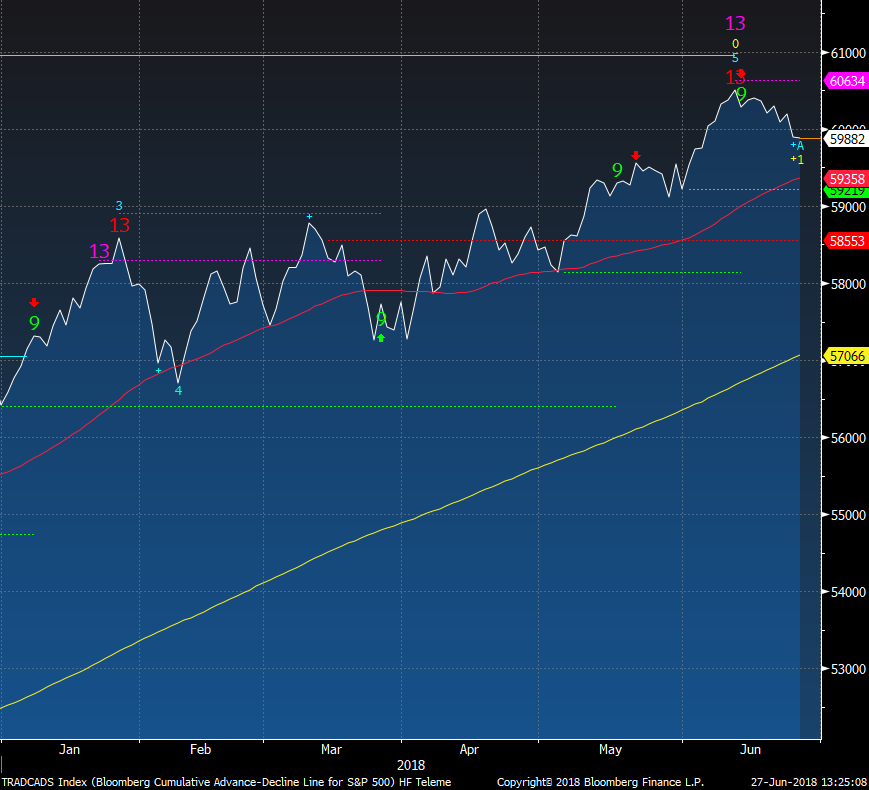
S&P cumulative breadth has some upside exhaustion signals at the peak (like in January) and is rolling over
|
|
|
|
|
|
|
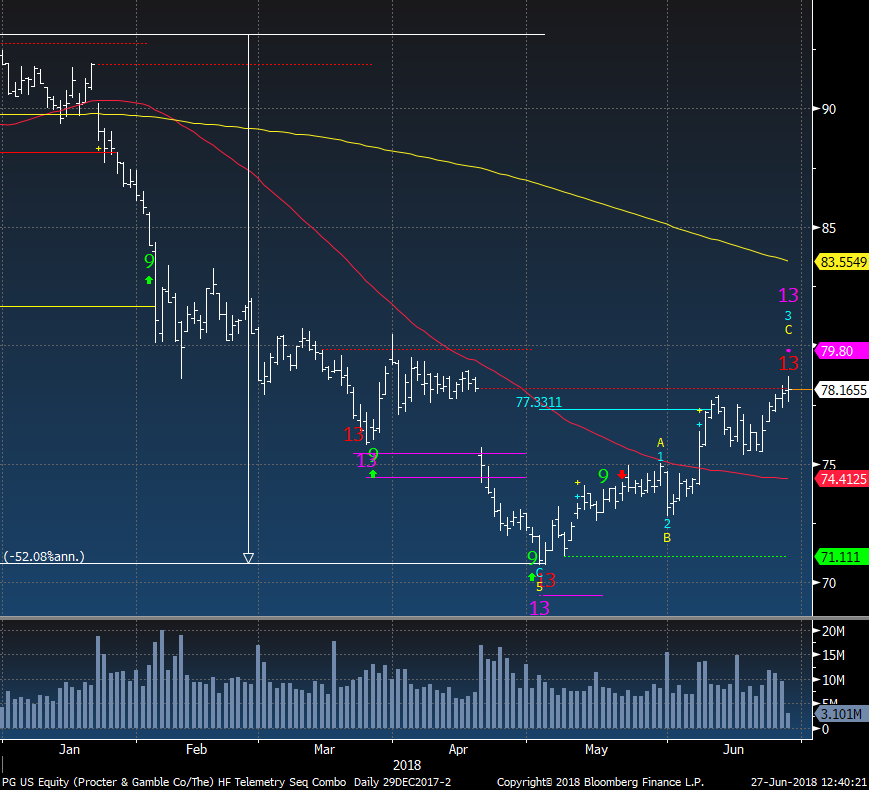
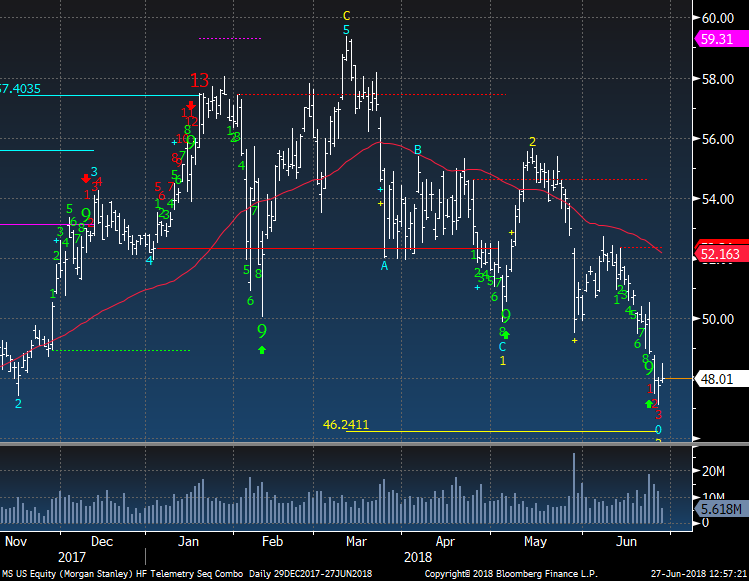
Proctor and Gamble - Take profits
|
|
|
PG did it's job and we went 13 to 13 on this and I removed it from the long side on the Trade Ideas sheet
|
|
|
|
|
|
|
|
|
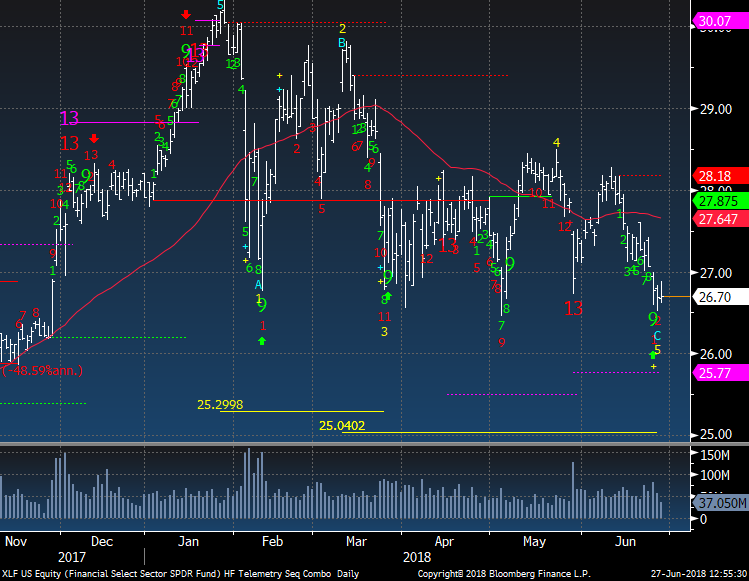
XLF Financials ETF trades terrible at support seen all year. There is a new downside red Countdown on day 2 of 13. I believe this is day 13 in a row down. That doesn't mean it has to bounce. When stocks get oversold like this and then break, it's a crash. Tomorrow night the second part of the stress test comes out and it is a little tougher than the first one.
|
|
|
|
|
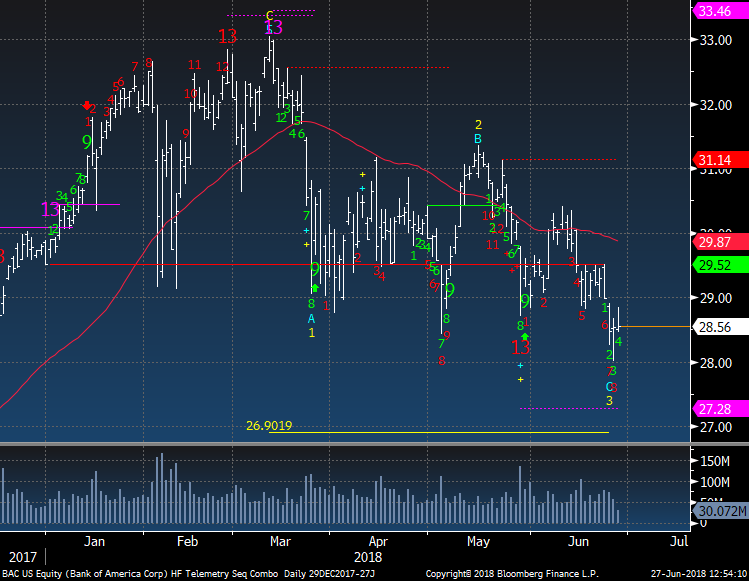
Bank of America is on day 8 of 13 with a downside Countdown
|
|
|
|
|
|
|
|
|
|
|
|
|
|
|
|
|
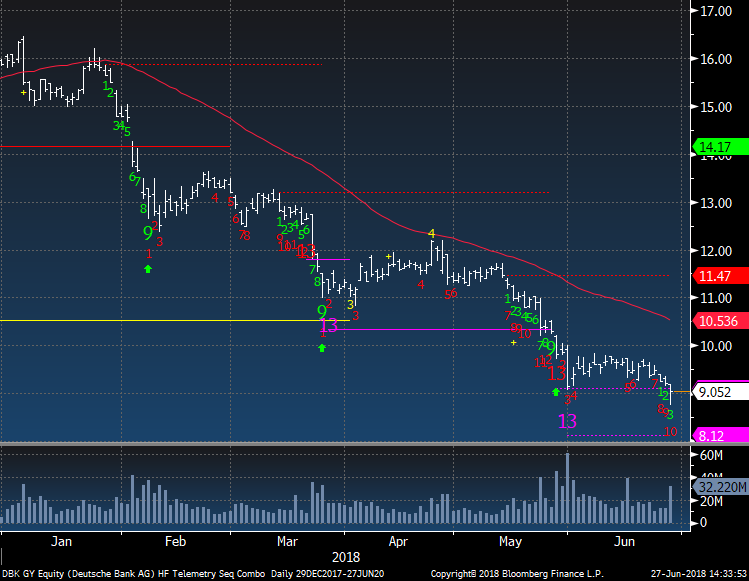
Deutsche Bank has ignored downside exhaustion signals and when that happens it is telling you that trend is very very strong.
|
|
|
|
|
|
|
|
|
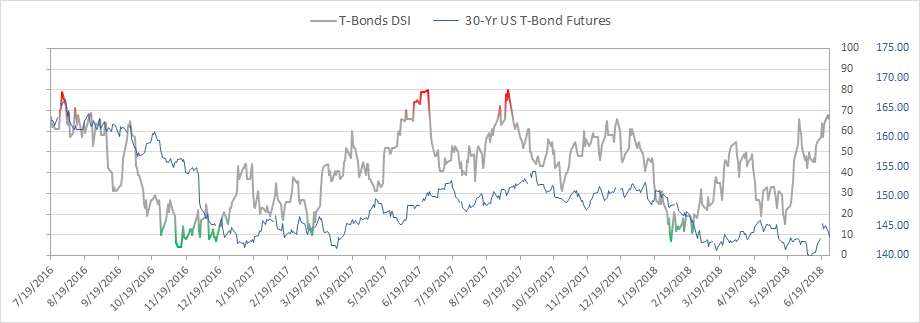
Bond bullish sentiment is at 66% and I expect higher sentiment and potentially really high sentiment
|
|
|
|
|
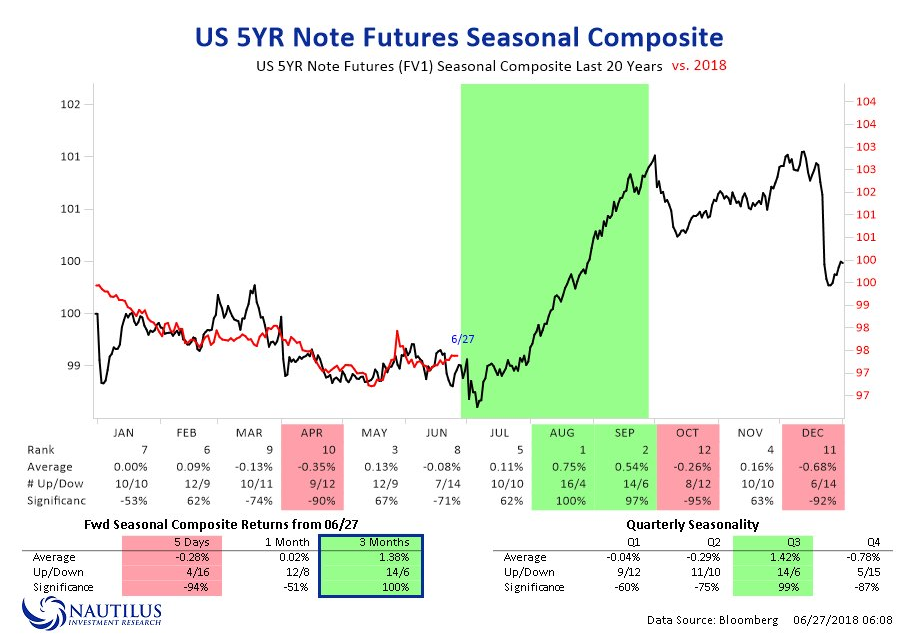
My friends at Nautilus Research put out seasonality of the 5 year and considering it has been a terrible year for bonds this should work out pretty well
|
|
|
|
|
5 year is on day 5 of of 13. This is risk off type of behavior by some big players
|
|
|
|
|
|
|
|
|
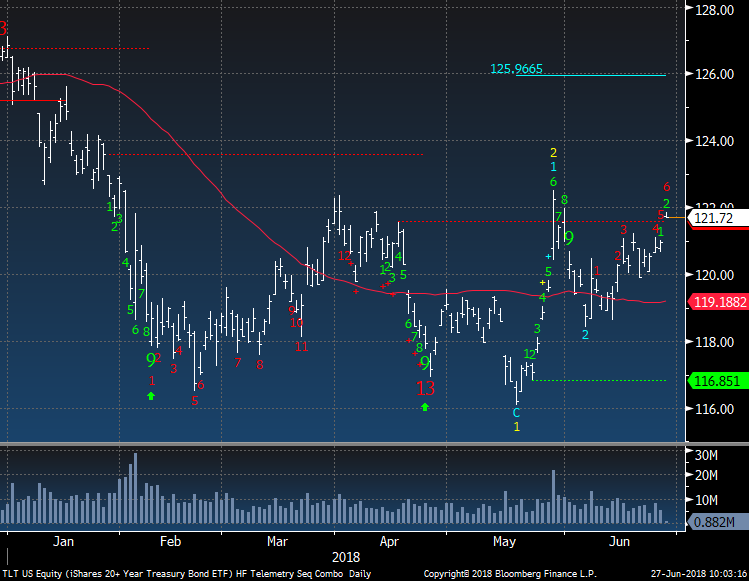
TLT Bond ETF on day 6 of 13. I like TLT long
|
|
|
|
|
|
|
DEMARK SCREENS - Daily, Weekly, Monthly Upside/Downside Exhaustion Signals
|
|
|
Daily/Weekly DeMark upside/downside exhaustion signals (Sequential) weekly updated on Monday's and monthly on the first day of the new month. Price flips occur when a stock closes higher/lower than four previous closes and increases conviction of a price turn.
The upside 13's are sell signals and downside 13's are buy signals. Price flip's are confirmation signals that increases potential for a price trend change. For example, if you are long a stock and there is an upside 13, you will want to take cautious action by selling down or out of a position. If initiating a short sale with the upside 13's, we tend to start with a 1/2 size and add with the downside price flip. The opposite is true for when there are downside 13's. Take a 1/2 size position
and add with the upside price flip. The DeMark Indicators are designed to assist the user with buying into weakness and selling into strength to anticipate trend exhaustion. Selling into a rally and buying into a decline often afford the opportunity to exit a trade without too serious a loss if wrong.
S&P 1500 Universe:
DAILY UPSIDE 13: GEO, GPOR, HRL, PEP
DAILY DOWNSIDE 13: ALLE, CINF, KELYA, MKTX, USB
DAILY UPSIDE WITH PRICE FLIP REVERSAL DOWN: ANF, CLI, CNMD, DPS, DVN, GHL, MSI, TG, THS, TMP
DAILY DOWNSIDE WITH PRICE FLIP REVERSAL UP: HII, LDOS
Updated: 6/25/18
WEEKLY UPSIDE 13: BLKB, CRVL, GOOG, HMSY, IDXX, JCOM, MATX, NEE, NP, NWBI, PAYX, SHLM, TBI, VIVO
WEEKLY DOWNSIDE 13: CPWR, PRA
Updated: 6/4/18
MONTHLY UPSIDE
13: BJRI, IDA, NSP, PFS, PVH, SCSC, SYY, TSCO, VDSI, VLO
MONTHLY DOWNSIDE 13: CLW, LQDT
Euro Stoxx 600 Universe:
DAILY
UPSIDE 13: HIK LN
DAILY DOWNSIDE 13: PFG LN, TCH FP, TIT IM
DAILY UPSIDE WITH PRICE FLIP REVERSAL DOWN: BVIC LN, GN DC, GRF SM, HSX LN, TRYG DC, TSCO LN
DAILY DOWNSIDE WITH PRICE FLIP REVERSAL UP: NONE
Updated: 6/25/18
WEEKLY UPSIDE 13: EDF FP, INF LN, MTX GR, OCDO LN, SCHA NO
WEEKLY DOWNSIDE 13: LRE LN, MAESKB DC
Updated: 6/4/18
MONTHLY UPSIDE 13: ADS GR, AMEAS FH, AV/ LN, BVS LN, DG FP, HELN SW, HLMA LN, ITRK LN, LEG GR, NESTE FH
MONTHLY DOWNSIDE 13: NONE
|
|
|
Unsubscribe me from Hedge Fund Telemetry
Hedge Fund Telemetry LLC, P.O. Box 4675, Greenwich, CT 06861, United States
CONFIDENTIALITY NOTE and DISCLAIMER: This message is for the named person's use only. It may contain confidential, proprietary or legally privileged material. No confidentiality or privilege is waived by any accidental or unintentional transmission. If you receive this message in error, please immediately delete it and all copies of it from your system, destroy any hard copies and notify the sender. You must not, directly or indirectly, use, disclose,
distribute, print or copy any part of this message if you are not the intended recipient. Hedge Fund Telemetry LLC. cannot guarantee the confidentiality of the material transmitted; therefore, information of a sensitive or confidential nature should not be transmitted. There is risk in trading markets. Hedge Fund Telemetry LLC reports are based on information gathered from various sources and believed to be reliable, but are not guaranteed as to accuracy and completeness. The information is subject to change without notice and Hedge Fund Telemetry LLC has no obligation to provide any updates or changes. Hedge Fund Telemetry LLC is providing this data for informational and educational purposes and does not believe that it is sufficient to base an investment decision on. This information should not be regarded as a solicitation or recommendation of any particular security or to engage in any trading strategy. One should always check with your licensed financial
advisor to determine suitability of any investments.
|
|
|
|
|