|
|
|
|
|
|
Good news, bad news on the bank stress tests
|
|
|
Let me get the good news out of the way first... All the banks passed the stress tests. The bad news is the stress tests are completely meaningless in the real world. I was out last night with the best financials hedge fund trader on Wall Street. We pondered over a few beers the problems happening around the world within the financial sector. Every one of the 40 global SIFI's (Systemically Important Financial Institutions) are below their 12 month highs. Deutsche Bank is down
44% and Bank of NY is down 1% but 16 are down more than 20% and 36% are down 10% or more. The stress tests are meant to give investors confidence that the banks aren't going to blow up like what we saw in 2008. It's true that banks are in a much healthier condition vs 2007/08 due to a lot less leverage and coverage ratios that have been raised considerably. Banks did drop in April after reporting inline to better earnings. Puzzling to the average investor however my financials trader friend just flat out said "They are not lending like they should and expenses are going way up." This could be like 1937 and how banks were in a similar position where they hoarded cash as they were afraid of another crash. The Fed was raising rates too after implementing a multi year QE program to get the economy out of the depression. The equity market quickly dropped 50% and the economy went into recession.
It's not just the Eurozone that has the weak
banks, they have eight that are down 20% or more as there are three Chinese, two Swiss, and one from Japan, Sweden, and the US that are down 20% or more. People have ignored this risk as CDS have not responded as one would expect and risk is rationalized by being "isolated." The rise of the USD raises the risk of a "dollar shortage" and could be a contributing factor with the bank weakness. US corporate credit spreads have moved wider and many of the Euro and Asian banks could be wearing a lot of that beat up debt. Going back to the Fed, they are in a rising rate cycle at a time when these SIFI's need accommodation. The recent bond bounce could be another sign that larger players are starting to notice what is happening. The stress tests come in two parts with the quantitative part out of the way and next week the tougher qualitative part might crimp some of the banks plans for capital returns and buybacks. Perhaps when Goldman suspended its buyback
in April, it knew it was running a little close to the minimum leverage ratio. Below I have some custom indexes of the SIFI's. Have a great weekend!
Notable:
- US Markets - Sentiment continues to drift lower but no panic
- Hedge Fund Telemetry Trade Ideas - No changes today.
- SIFI Custom Indexes - The Good, Bad, and the Ugly
- Currencies - USD sentiment backing off from extreme
- Asian Indexes - Watch out below if China and Hong Kong can't hold here
- European Markets - DAX on support, relief bounce for UK
- LEI - Leading Economic Indicators quarterly chart
- Gold and Silver Update - Not yet a buyer but closer
- Crude Update - OPEC bounce
- Bond Update - Sentiment remains OK while everything seems stuck. I like bonds long still
- DeMark Screens - Daily, Weekly, Monthly upside/downside exhaustion signals within the S&P 1500 and Euro Stoxx 600
|
|
|
|
|
Here's a link to the Hedge Fund Telemetry market sentiment page with 40 charts of sentiment including equities, bonds, currencies, and commodities updated each day.
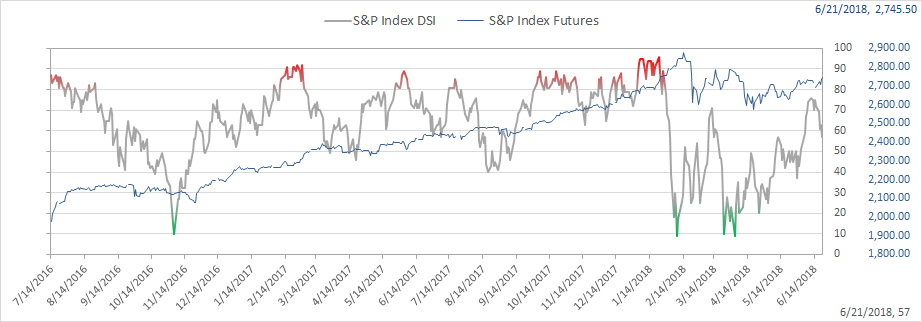
SPX bullish sentiment is at 57% and continues to drift lower
|
|
|
|
|
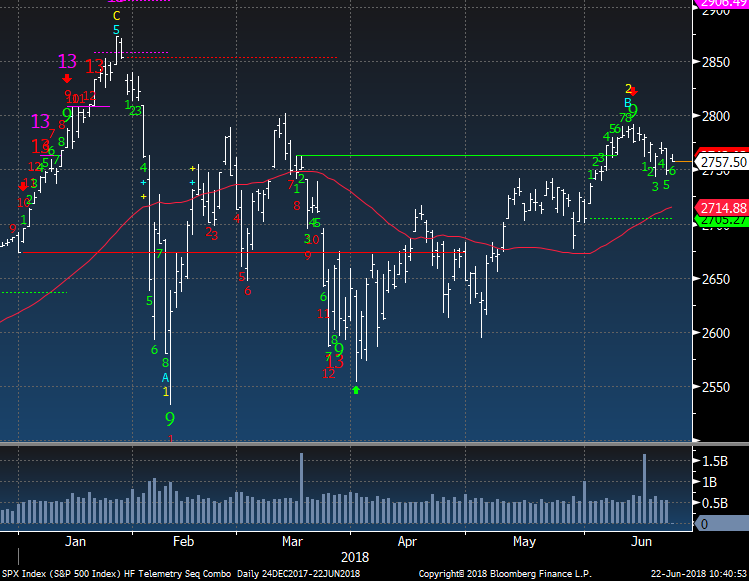
SPX Index now on day 6 of 9 with green Setup. 2750 is near term support
|
|
|
|
|
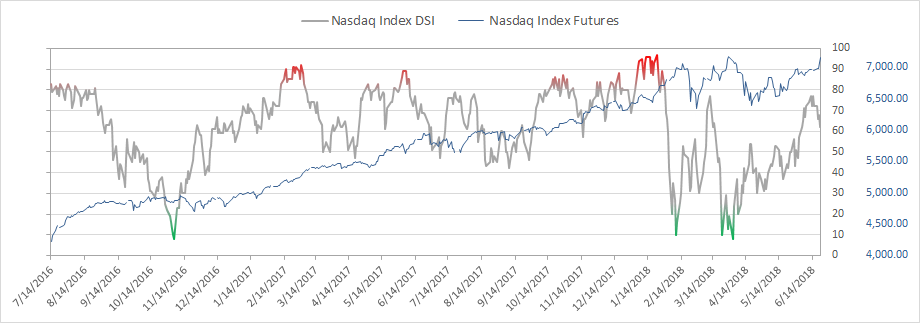
Nasdaq bullish sentiment is at 62% and down from recent high of 77%
|
|
|
|
|
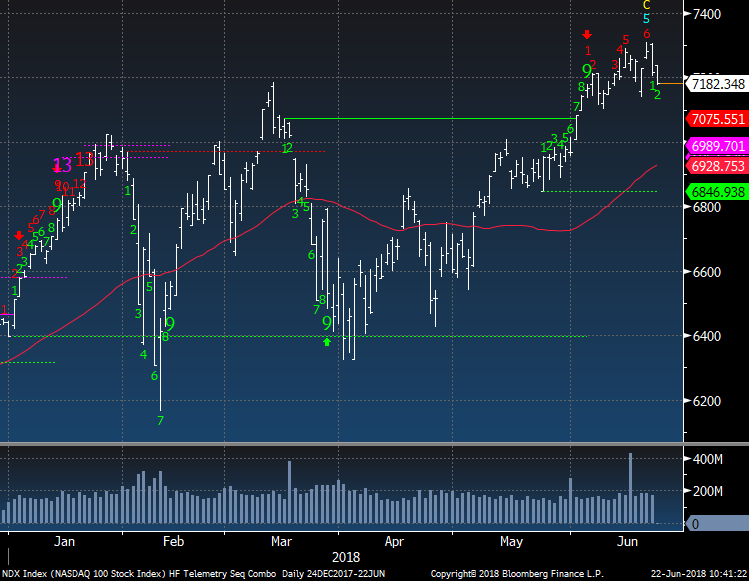
NDX Index stalling although there remains a pending upside Countdown on day 6 of 13
|
|
|
|
|
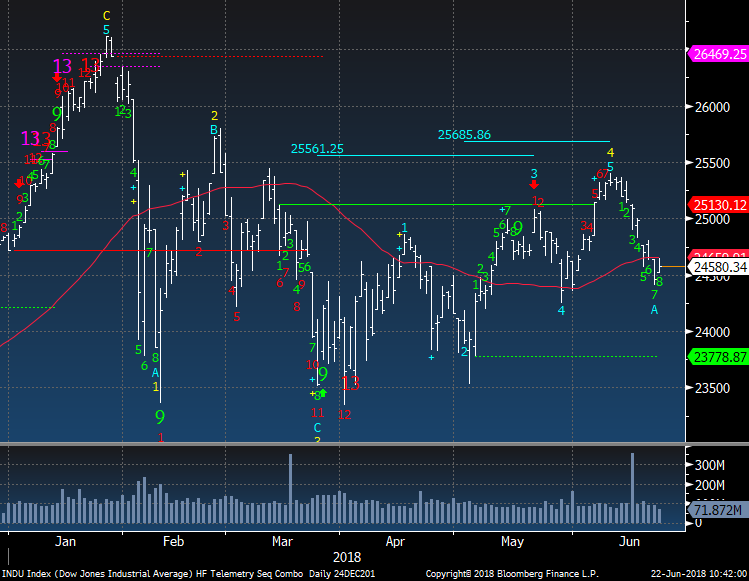
Dow Jones still under the 50 day and down on the year. It's on day 8 of 9 with a downside green Setup and if it closes under 24,700 Monday the 9 will stick and the pending upside red Countdown will be cancelled.
|
|
|
|
|
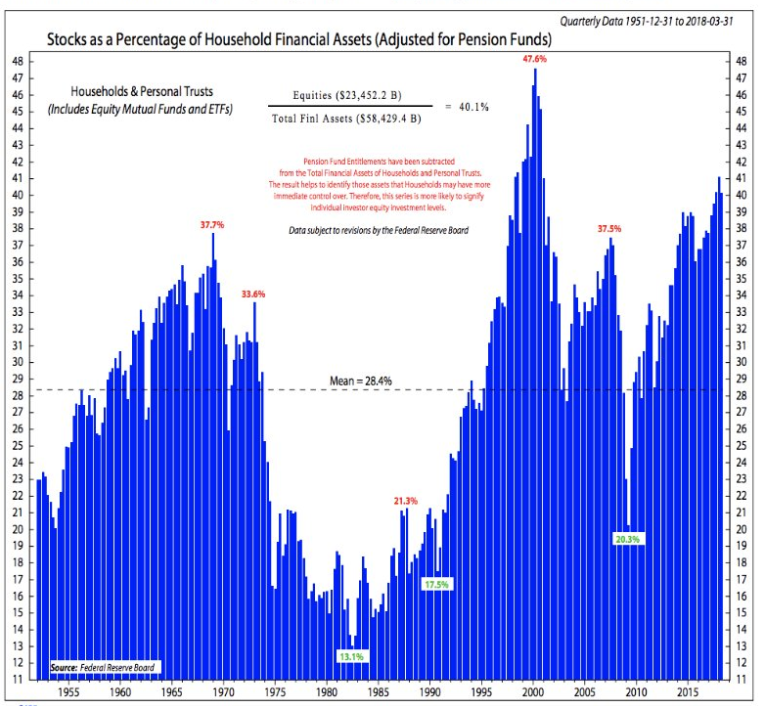
Despite the relatively weak action in the first half of the year people are more invested
|
|
|
|
|
|
|
Hedge Fund Telemetry Trade Ideas
|
|
|
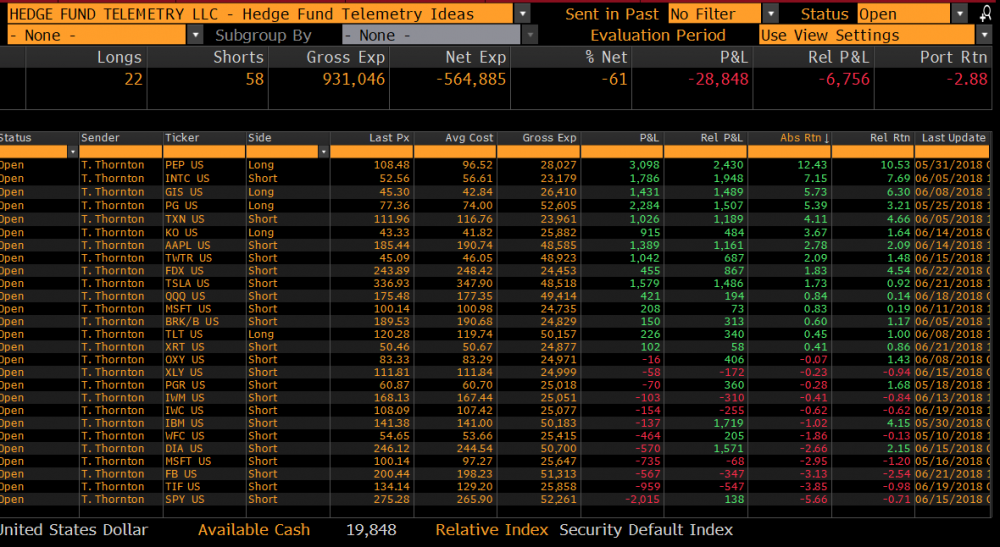
Trade Ideas - No changes today.
|
|
|
|
|
|
|
SIFI's The Good, Bad, and Ugly
|
|
|
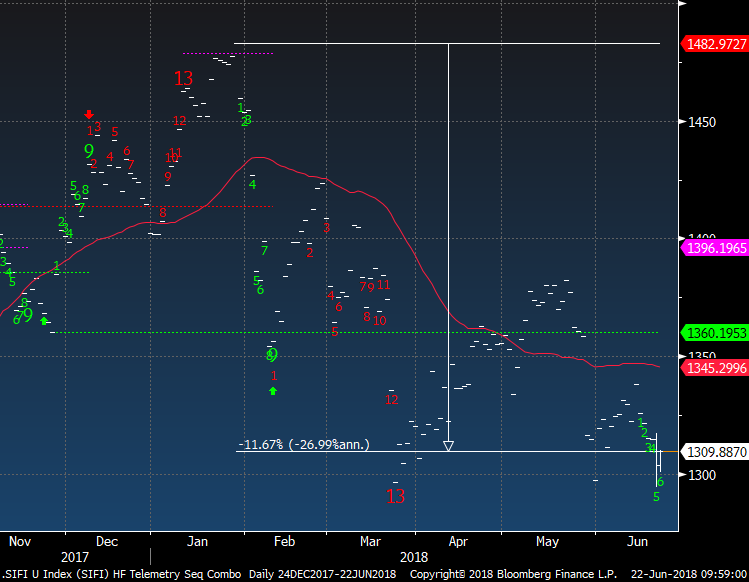
Here's the entire 40 stocks that have the designation of SIFI. On an equal weight custom index they are down 11.67%
|
|
|
|
|
SIFI weekly shows it holding the February lows. Breaking down a little more could really cause some panic. Similar upside exhaustion signals were seen in 2015 and bottoming signals in early 2016. There is a lot of room for downside to the 2016 levels.
|
|
|
|
|
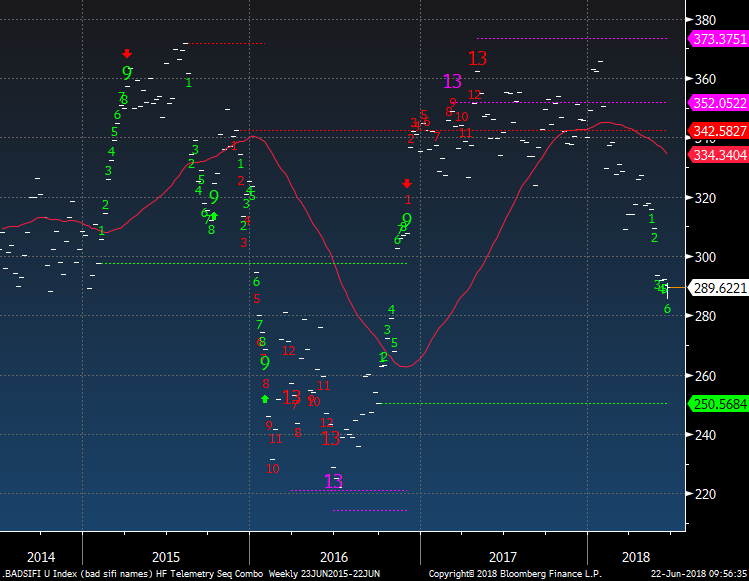
The weekly of the BAD SIFI's (those down 20% from highs) has broken and has gapped lower a few times
|
|
|
|
|
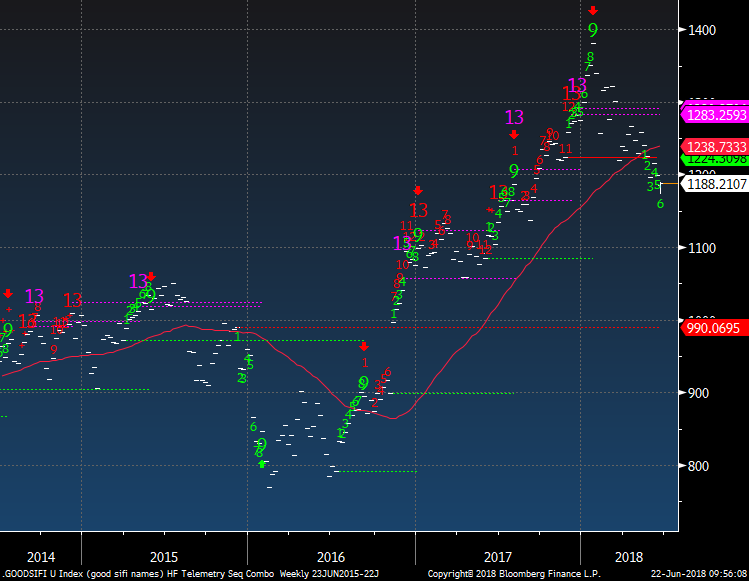
GOOD SIFI's (those that are down 1% to down 18%) has held up better mostly due the US financial sector that hasn't gone down like European banks
|
|
|
|
|
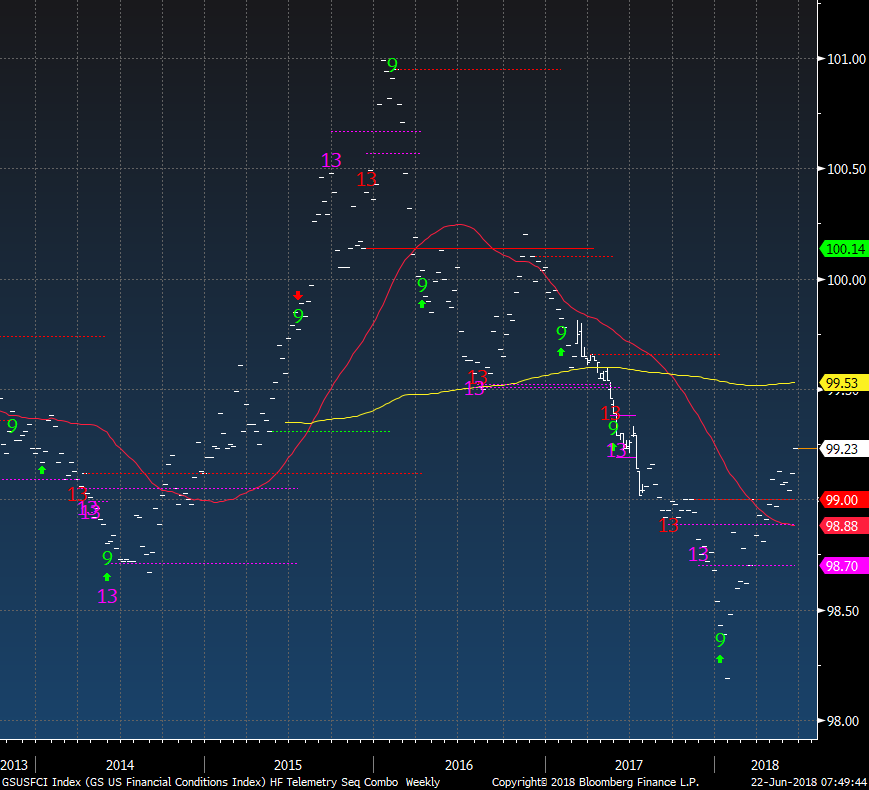
GS Financial Conditions Index measures financial stress and it made a year high this week. Worth noting this is an early warning indicator that tends to trend for quarters.
|
|
|
|
|
|
|
|
|
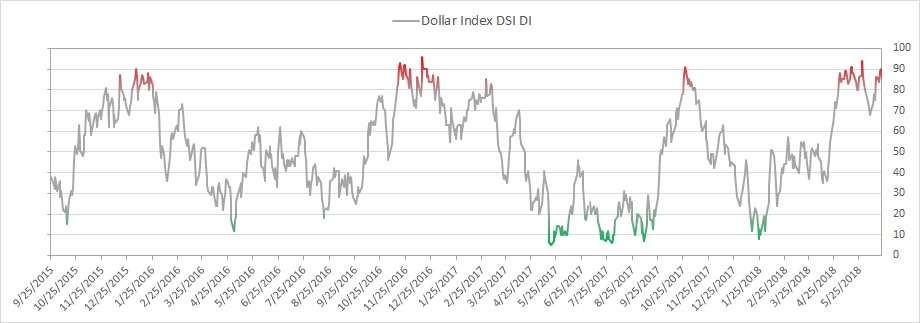
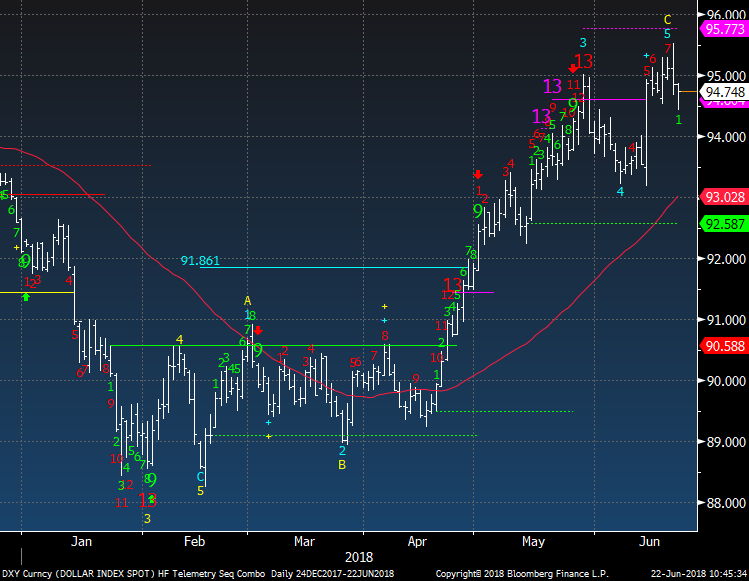
US Dollar bullish sentiment is at 85% down from 90% the previous day. A little back off with the USD rise is due with that sentiment
|
|
|
|
|
US Dollar Index backing off and it lost the upside green count as it is trading below 4 previous closes. There still is an upside red Countdown on day 7 of 13.
|
|
|
|
|
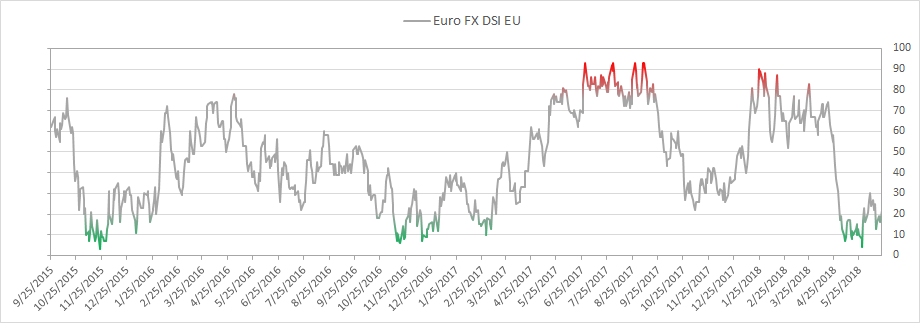
Euro bullish sentiment is at 22%
|
|
|
|
|
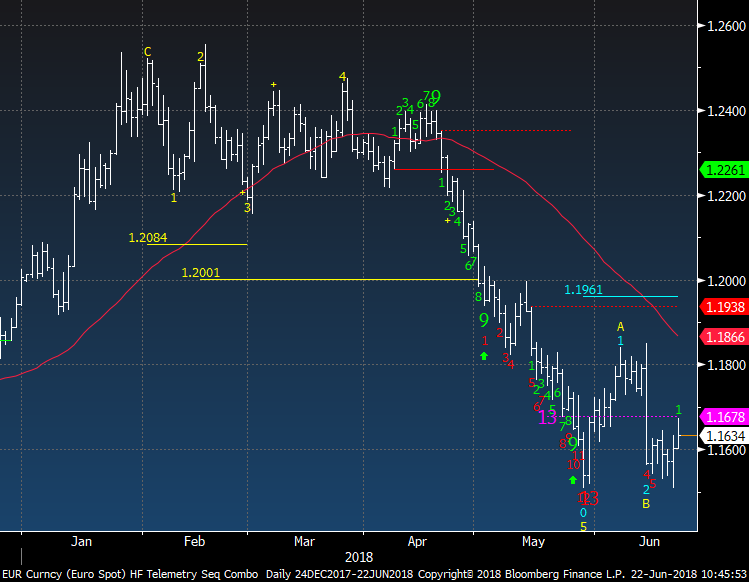
Euro spot is up today although it's in the middle of the today's range which isn't so convincing.
|
|
|
|
|
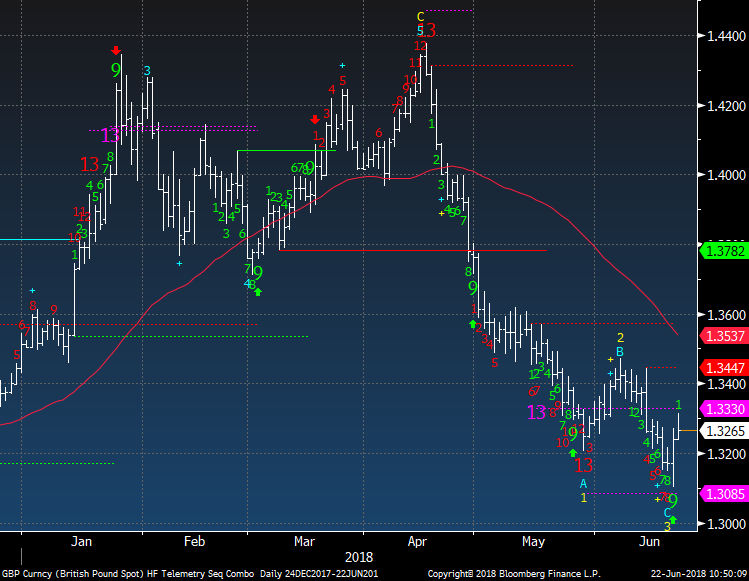
British Pound up today and also below the midpoint of today's range
|
|
|
|
|
|
|
|
|
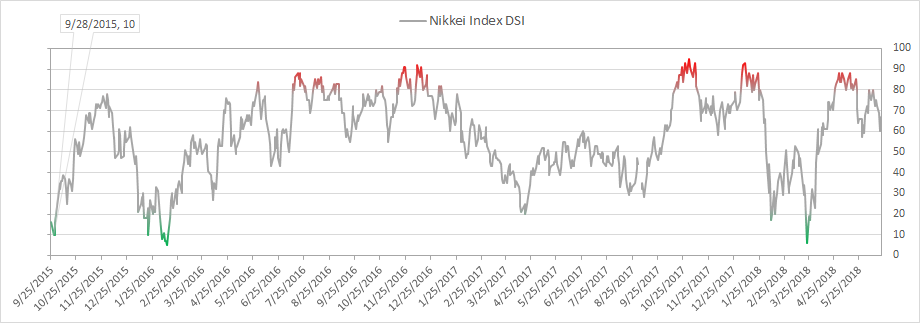
Nikkei bullish sentiment is at 63% and nearing recent support at 59%
|
|
|
|
|
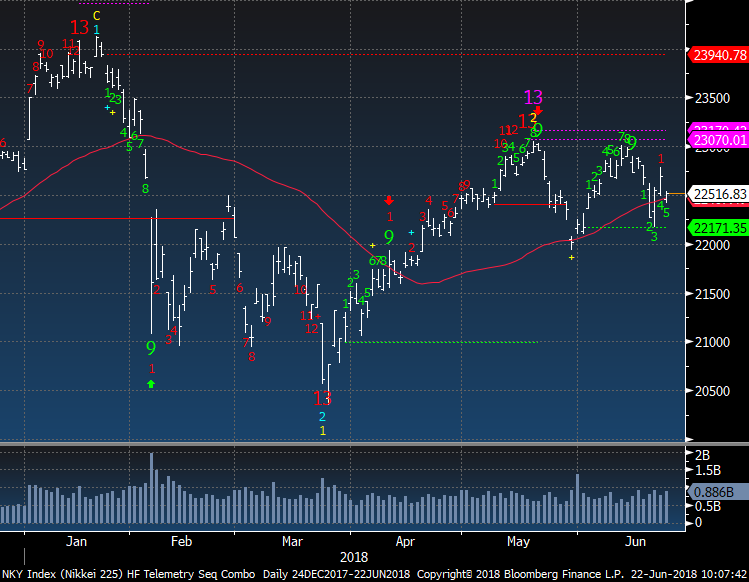
Nikkei is stalling and has a mixed DeMark count. Breaking below 22,171 would kick the leg out from this index.
|
|
|
|
|
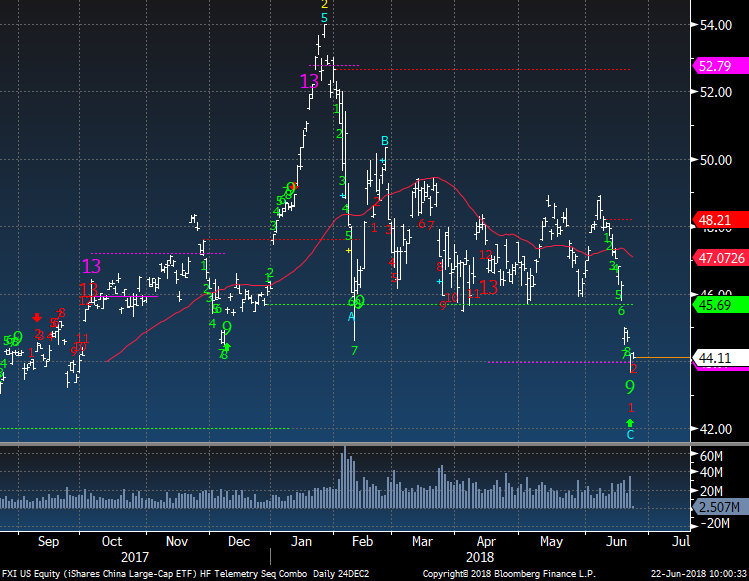
FXI Hong Kong China ETF speaking of kicking the leg out. It must hold this level or else 5% at least lower
|
|
|
|
|
|
|
|
|
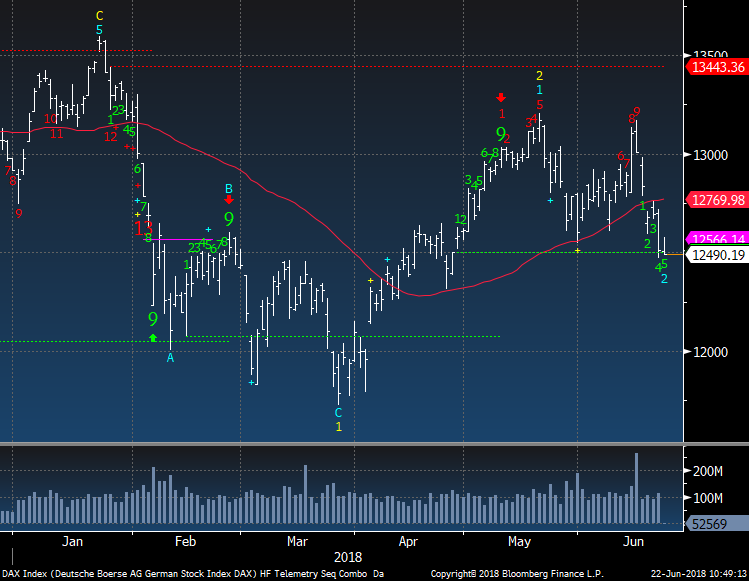
DAX reversed today's gains and is right at support (TDST) green dotted line. Doesn't look good
|
|
|
|
|
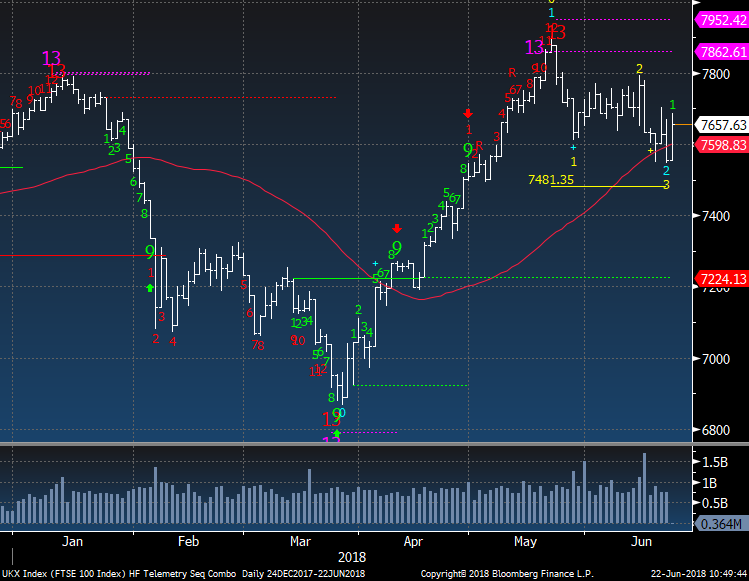
UK FTSE 100 is having a good day today yet I am now convinced this is a low.
|
|
|
|
|
|
|
LEI Leading Economic Indicators
|
|
|
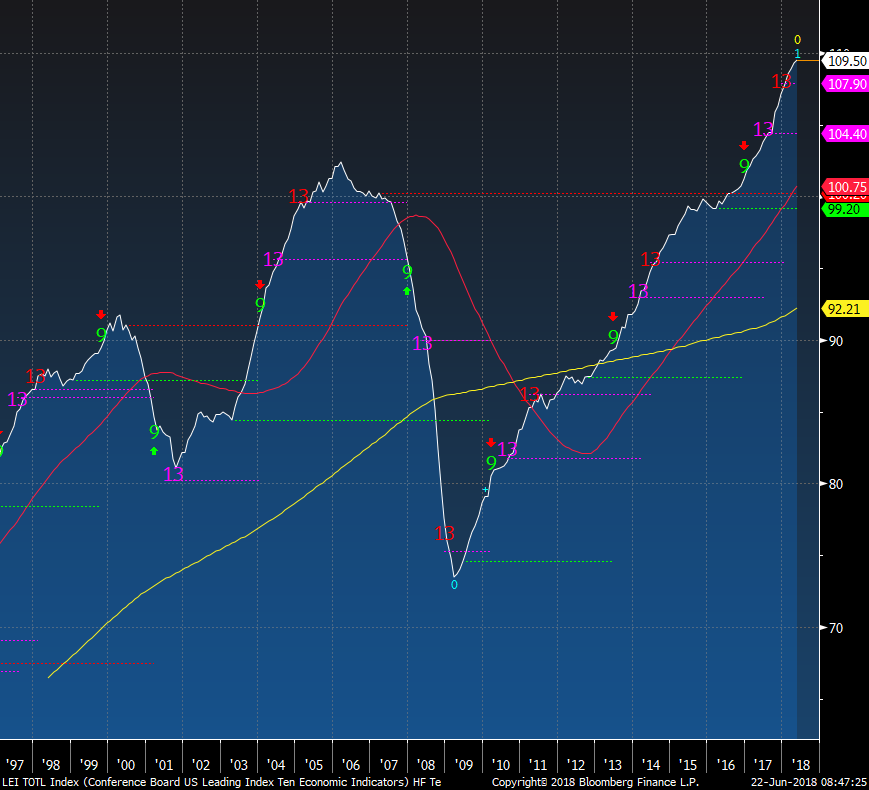
On a quarterly basis there tends to be some upside and downside DeMark indicators that trigger ahead of big tops or economic stress or relief. This is a quarterly chart so keep in mind the signals can be a little early.
|
|
|
|
|
|
|
|
|
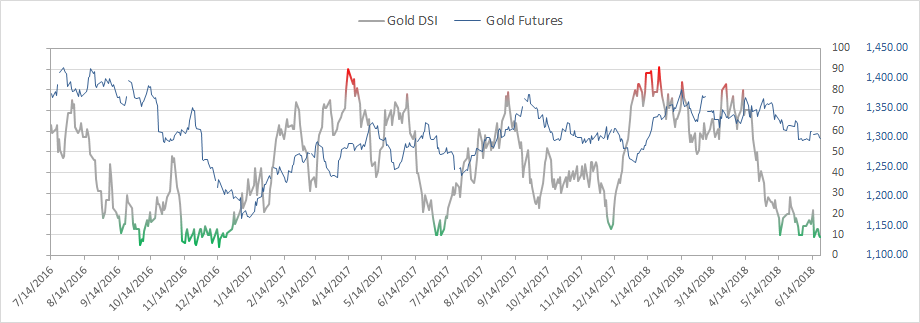
Gold bullish sentiment is at 9% and that's very low
|
|
|
|
|
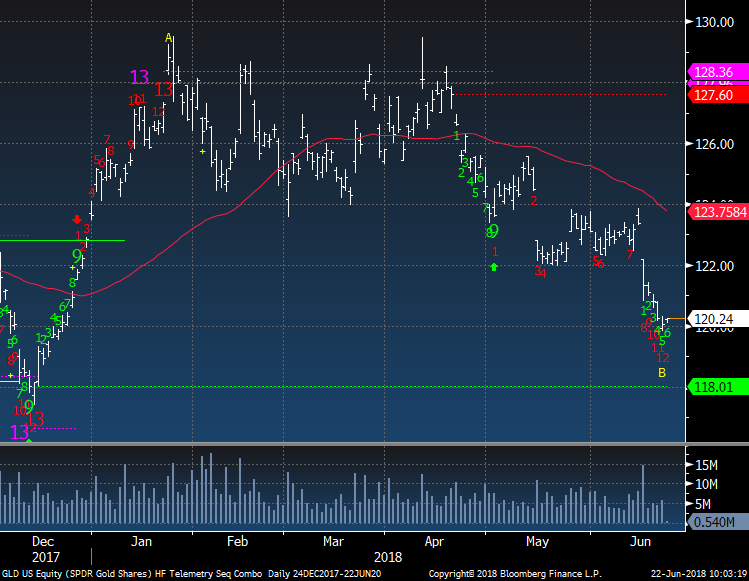
GLD is nearing a downside exhaustion signal. Gold futures is a few days behind GLD
|
|
|
|
|
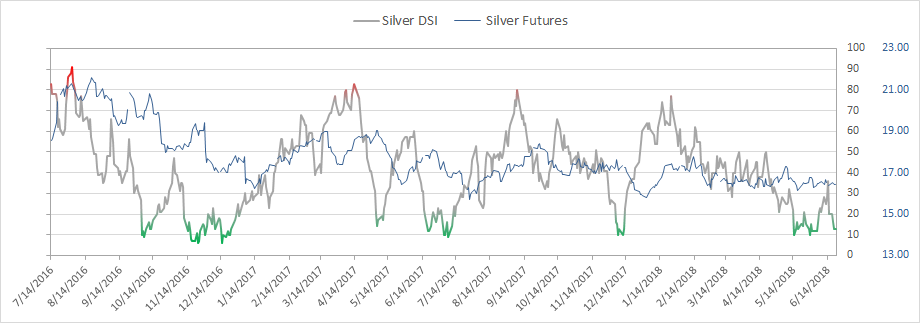
Silver bullish sentiment is at 13%
|
|
|
|
|
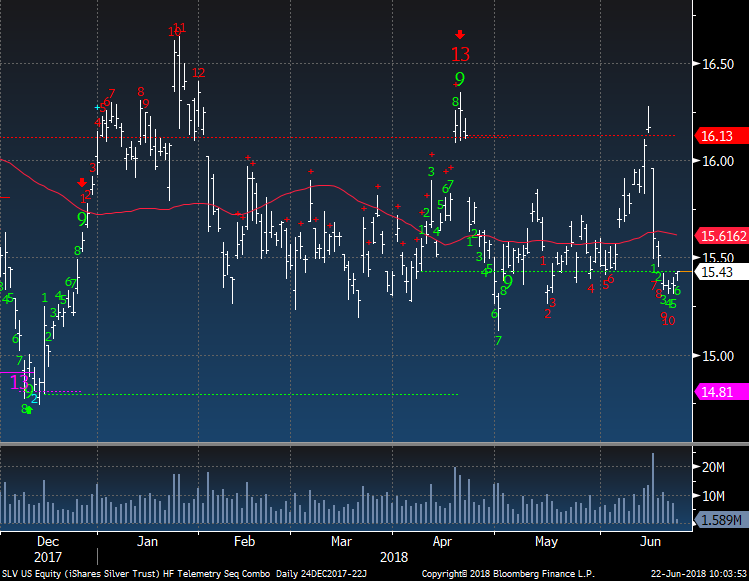
SLV is on day 10 of 13 with a downside Countdown.
|
|
|
|
|
|
|
|
|
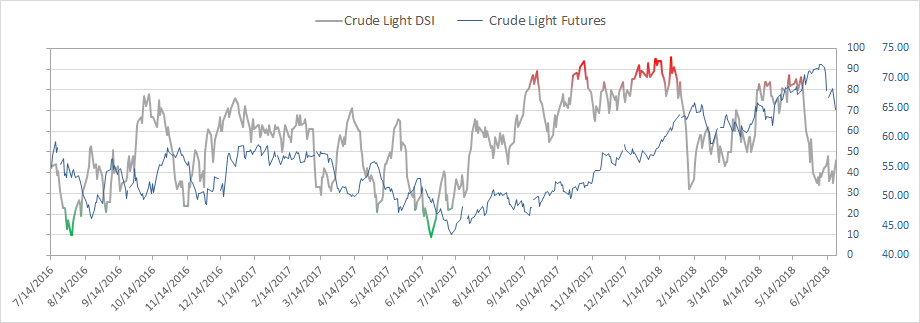
Crude bullish sentiment is at 46%
|
|
|
|
|
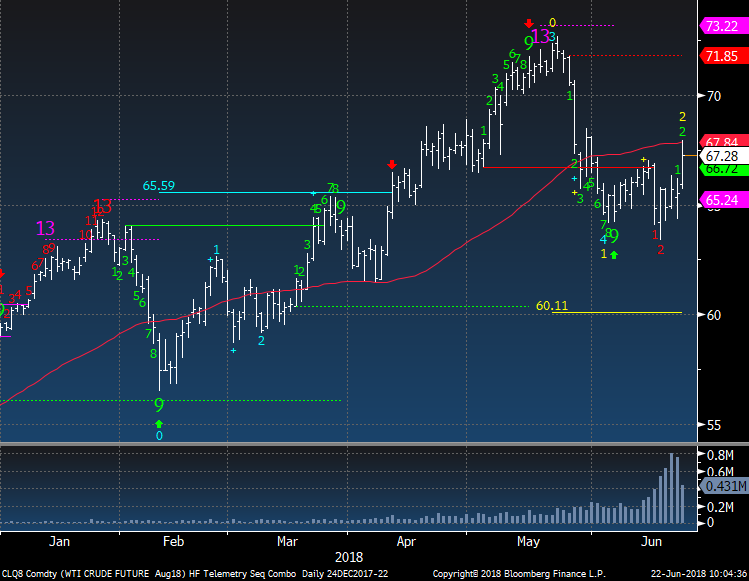
WTI Crude Futures bouncing on the OPEC news of increased production. This was well telegraphed and the bounce touched the 50 day today. A break below today's low would likely send this right back lower.
|
|
|
|
|
|
|
|
|
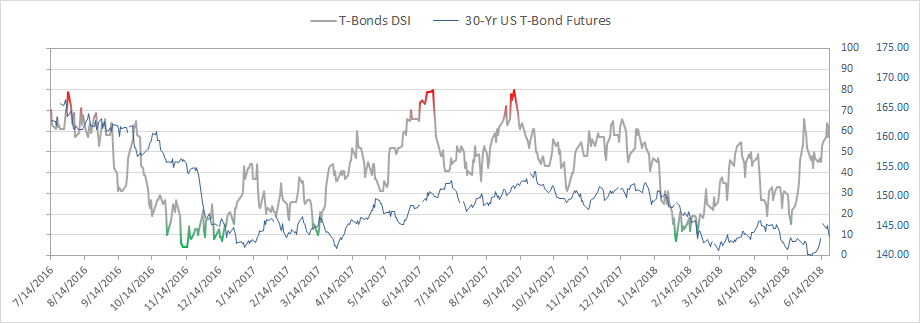
Bond bullish sentiment is at 63% and continues to be rather buoyant
|
|
|
|
|
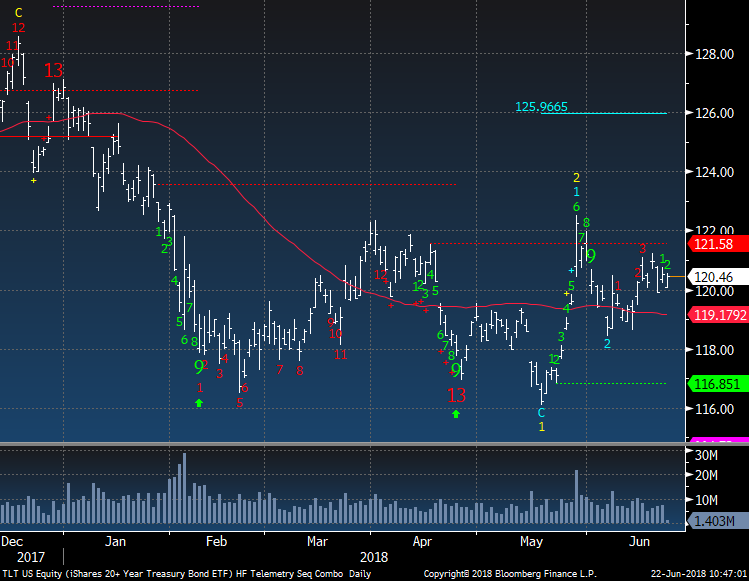
TLT Bond ETF is stuck here and needs a move over 121.58 to get the mojo.
|
|
|
|
|
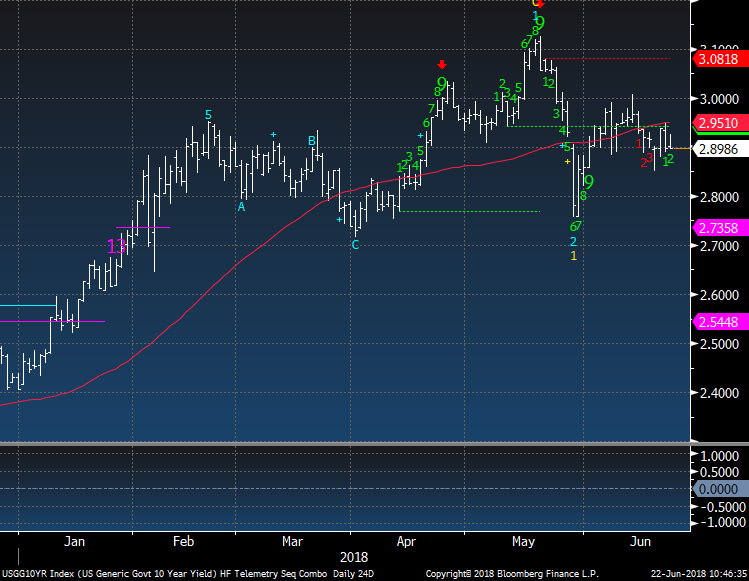
US 10 year yield also stuck near 2.90% and I expect lower yields ahead
|
|
|
|
|
|
|
DEMARK SCREENS - Daily, Weekly, Monthly Upside/Downside Exhaustion Signals
|
|
|
Daily/Weekly DeMark upside/downside exhaustion signals (Sequential) weekly updated on Monday's and monthly on the first day of the new month. Price flips occur when a stock closes higher/lower than four previous closes and increases conviction of a price turn.
The upside 13's are sell signals and downside 13's are buy signals. Price flip's are confirmation signals that increases potential for a price trend change. For example, if you are long a stock and there is an upside 13, you will want to take cautious action by selling down or out of a position. If initiating a short sale with the upside 13's, we tend to start with a 1/2 size and add with the downside price flip. The opposite is true for when there are downside 13's. Take a 1/2 size position
and add with the upside price flip. The DeMark Indicators are designed to assist the user with buying into weakness and selling into strength to anticipate trend exhaustion. Selling into a rally and buying into a decline often afford the opportunity to exit a trade without too serious a loss if wrong.
S&P 1500 Universe:
DAILY UPSIDE 13: ANF, BGS, CHK, CNMD, CY, DCOM, ENSG, IBOC, LGND, LSI, MUR, RPM, TMP, VNO, WST
DAILY DOWNSIDE 13: ALGT, CB, GD, HIG, ICON, NEM
DAILY UPSIDE WITH PRICE FLIP REVERSAL DOWN: AET, AIT, AKAM, AMD, BRKS, CDNS, CRM, EGOV, EHTH, EW, EXC, FICO, FNGN, HMSY, JCOM, K, LPSN, POWI, SAFT, SHOO, SNA, TDS, TRIP, VRSN, VSI, WST, XOXO
DAILY DOWNSIDE WITH PRICE FLIP REVERSAL UP:
PB
Updated: 6/18/18
WEEKLY UPSIDE 13: ABT, AKAM, AMGN, KMPR, RMD, SYK
WEEKLY DOWNSIDE 13: NONE
Updated: 6/4/18
MONTHLY UPSIDE 13: BJRI, IDA, NSP, PFS, PVH, SCSC, SYY, TSCO, VDSI, VLO
MONTHLY DOWNSIDE 13: CLW, LQDT
Euro Stoxx 600 Universe:
DAILY UPSIDE 13: AZN LN, BVIC LN, COLR BB, DMGT LN, GLB ID, GN DC, GRF SM, SWEDA SS
DAILY DOWNSIDE 13: NONE
DAILY UPSIDE WITH PRICE FLIP REVERSAL DOWN: AA/ LN, BEI GR, CPG LN, ENG SM, RB/ LN, SAN FP
DAILY DOWNSIDE WITH PRICE FLIP REVERSAL UP: ZOT SM
Updated: 6/18/18
WEEKLY UPSIDE 13: AI FP, CAP FP, DSV DC, OCI NA, OMV AV, RR/ LN, STMN, SW, UTDI
WEEKLY DOWNSIDE 13: NONE
Updated: 6/4/18
MONTHLY UPSIDE 13: ADS GR, AMEAS FH, AV/ LN, BVS LN, DG FP, HELN SW, HLMA LN, ITRK LN, LEG GR, NESTE FH
MONTHLY DOWNSIDE 13: NONE
|
|
|
Unsubscribe me from Hedge Fund Telemetry
Hedge Fund Telemetry LLC, P.O. Box 4675, Greenwich, CT 06861, United States
CONFIDENTIALITY NOTE and DISCLAIMER: This message is for the named person's use only. It may contain confidential, proprietary or legally privileged material. No confidentiality or privilege is waived by any accidental or unintentional transmission. If you receive this message in error, please immediately delete it and all copies of it from your system, destroy any hard copies and notify the sender. You must not, directly or indirectly, use, disclose,
distribute, print or copy any part of this message if you are not the intended recipient. Hedge Fund Telemetry LLC. cannot guarantee the confidentiality of the material transmitted; therefore, information of a sensitive or confidential nature should not be transmitted. There is risk in trading markets. Hedge Fund Telemetry LLC reports are based on information gathered from various sources and believed to be reliable, but are not guaranteed as to accuracy and completeness. The information is subject to change without notice and Hedge Fund Telemetry LLC has no obligation to provide any updates or changes. Hedge Fund Telemetry LLC is providing this data for informational and educational purposes and does not believe that it is sufficient to base an investment decision on. This information should not be regarded as a solicitation or recommendation of any particular security or to engage in any trading strategy. One should always check with your licensed financial
advisor to determine suitability of any investments.
|
|
|
|
|
|
|