|
|
|
|
|
|
Rationalizing a trade war
|
|
|
Before we get started, tomorrow we are doing another "Daily Note Live" webinar for clients only at 10am EST. Here is the link to sign up. I believe the markets are at an important level and I will go over as much as I can in 30 minutes. There will be no note tomorrow and a replay will be sent right after the webinar completes. If you have anything you want me to address please send me an email.
Let me be clear, trade wars can not be won. It is a lose lose scenario. Increasing the rhetoric might be an "Art of the Deal" tactic that people could rationalize this as only something Trump does all the time to get people to negotiate. Investors in the US have this uncanny ability to get past potential negative catalysts such as trade tariffs as they buy dips and hide out in FANG like tech's and small cap stocks since "they won't be affected." Yesterday I mentioned the ISI China note and I reread it today
as the Chinese are not the type to rationalize trade wars. They are very serious, long term minded policy makers who will likely turn this into them being the victims in this trade war, while having a lot of buttons to push to balance out anything launched at them. From ISI "The path to a trade crackup between the two biggest economies in the world now seems clear. Hopefully something will derail it. The danger is not that these steps well known to date kill the economies. Rather the danger is that these steps yield even bigger and more damaging steps in the coming months. We believe Beijing will not back down on its tariff retaliations, seeing this overseas dispute as serious as any since China's 1949 Civil War. Not being seen as weak in this Xi-Trump faceoff is a big deal to both sides."
This
was from yesterday before Trump added $200 billion more in tariffs.
The setup in the market is deteriorating for rationalizing negative catalysts. Sentiment has rebounded back to elevated and near extreme levels and there are other signs seen at other tops like daily DeMark exhaustion signals and breadth topping. Add in the US Dollar rising which is terrible for emerging markets equity and debt. It's also a negative for trade and earnings in the US. Yet, we continue to see dips being bought in the US while global indexes are making new closing lows under February levels and some large economy markets turn and remain negative for the year. But the Nasdaq is up 11% so everything is fine... Yeah right. Don't forget to register for tomorrow's webinar.
Notable:
- US Markets - Sentiment starting to drift lower off recent highs. Same pattern of gap down and buy dips in last 3 days. Breaking today's low and closing lower would halt the pattern
- Hedge Fund Telemetry Trade Ideas - Added 2.5% sized short IWC. Staples acting well on long side
- PPO Monitor - Starting to show signs of weakness entering market
- Currencies - USD should continue up with crosses breaking down
- Asia Markets - Nikkei doing what I expected and Hong Kong and China very weak
- Global markets not rationalizing stronger USD and tariffs
- Crude and Energy Thoughts - Should continue lower
- Now larger than the entire UK market - Apple, Alphabet, Amazon, Microsoft and Facebook
- Bond Update - I still like bonds long
- DeMark Screens - Daily, Weekly, Monthly upside/downside exhaustion signals within the S&P 1500 and Euro Stoxx 600
|
|
|
|
|
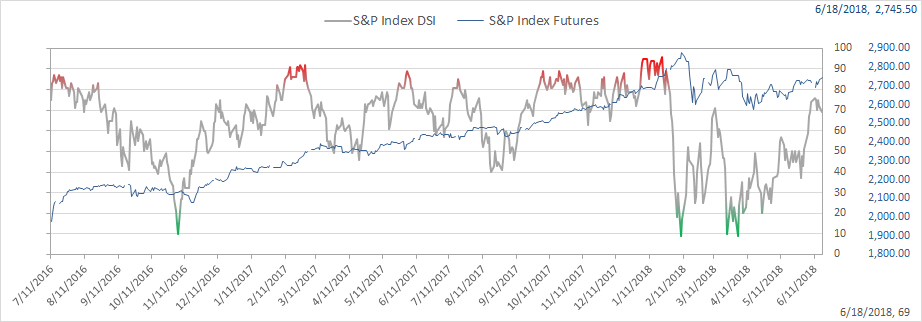
Here's a link to the Hedge Fund Telemetry market sentiment page with 40 charts of sentiment including equities, bonds, currencies, and commodities updated each day.
SPX bullish sentiment is at 69% and starting to drift lower
|
|
|
|
|
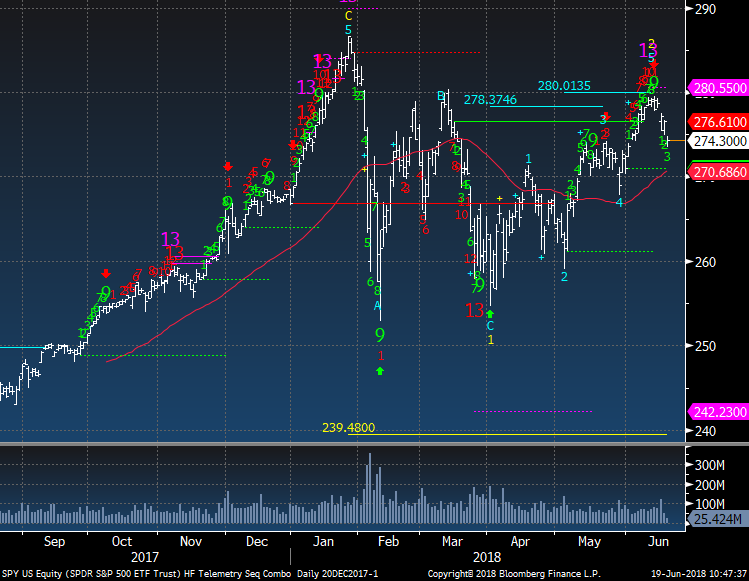
SPY didn't get the upside red 13 Sequential exhaustion as it still is pending on day 11 of 13. The upside pink Combo did trigger its 13 however and right near the 5th wave upside price objective. Watch 270 on SPY or 2700 SPX for support
|
|
|
|
|
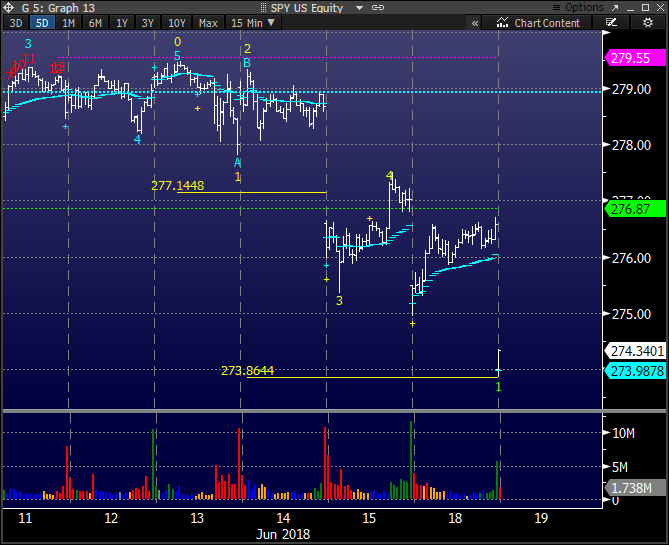
This is the SPY 15 min chart that I use during the day to time some trades. The blue line is the intraday VWAP. The pattern in the last few days have seen gap downs with the dip buyers active. The same pattern is happening today and if we see the indexes close lower later then this pattern will have turned decidedly against the dip buyers.
|
|
|
|
|
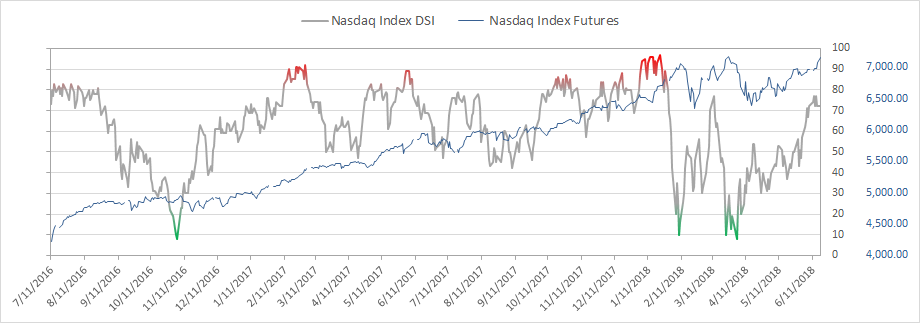
Nasdaq bullish sentiment is at 72%
|
|
|
|
|
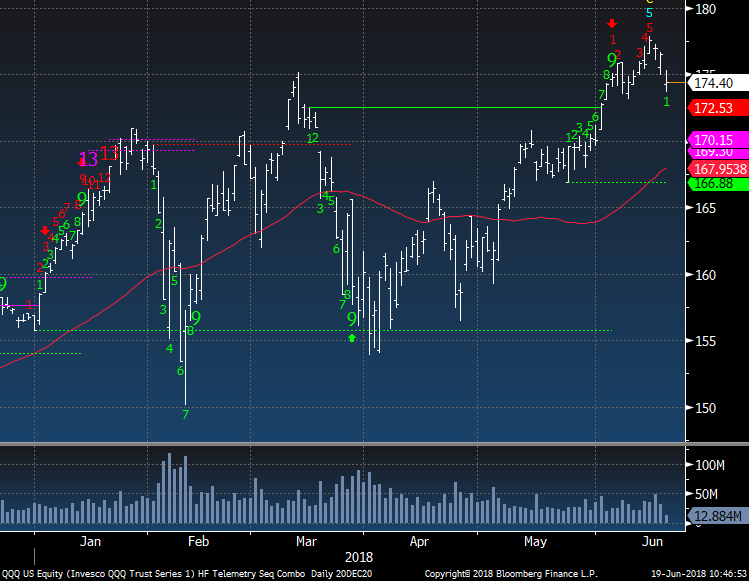
QQQ still has an upside red Countdown in progress on day 5 of 13. It has all of the big weights that people will run to for safety. That is until they are not safe. Apple is now under the VWAP from earnings 186.85 yet still above the quarter to date VWAP at 179. If they break that level then I would bet the company buyback is underwater.
|
|
|
|
|
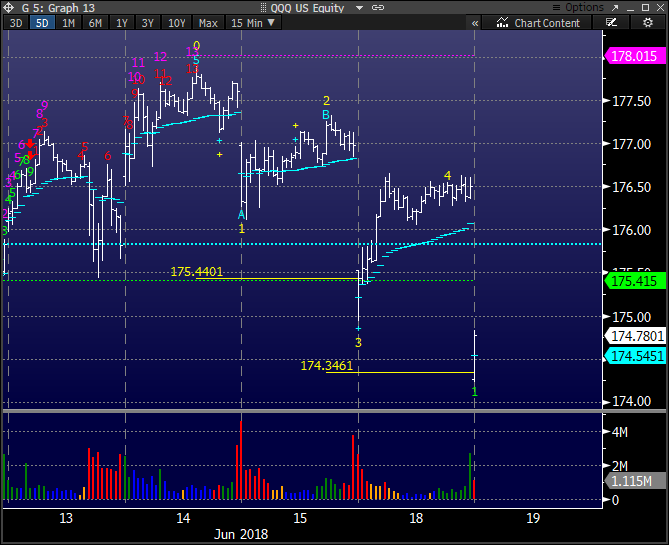
QQQ 15 min chart has the same pattern. Gap down and drift higher. Eventually this won't hold
|
|
|
|
|
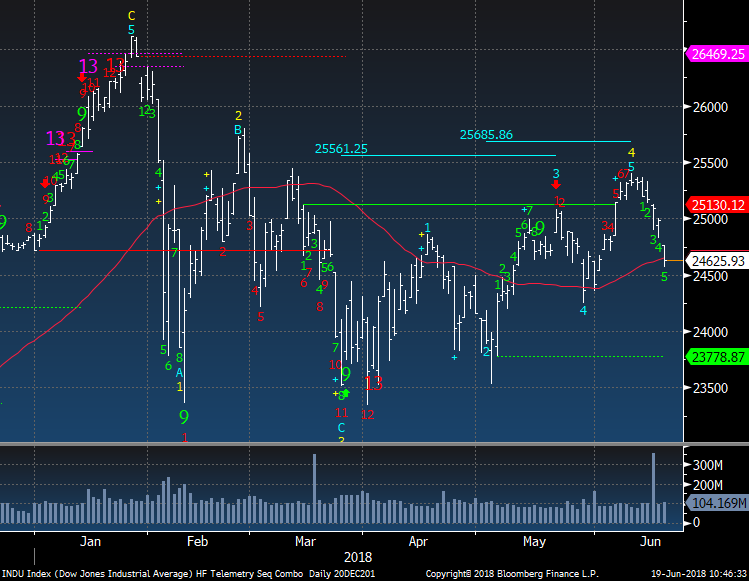
Dow Jones now below the 50 day as expected.
|
|
|
|
|
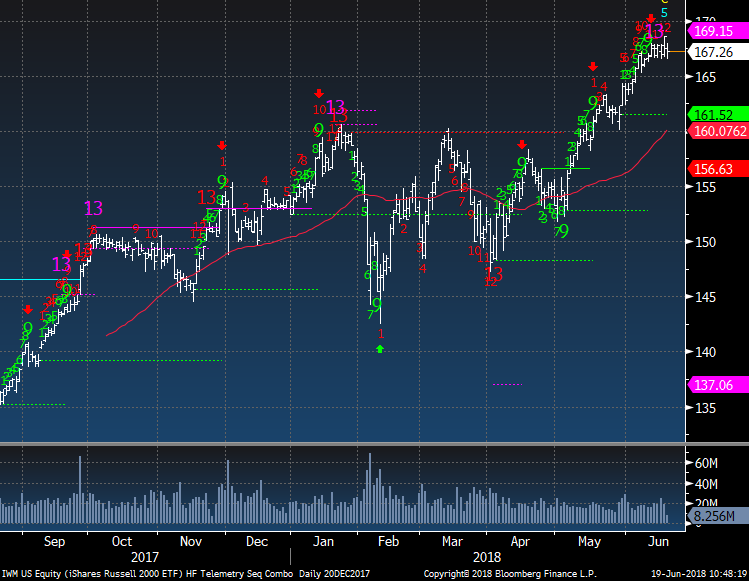
IWM remain on day 12 of 13 with an upside red Sequential Countdown.
|
|
|
|
|
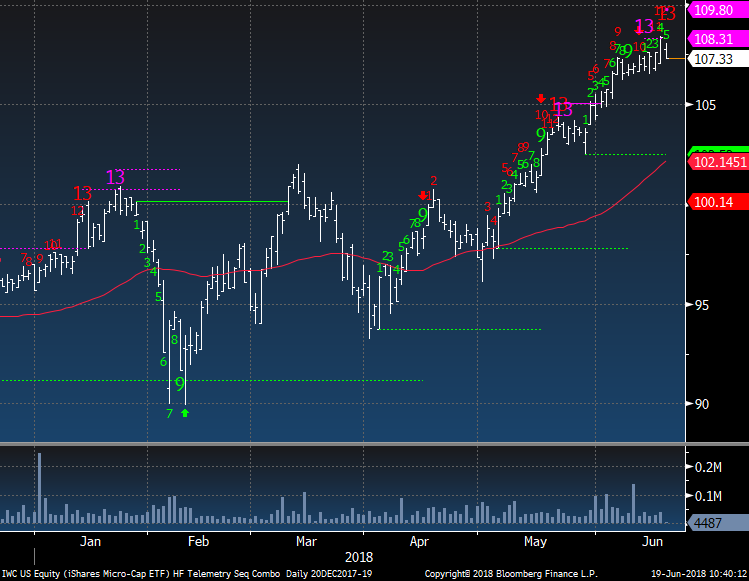
IWC Micro Cap ETF did get the upside exhaustion today and I added it to the Trade Ideas page as a 2.5% sized short
|
|
|
|
|
|
|
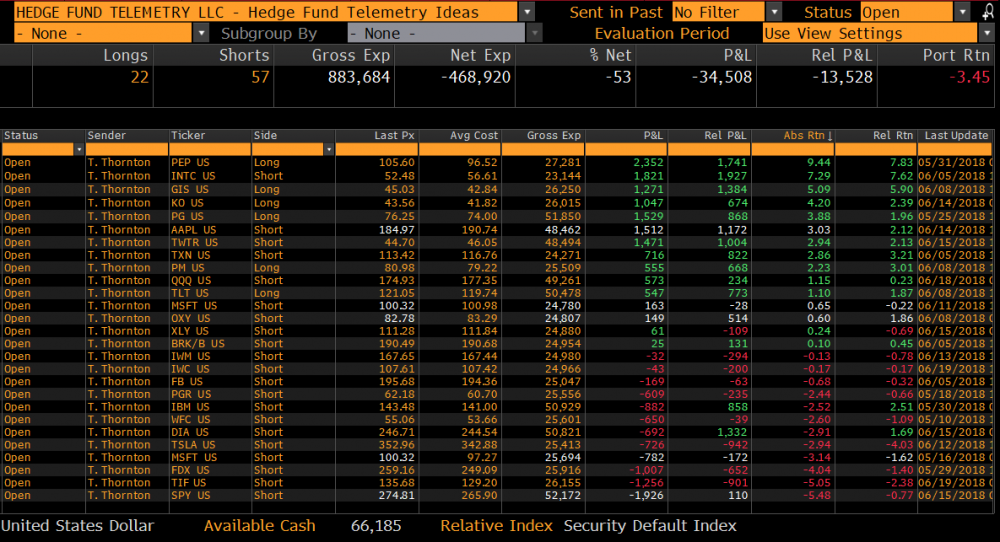
Hedge Fund Telemetry Trade Ideas
|
|
|
Trade Ideas - Added IWC 2.5% short. If you are looking to add to TSLA may I suggest Oct put spreads like 330/250 priced around 20
|
|
|
|
|
|
|
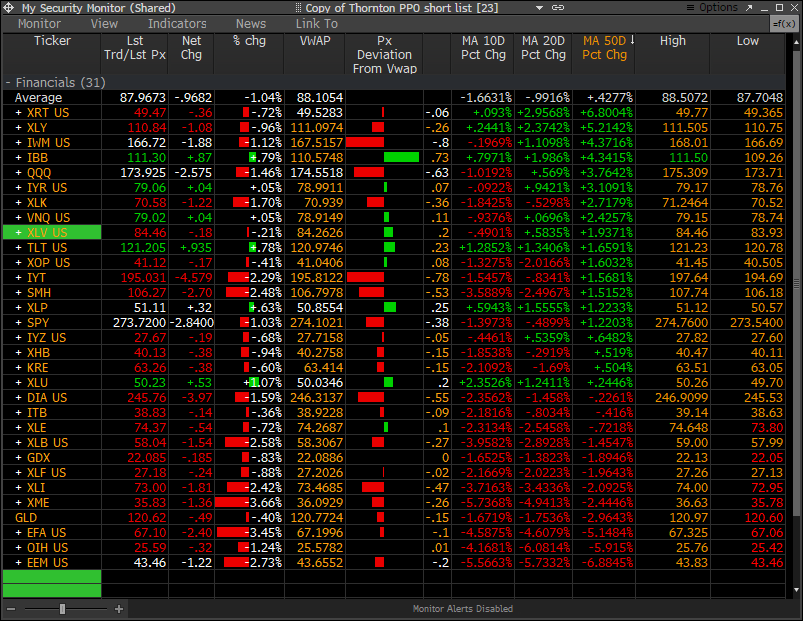
PPO Monitors showing early signs of weakness ahead
|
|
|
Percentage Price Oscillator Monitor is showing most of the ETF's under the 10 day moving aveage and many more now under the 20 day. Recall how I was showing just weeks ago the monitor with the 3 energy ETF's pegged at the top. Now they have rotated lower. On the other hand I liked XLP Staples when it was on the dead low and now it has moved higher with it above the 10, 20, 50 day moving average. If you're on Bloomberg and would like this monitor, please
hit me up on IB. There are a few tricks to the monitor too
|
|
|
|
|
|
|
|
|
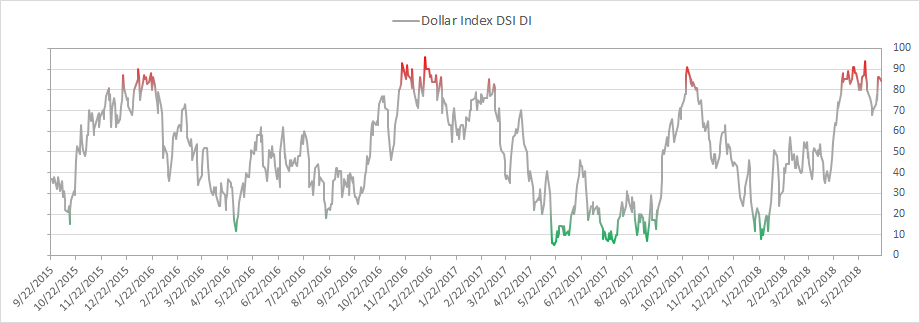
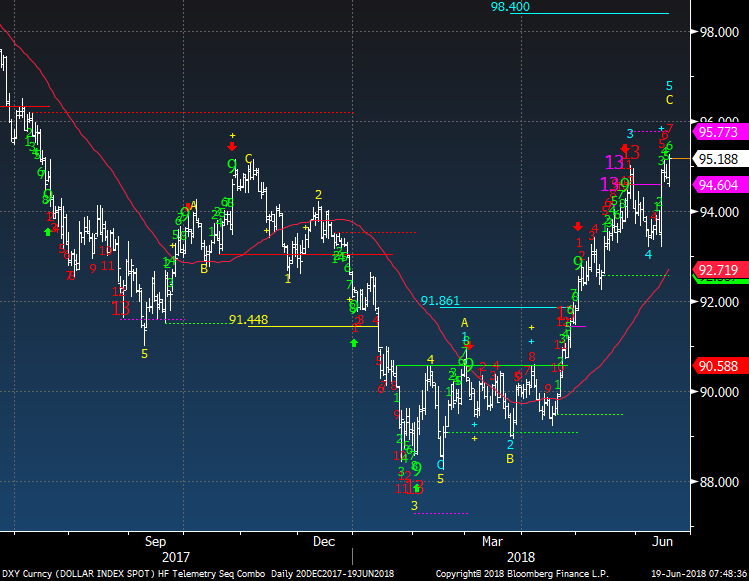
US Dollar bullish sentiment is at 84% and remains in the extreme zone.
|
|
|
|
|
US Dollar Index is on day 7 of 13 with an upside Countdown. The upside wave 5 price objective is 98.40. I remain bullish on the USD
|
|
|
|
|
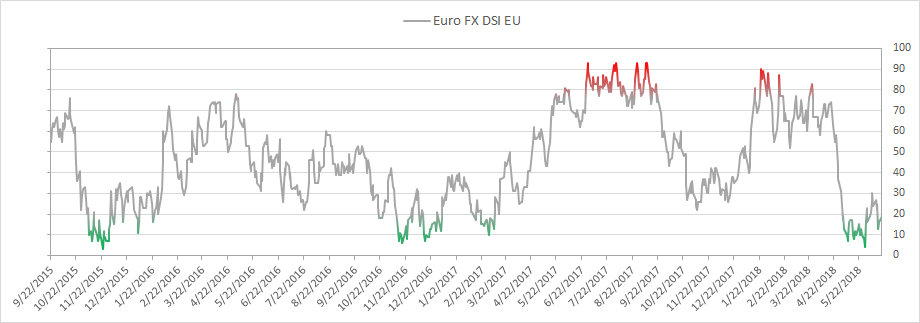
Euro bullish sentiment is at 19%
|
|
|
|
|
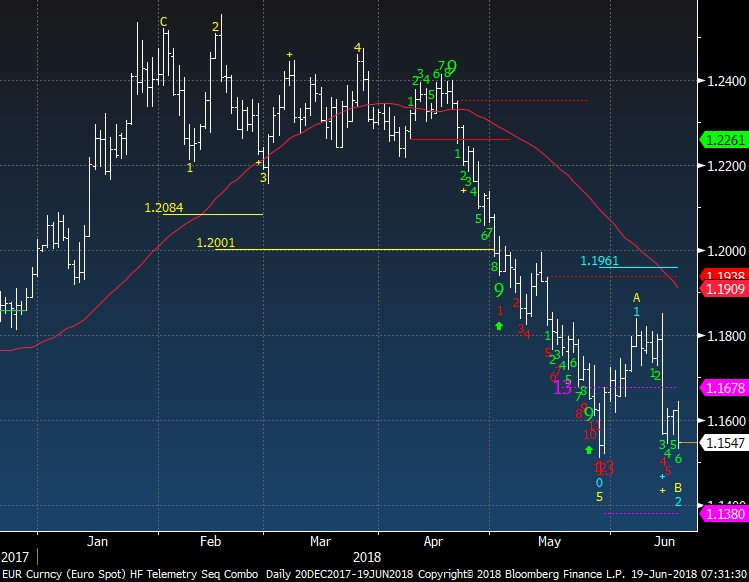
Euro continues lower on day 5 of 13 with a red Sequential downside Countdown. If and when this makes a new closing low the wave 5 will revert to under the last price.
|
|
|
|
|
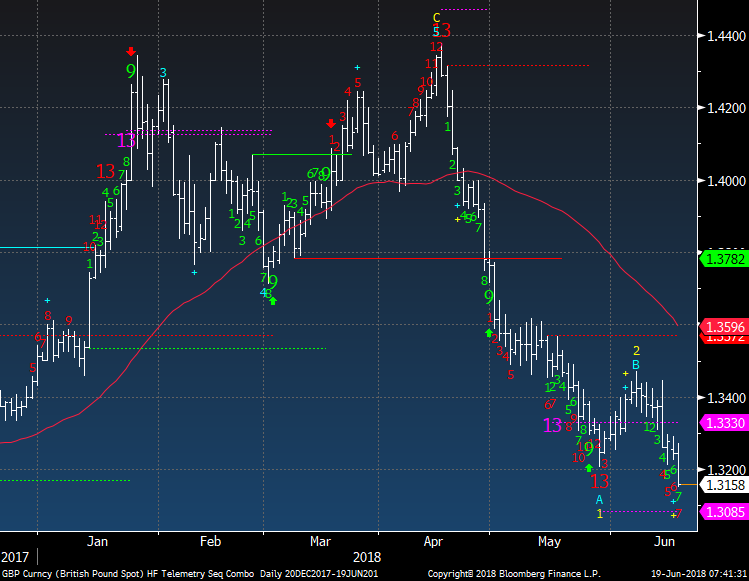
British Pound did make a new low and is on day 7 of 13 with its downside Countdown.
|
|
|
|
|
|
|
|
|
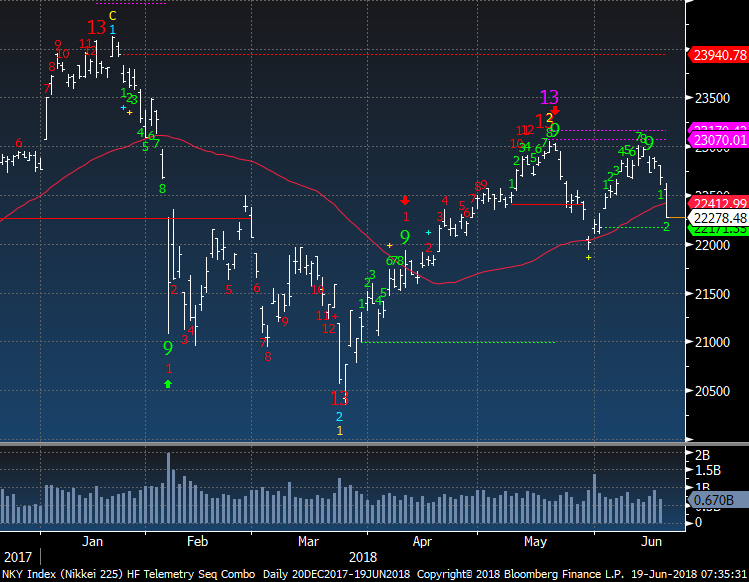
Nikkei did reverse back under the 50 day and now watch the 22,000 level for support. Under that level and it could move lower by 5% or more quickly.
|
|
|
|
|
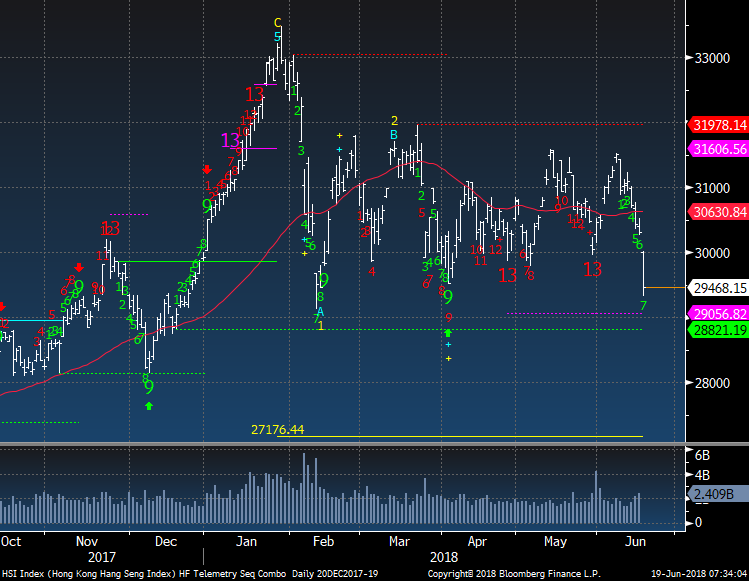
Hong Kong reopened from Monday's holiday and was crushed. This is nearly under the February lows
|
|
|
|
|
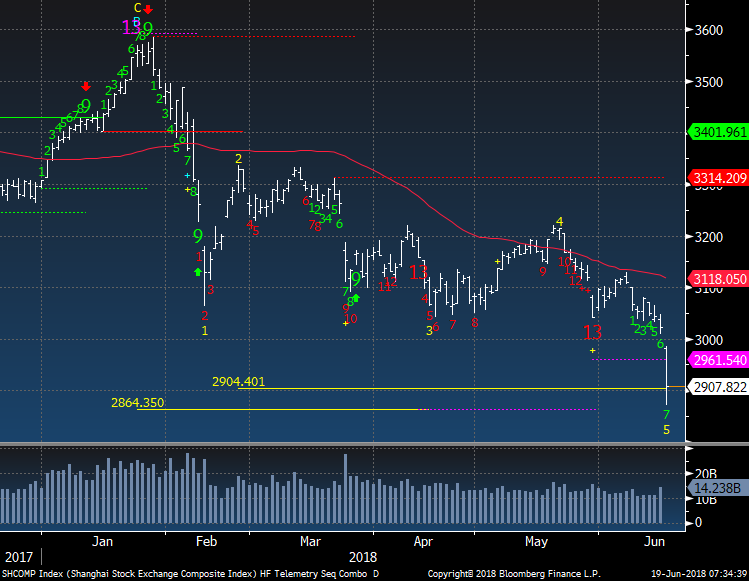
Shanghai reopened too and broke major support
|
|
|
|
|
|
|
| Global Markets are not rationalizing the USD strength or tariff implications
|
|
|
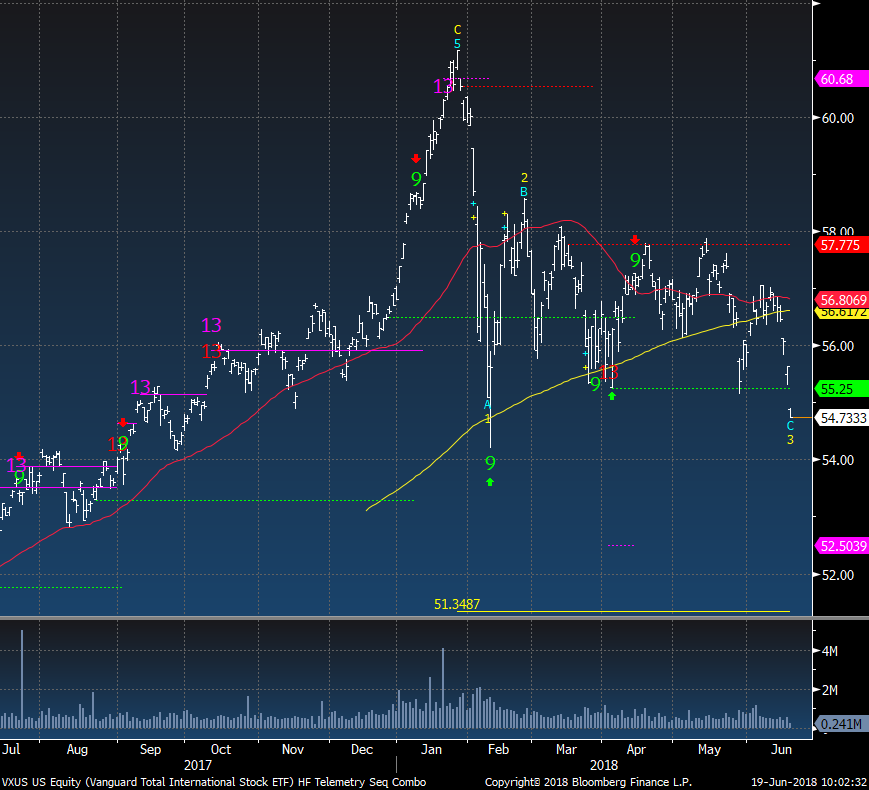
Vanguard Total International (ex US) made a new closing low under February's closing low. There is a downside wave 3 price objective of 51.34
|
|
|
|
|
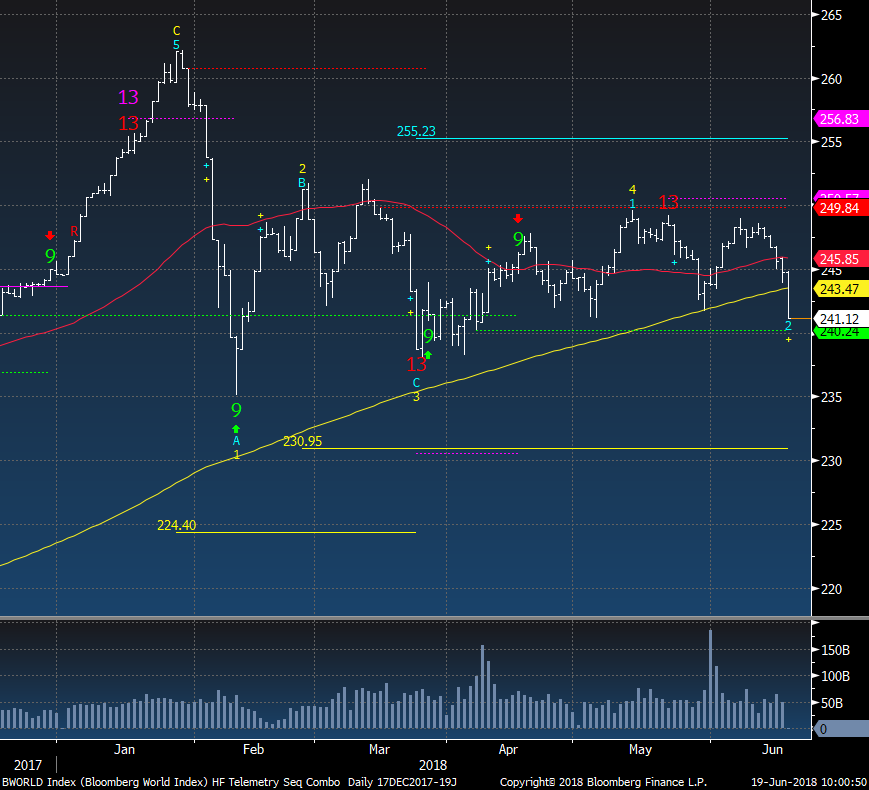
Bloomberg World Index now under the 200 day moving average, something it didn't do at other lows.
|
|
|
|
|
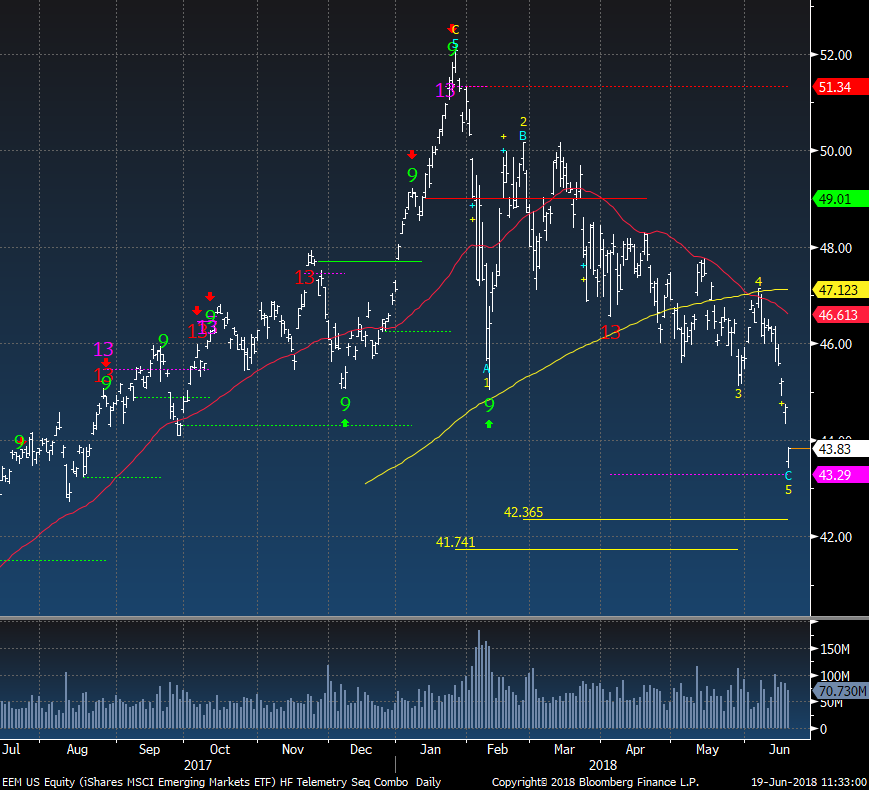
EEM Emerging Markets ETF back to 10 month lows.
|
|
|
|
|
|
|
Crude and Energy Thoughts
|
|
|
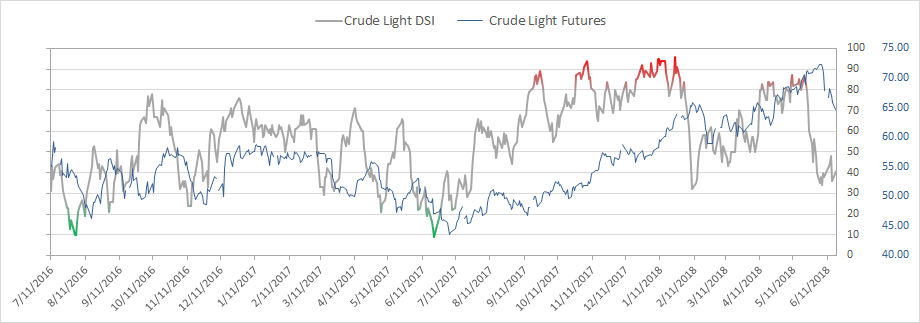
Crude bullish sentiment is at 41%
|
|
|
|
|
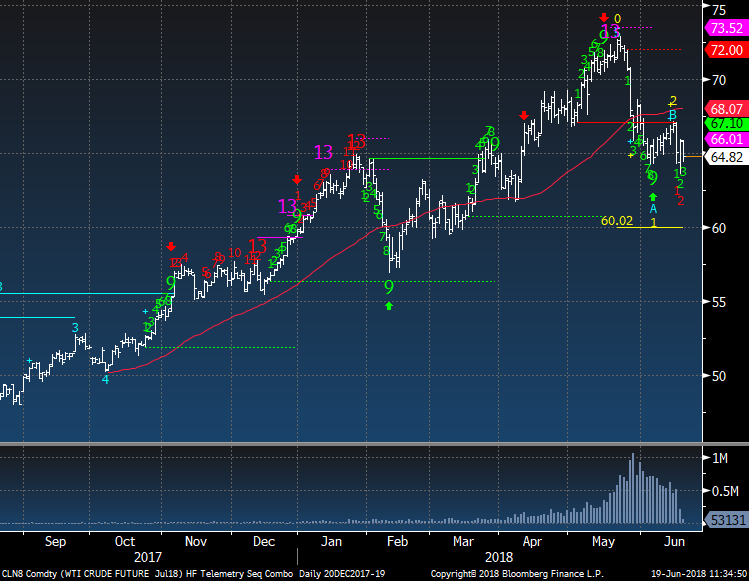
WTI Crude looks weak and is on day 2 of 13 with a downside Countdown.
|
|
|
|
|
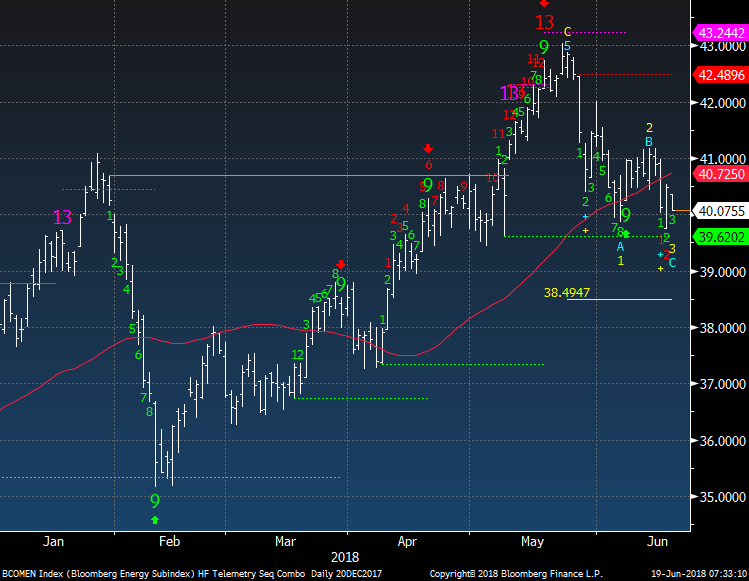
Bloomberg Energy Subindex also looks weak on day 2 of 13
|
|
|
|
|
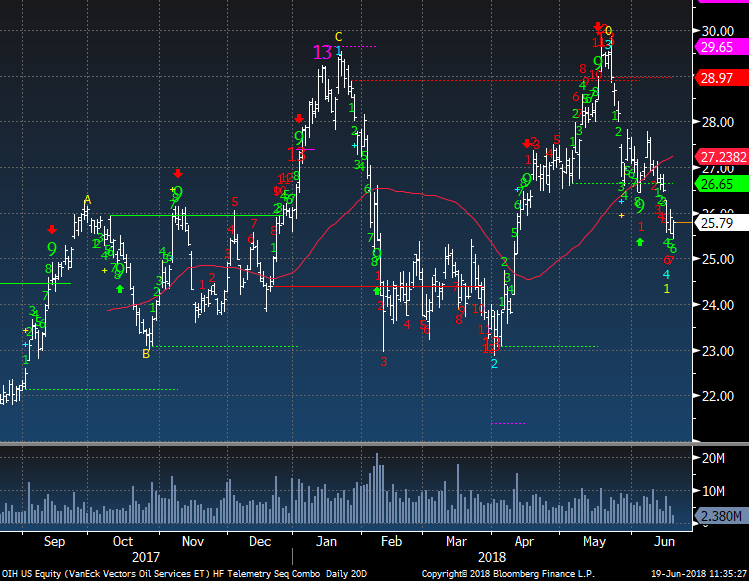
OIH Oil Service ETF is on day 7 of 13 with a downside Countdown. I have to say we caught price moves up and down well in this sector all year.
|
|
|
|
|
|
|
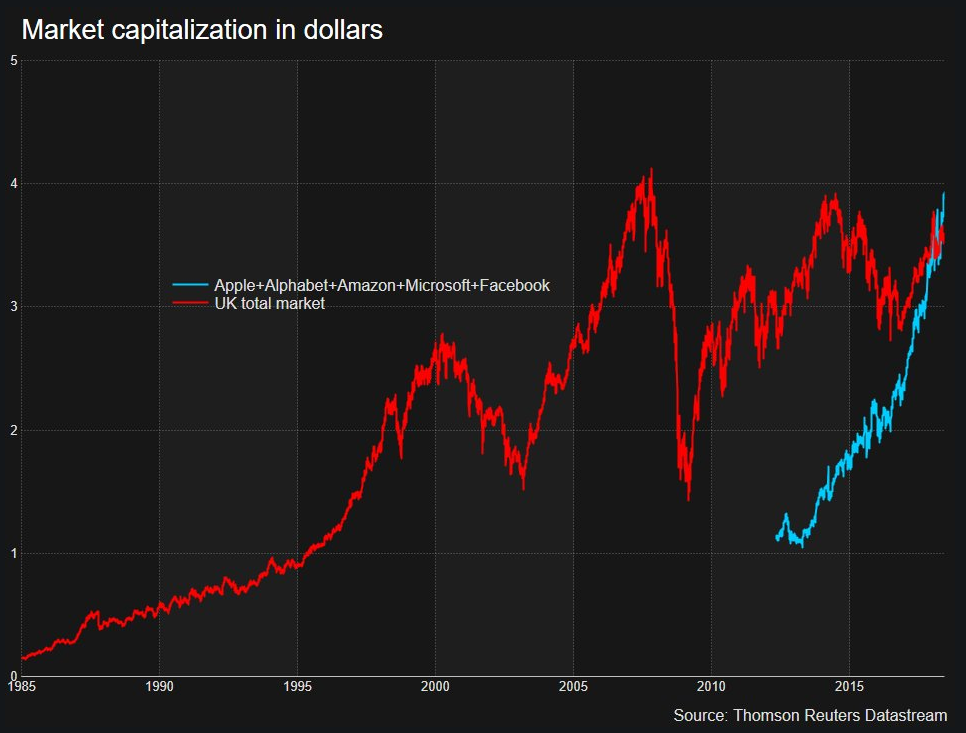
Now larger than the entire UK market
|
|
|
This is just incredible how Apple, Alphabet, Amazon, Microsoft and Facebook combined have a larger market cap than the entire UK market
|
|
|
|
|
|
|
|
|
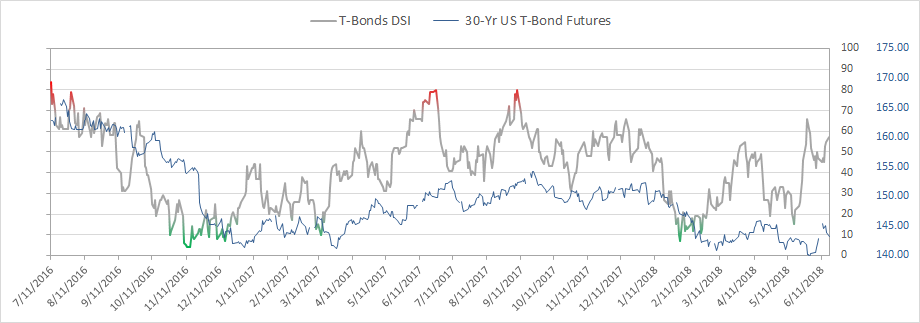
Bond bullish sentiment is at 57% should continue higher
|
|
|
|
|
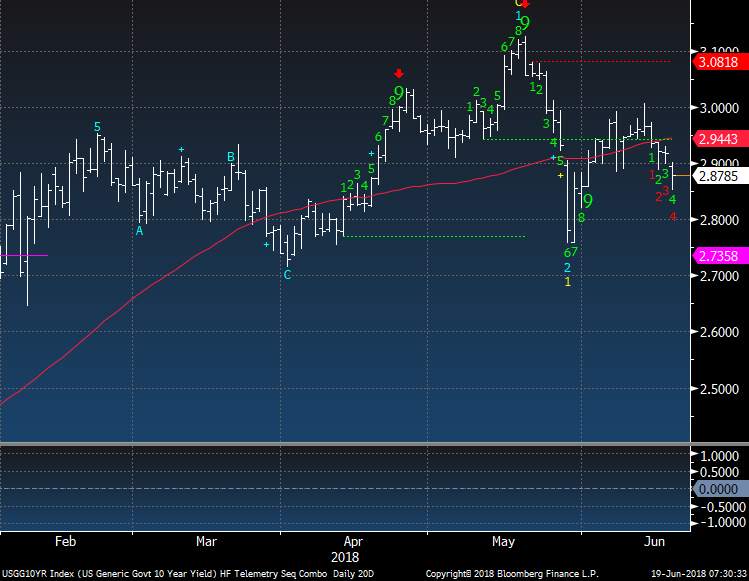
US 10 year yield is on day 4 of 13 with a downside Countdown - This is bullish for bonds
|
|
|
|
|
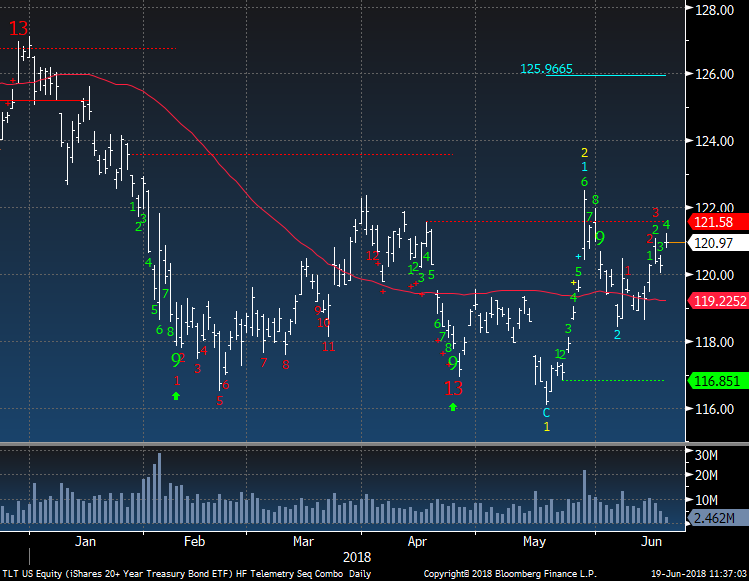
TLT Bond ETF is on day 3 of 13 with its upside Countdown. Still time to buy
|
|
|
|
|
|
|
DEMARK SCREENS - Daily, Weekly, Monthly Upside/Downside Exhaustion Signals
|
|
|
Daily/Weekly DeMark upside/downside exhaustion signals (Sequential) weekly updated on Monday's and monthly on the first day of the new month. Price flips occur when a stock closes higher/lower than four previous closes and increases conviction of a price turn.
The upside 13's are sell signals and downside 13's are buy signals. Price flip's are confirmation signals that increases potential for a price trend change. For example, if you are long a stock and there is an upside 13, you will want to take cautious action by selling down or out of a position. If initiating a short sale with the upside 13's, we tend to start with a 1/2 size and add with the downside price flip. The opposite is true for when there are downside 13's. Take a 1/2 size position
and add with the upside price flip. The DeMark Indicators are designed to assist the user with buying into weakness and selling into strength to anticipate trend exhaustion. Selling into a rally and buying into a decline often afford the opportunity to exit a trade without too serious a loss if wrong.
S&P 1500 Universe:
DAILY UPSIDE 13: AKAM, AWR, CLI, CRM, EGOV, HMSY, HUBG, K, LXP, M, POOL, RL, SHOO, VRTS, XOXO
DAILY DOWNSIDE 13: ARRS, GS, HF, LPX, OI
DAILY UPSIDE WITH PRICE FLIP REVERSAL DOWN: ADI, ADP, AZO, BGFV, HCI, HNI, ICUI, POST, SBRA
DAILY DOWNSIDE WITH PRICE FLIP REVERSAL UP: AVP, ITRI
Updated: 6/18/18
WEEKLY UPSIDE 13: ABT, AKAM, AMGN, KMPR, RMD, SYK
WEEKLY DOWNSIDE 13: NONE
Updated: 6/4/18
MONTHLY UPSIDE 13: BJRI, IDA, NSP, PFS, PVH, SCSC, SYY, TSCO, VDSI, VLO
MONTHLY DOWNSIDE 13: CLW, LQDT
Euro Stoxx 600 Universe:
DAILY UPSIDE 13: BEI GR, CARLB DC, ENG SM, RMV LN, SAN FP, SW FP
DAILY DOWNSIDE 13: AF FP, ASM NA, PAH3 GR, VOW3 GR
DAILY UPSIDE WITH PRICE FLIP REVERSAL DOWN: BNZL LN, CARLB DC, COLOB DC, DGE LN, DSV DC, ELE SM, HL/LN, LI FP, LUX IM, PGHN SW, SCHA NO
DAILY
DOWNSIDE WITH PRICE FLIP REVERSAL UP: NONE
Updated: 6/18/18
WEEKLY
UPSIDE 13: AI FP, CAP FP, DSV DC, OCI NA, OMV AV, RR/ LN, STMN, SW, UTDI
WEEKLY DOWNSIDE 13: NONE
Updated: 6/4/18
MONTHLY UPSIDE 13: ADS GR, AMEAS FH, AV/ LN, BVS LN, DG FP, HELN SW, HLMA LN, ITRK LN, LEG GR, NESTE FH
MONTHLY DOWNSIDE 13: NONE
|
|
|
Unsubscribe me from Hedge Fund Telemetry
Hedge Fund Telemetry LLC, P.O. Box 4675, Greenwich, CT 06861, United States
CONFIDENTIALITY NOTE and DISCLAIMER: This message is for the named person's use only. It may contain confidential, proprietary or legally privileged material. No confidentiality or privilege is waived by any accidental or unintentional transmission. If you receive this message in error, please immediately delete it and all copies of it from your system, destroy any hard copies and notify the sender. You must not, directly or indirectly, use, disclose,
distribute, print or copy any part of this message if you are not the intended recipient. Hedge Fund Telemetry LLC. cannot guarantee the confidentiality of the material transmitted; therefore, information of a sensitive or confidential nature should not be transmitted. There is risk in trading markets. Hedge Fund Telemetry LLC reports are based on information gathered from various sources and believed to be reliable, but are not guaranteed as to accuracy and completeness. The information is subject to change without notice and Hedge Fund Telemetry LLC has no obligation to provide any updates or changes. Hedge Fund Telemetry LLC is providing this data for informational and educational purposes and does not believe that it is sufficient to base an investment decision on. This information should not be regarded as a solicitation or recommendation of any particular security or to engage in any trading strategy. One should always check with your licensed financial
advisor to determine suitability of any investments.
|
|
|
|
|