|
|
|
|
|
|
|
|
One of the big risks I've been discussing that most people do not understand fully is liquidity risk. We got a taste of liquidity risk earlier this year with some strong dislocations around the world with equity markets. Surprisingly when that was happening, several other markets were very calm which is unusual. Those being currencies and bond markets. It's all different now as the US Dollar is rising and I expect it to continue to rise while bond yields seen traditionally as a
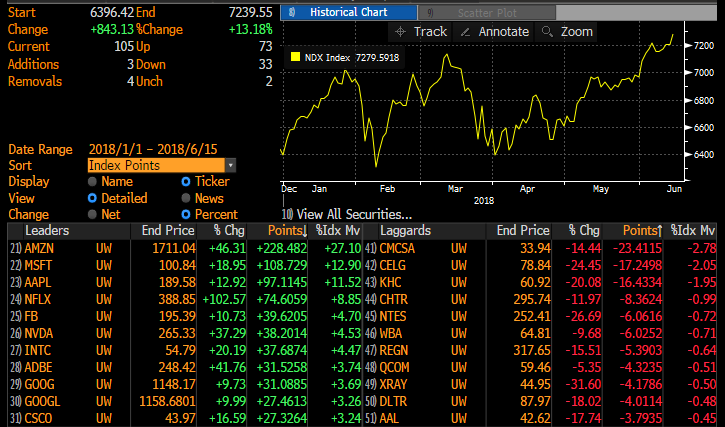
flight to safety are potentially starting to drop. I like the US and German 10 year as a safe place to hide right now. Remember Jeremy Grantham telling people to buy as much Emerging Markets as your career can handle? $750 million worth of EEM was sold yesterday and I would bet another huge number today as EEM is making an 8 month low. People have been successfully hiding in the US in the FANG mega cap tech stocks. Actually I shouldn't say hiding but rather crowding into these companies. The year to date attribution in the NDX is just astounding with the top three stocks attributing 50% of the total gain. I posted the data below.
Charles Himmelberg, Goldman Sach's head of Global Credit Strategy was recently quoted in the FT says "Liquidity is the new leverage... that historically leverage is the tinder that turns a financial fire into an inferno." His concerns go deep into overwhelming percentage algorithmic trading today and passive
fund popularity. What will happen when those algo's hit the sell button together? Like in the Terminator movie "Judgement Day... when all the computers became self aware..." I wonder when the sell button starts to get hit with the crowded FANG stocks. What took up the S&P and Nasdaq 100 with such large attribution could cause a real panic when people see magnified losses. I think that day is coming as I see increased signs of stress and topping signals. US Dollar strength, bond strength, and sectors that were strong like energy and financials really getting hit. On the other hand, I've been recommending buying boring consumer staples in the past month and those stocks are doing fine. Be careful out there, take some profits, raise a greater amount of cash than usual.
After this Daily Note, I will be sending the Hedge Fund Telemetry Weekly Currency Focus email. It's important to check out even if currencies are not your thing because it's
what is driving global markets again. Have a great weekend and thank you for your continued support. If you have a friend who you think would like Hedge Fund Telemetry, please get them on board too!
Notable:
- US Markets - Sentiment elevated, seeing upside exhaustion again on daily and weekly. Attribution within NDX is absurd
- Hedge Fund Telemetry Trade Ideas - Stopped out of NFLX, added 5% AAPL and QQQ late yesterday short
- Blame the Computers
- European Markets
- Asian Markets
- Internals Topping Too
- Boring Old Consumer Staples - It's working
- The End Of The World Charts
- Emerging Markets EEM - Update
- Brazil Update
- Crude Update
- Gold Update
- Currencies
- Bond Update - Bond rally starting
- DeMark Screens - Daily, Weekly, Monthly upside/downside exhaustion signals within the S&P 1500 and Euro Stoxx 600
|
|
|
|
|
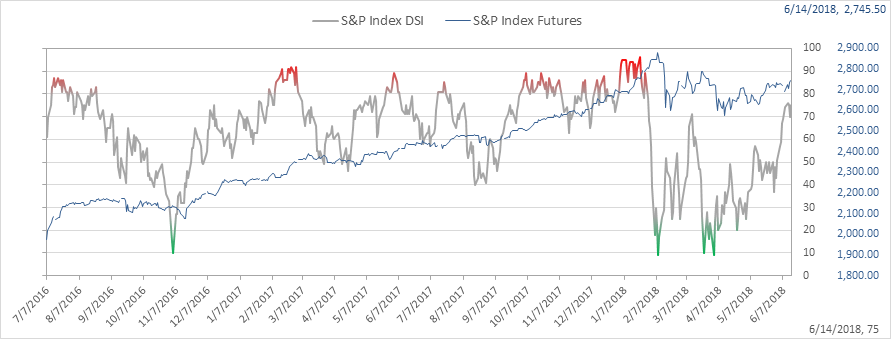
Here's a link to the Hedge Fund Telemetry market sentiment page with 40 charts of sentiment including equities, bonds, currencies, and commodities updated each day.
SPX bullish sentiment is at 75% and is elevated
|
|
|
|
|
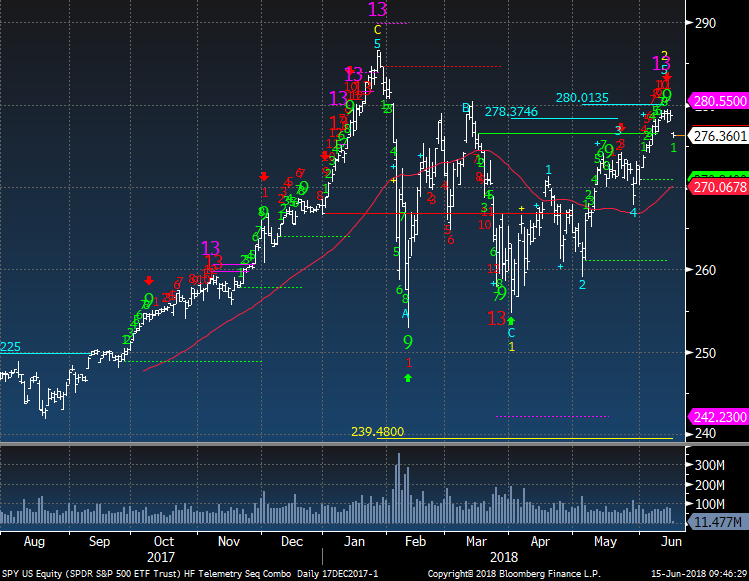
SPY gapping down today after upside Combo 13 and green Setup 9. The red Sequential remains on day 11 of 13.
|
|
|
|
|
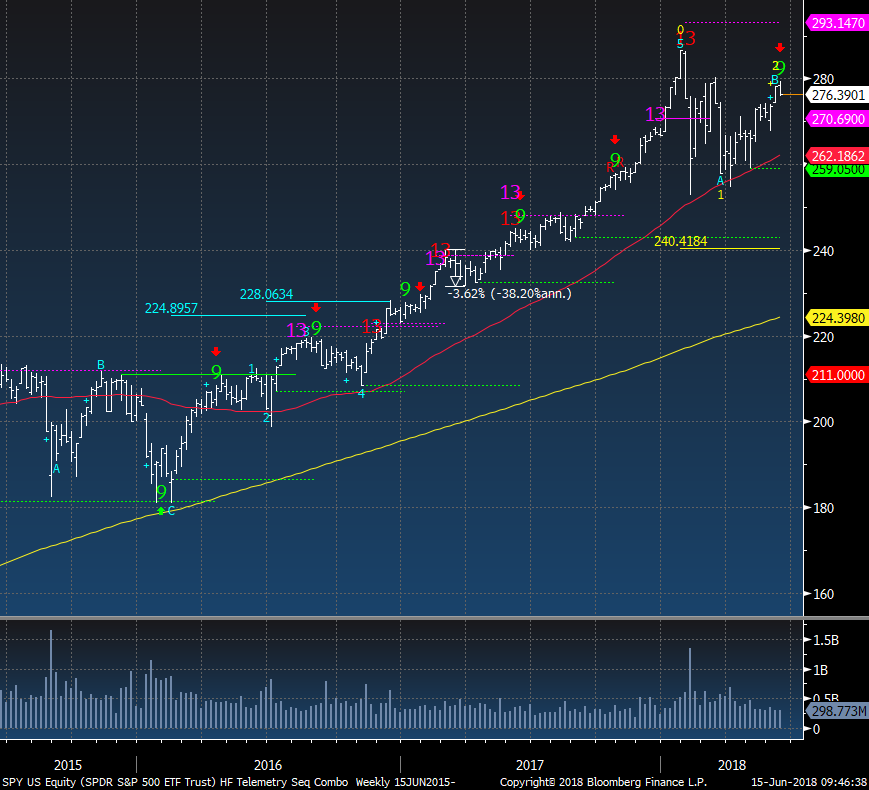
Weekly SPY has potentially a lower high here within a corrective wave 2 bounce that could be followed by wave 3 with a price objective of 240.
|
|
|
|
|
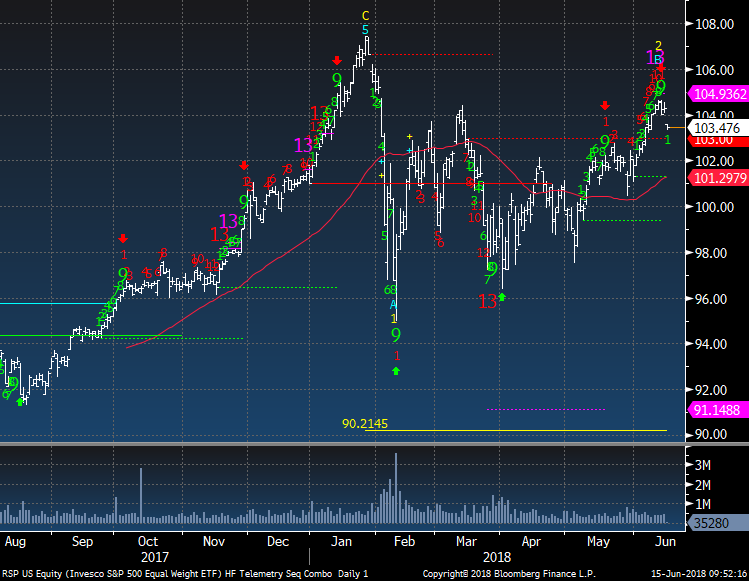
RSP SPX equal weight looks similar with Countdowns. A wave 3 potential downside price objective is about 15% lower
|
|
|
|
|
Nasdaq bullish sentiment is at 77% and is getting very elevated
|
|
|
|
|
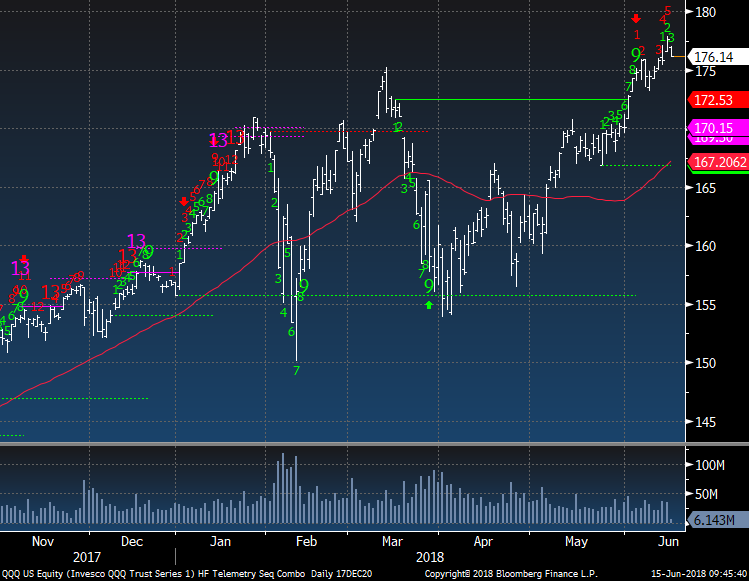
QQQ remains on day 5 of 13 with an upside red Sequential Countdown. I feel this could continue but a choppy pullback might also happen.
|
|
|
|
|
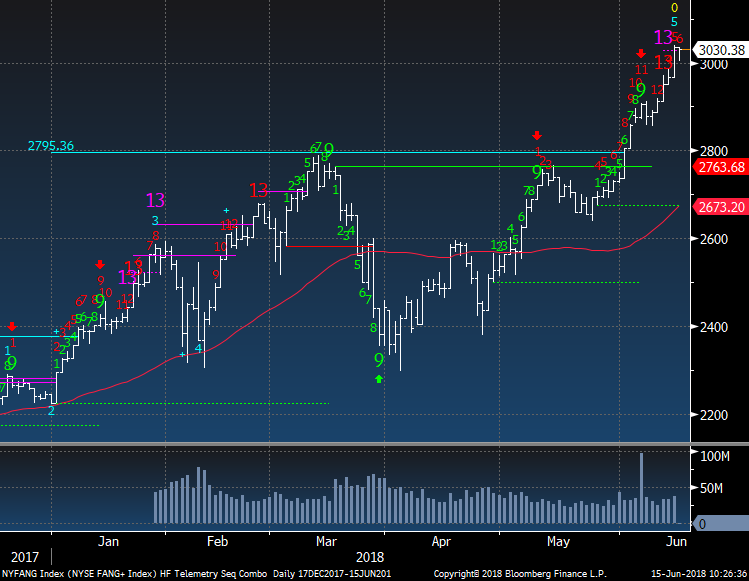
FANG + Index had upside exhaustion yet there is a new secondary Countdown on day 6 of 13. I take all 13's seriously and will see if the first one will play out. The strength of this index is astounding... for now
|
|
|
|
|
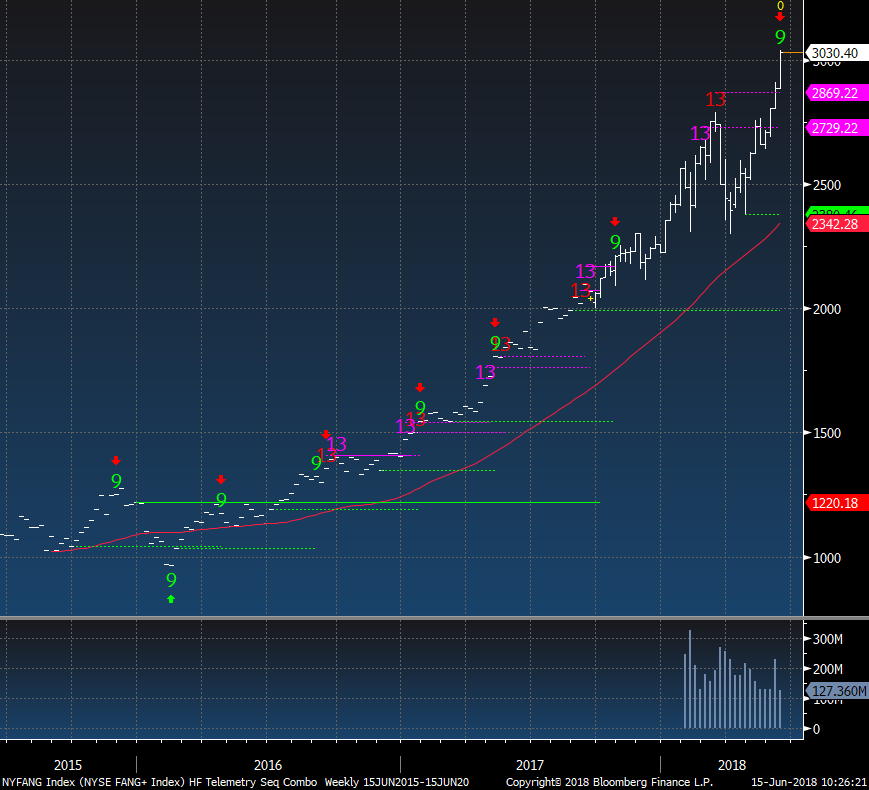
Weekly FANG+ has a green Setup 9 and this could and should see some sort of stalling or pullback. Parabolic? YES
|
|
|
|
|
NDX Attribution YTD shows the top weights and the % of the index move. AMZN is 27% and so on. It's also showing 73 up 33 down. The Dow shows about even breadth for the year and the SPX is at 279/237 so nearly even too. The Russell 200 has 1250/767 up down and I'd expect that one to be a little better considering the move
|
|
|
|
|
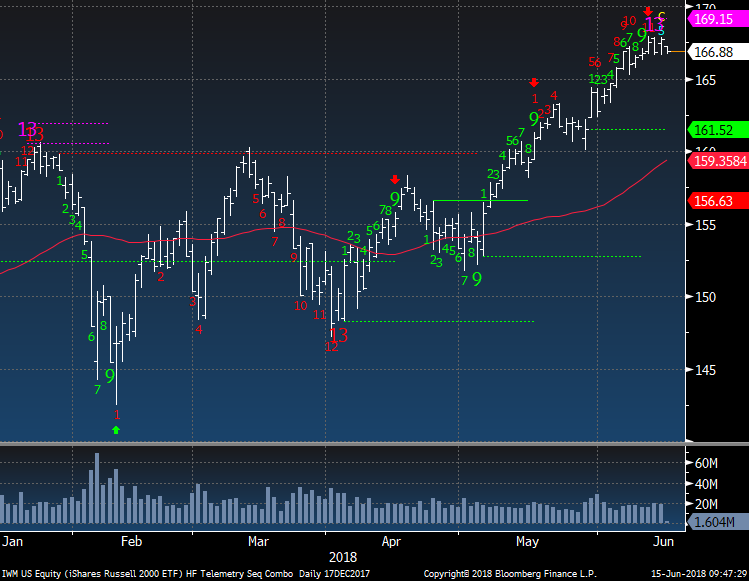
IWM Russell 2000 ETF also has the pink Combo exhaustion 13 while the red Sequential is on day 11 of 13.
|
|
|
|
|
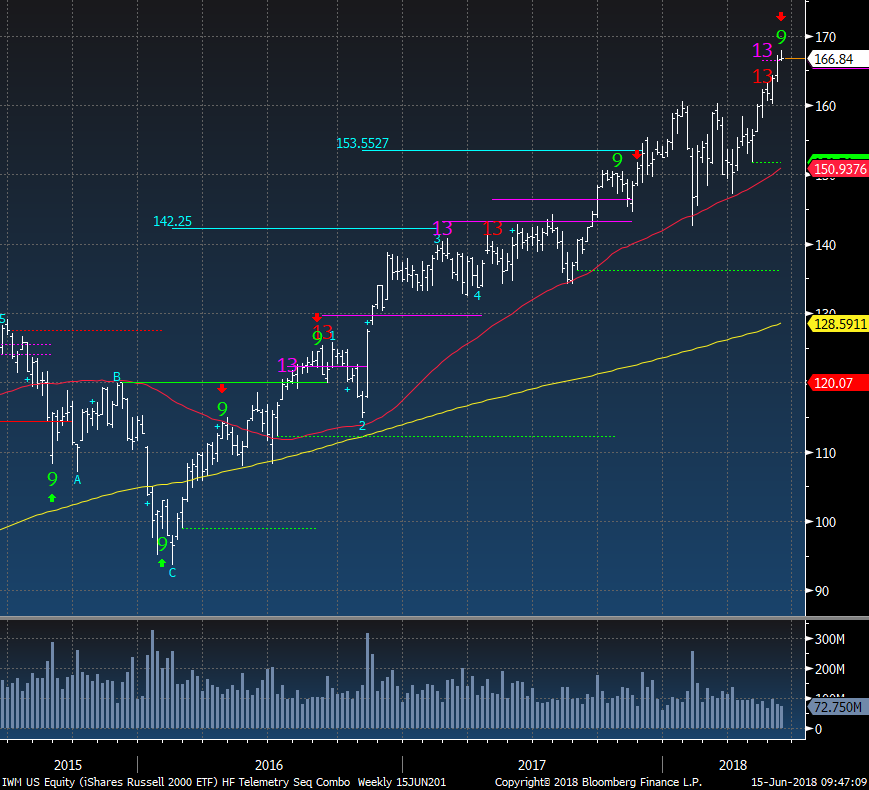
Weekly IWM shows some upside 13's still in play and a green Setup 9 too this week. A pullback in near
|
|
|
|
|
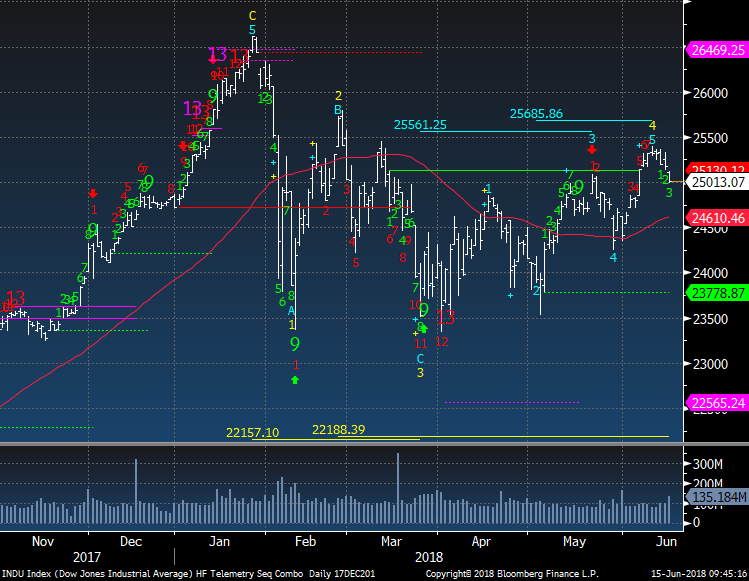
Dow Jones has reversed down and should make a run at the 50 day.
|
|
|
|
|
|
|
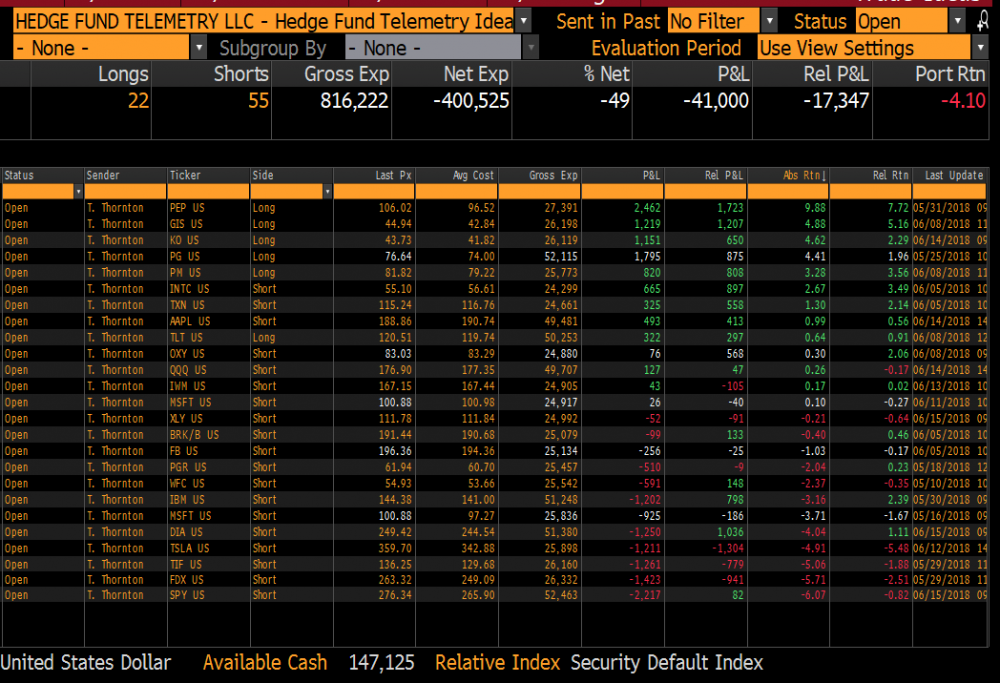
Hedge Fund Telemetry Trade Ideas
|
|
|
Trade Ideas - stopped on NFLX, added late yesterday 5% size QQQ and AAPL
|
|
|
|
|
|
|
|
|
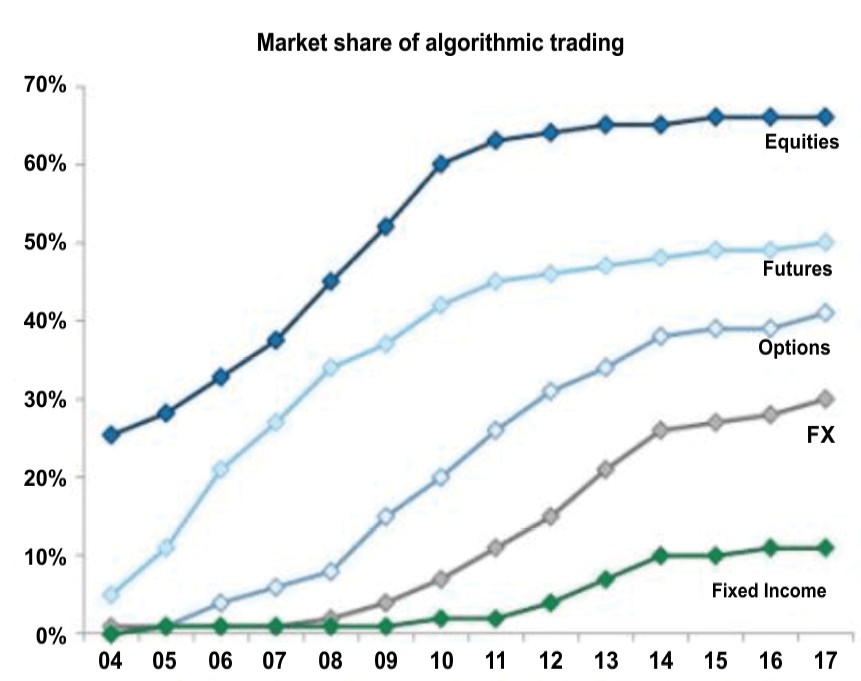
Market Share of algo trading is quite high and I believe people will blame computers when they hit the sell button. The blamed computers in 1987 so why not again?
|
|
|
|
|
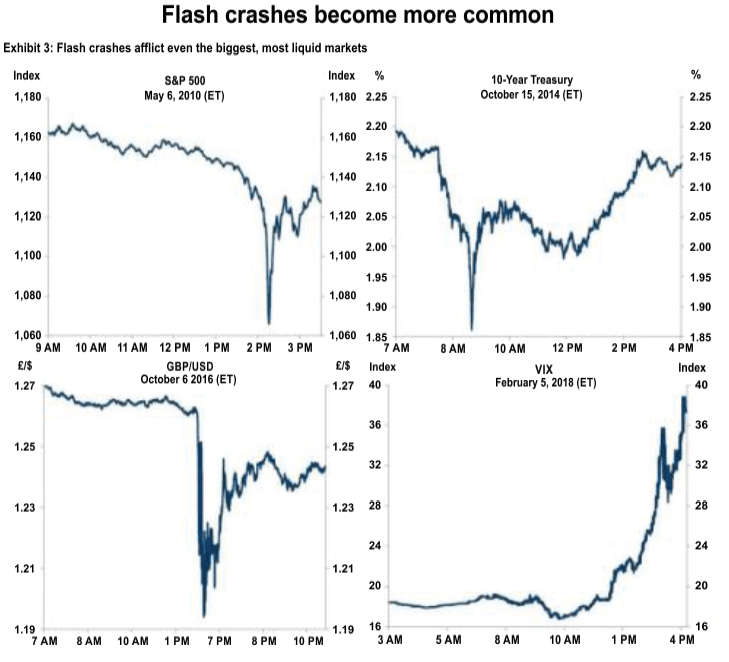
Flash Crashes due to lack of liquidity could become more common. Charts from 13d Research
|
|
|
|
|
|
|
|
|
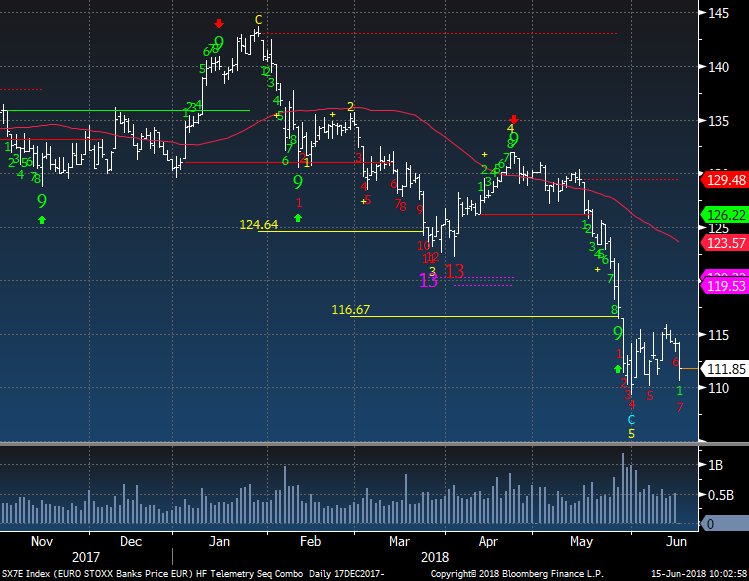
European Banks continue to look terrible and has a downside red Countdown on day 7 of 13
|
|
|
|
|
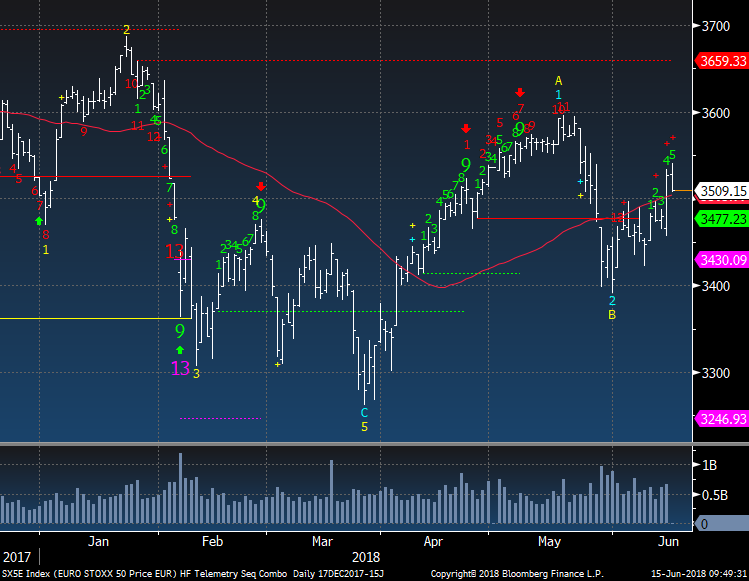
Euro Stoxx 50 has been making a series of lower highs. It doesn't look terrible but I see risk here if next week fails to go up
|
|
|
|
|
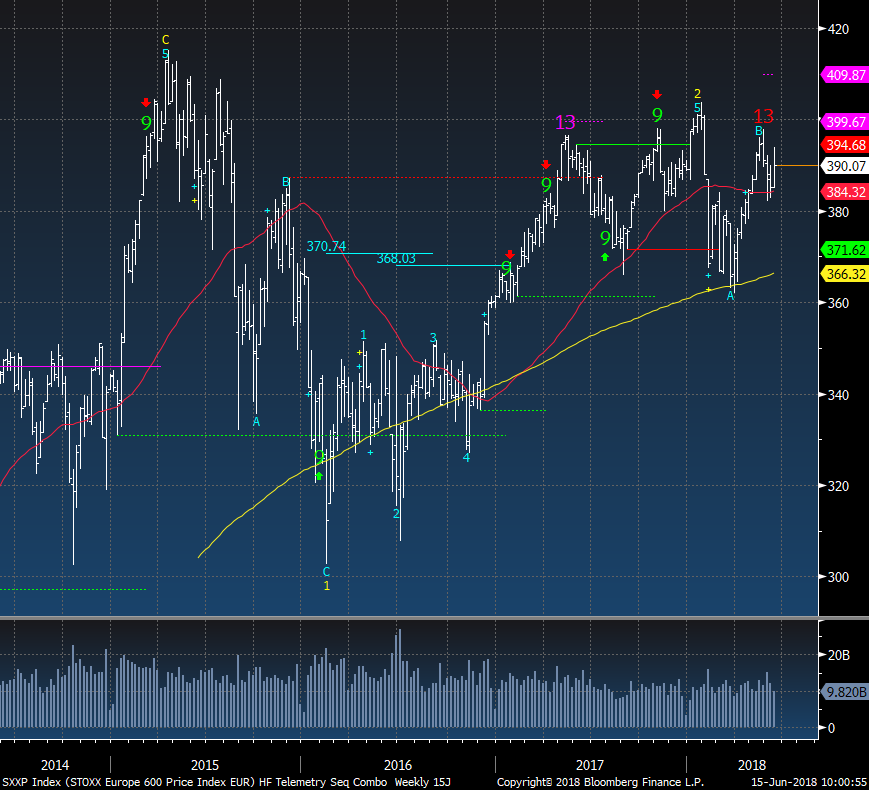
Euro Stoxx 600 weekly has a weekly upside exhaustion signal still in play. Look at the drop in 2015 and that is a lack of liquidity.
|
|
|
|
|
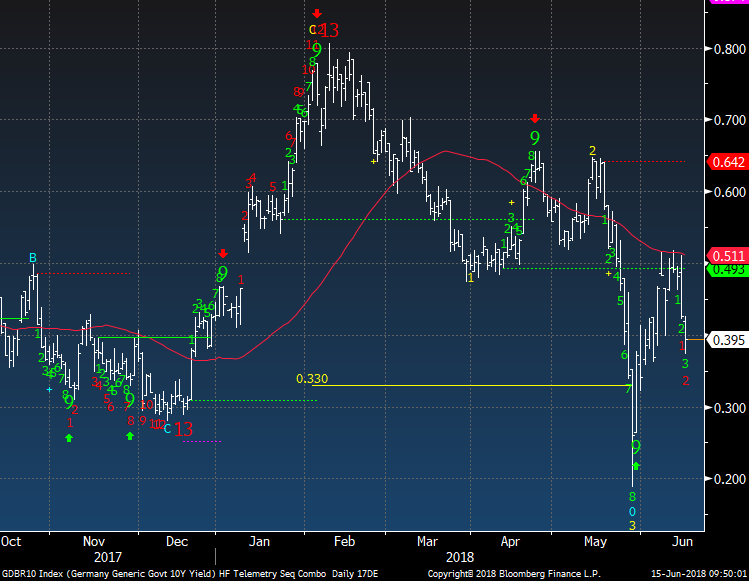
German 10 Year Yields are moving lower as a sign of risk off.
|
|
|
|
|
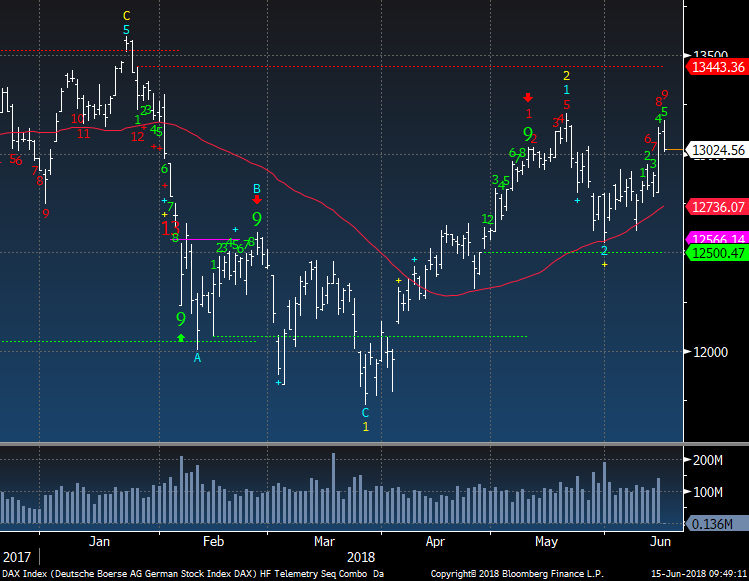
German DAX Index has been trading OK yet is on day 9 of 13 with an upside Countdown
|
|
|
|
|
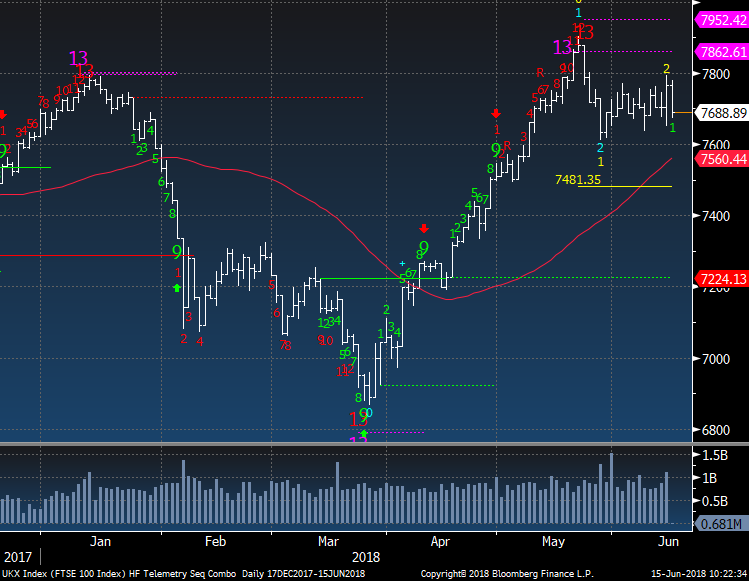
UK has been going sideways after the recent upside exhaustion signals. A break of 7600 would not be good
|
|
|
|
|
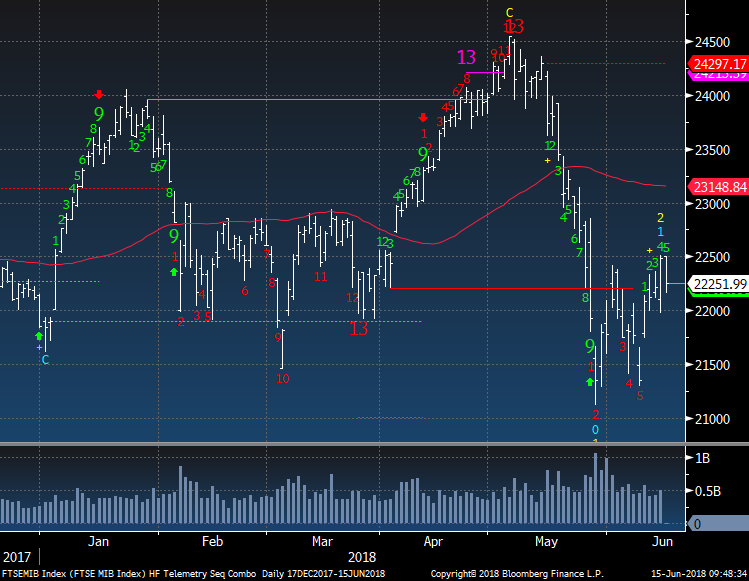
Italy still looks the most dangerous to the downside
|
|
|
|
|
|
|
|
|
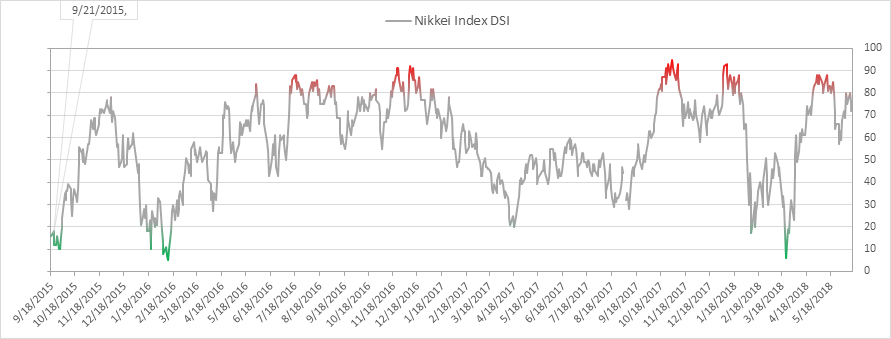
Nikkei bullish sentiment is at 75% and could be making another lower high
|
|
|
|
|
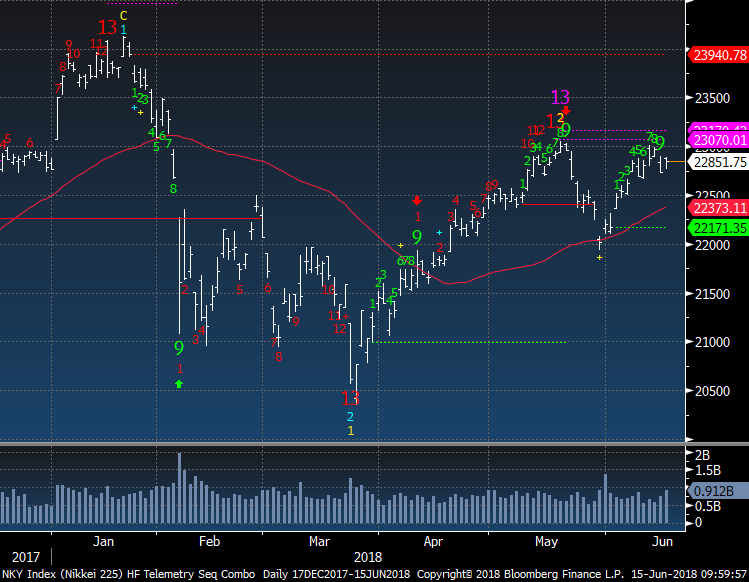
Nikkei Index stalled after the recent green Setup 9. I see risk here unless it can move above May high.
|
|
|
|
|
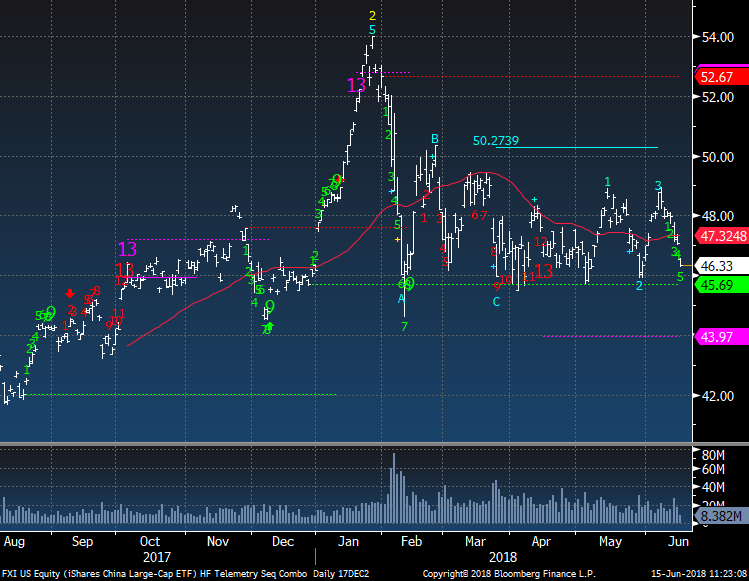
FXI Hong Kong China ETF has been going sideways and I thought it could be bought but now it seems to be failing so I'm neutral again
|
|
|
|
|
|
|
|
|
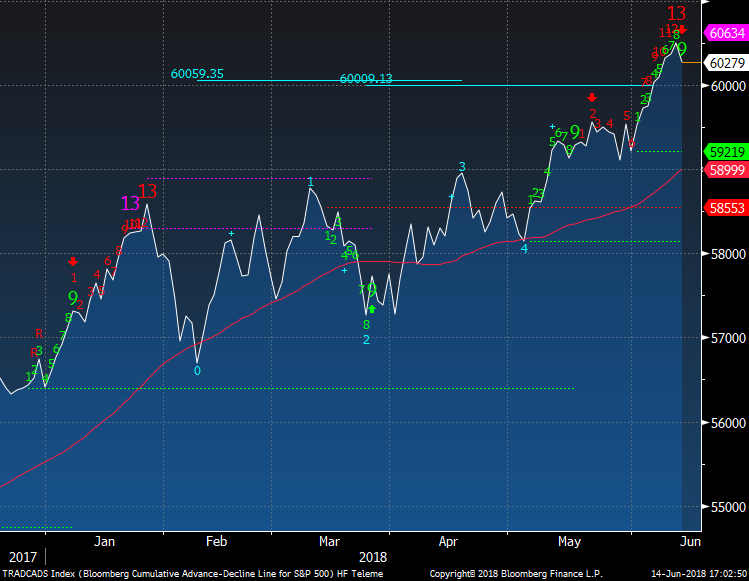
SPX cumulative breadth has some upside exhaustion signals like we had in January at the highs
|
|
|
|
|
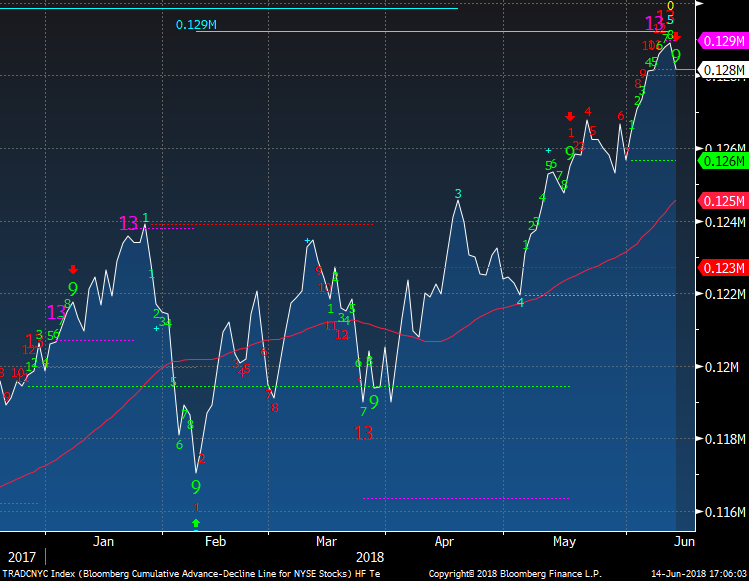
NYSE cumulative breadth also has the same signals as January
|
|
|
|
|
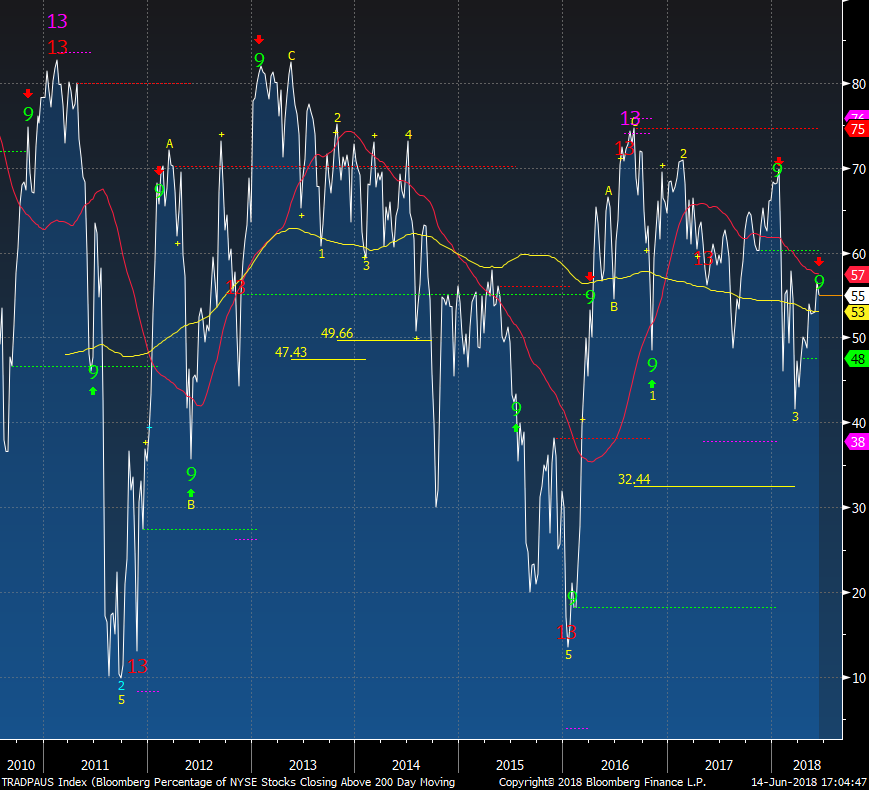
% of stocks above the 200 day with NYSE stocks is only at 55%. This weekly chart has worked well with both green Setups and red/pink Countdowns at inflection points.
|
|
|
|
|
|
|
Boring old Consumer Staples
|
|
|
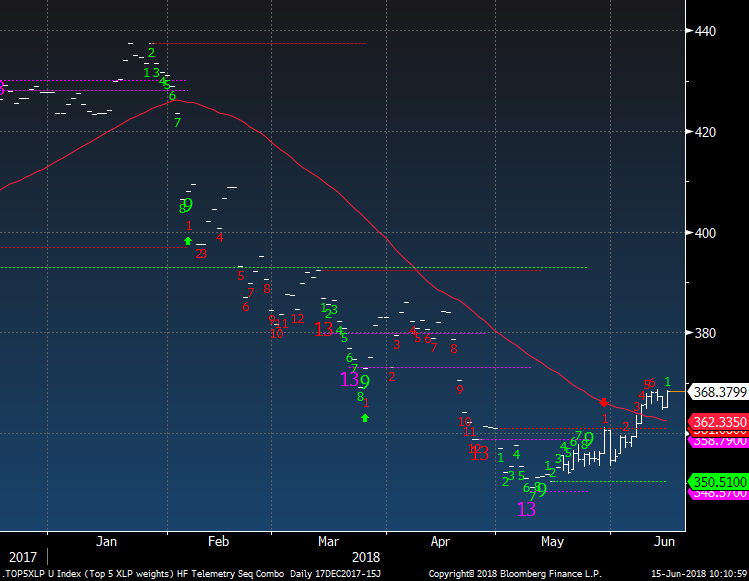
The custom index of the top 5 consumer staples continues to act well on the long side. PG, KO, PEP, WMT, MO
|
|
|
|
|
|
|
The End of the World Charts
|
|
|
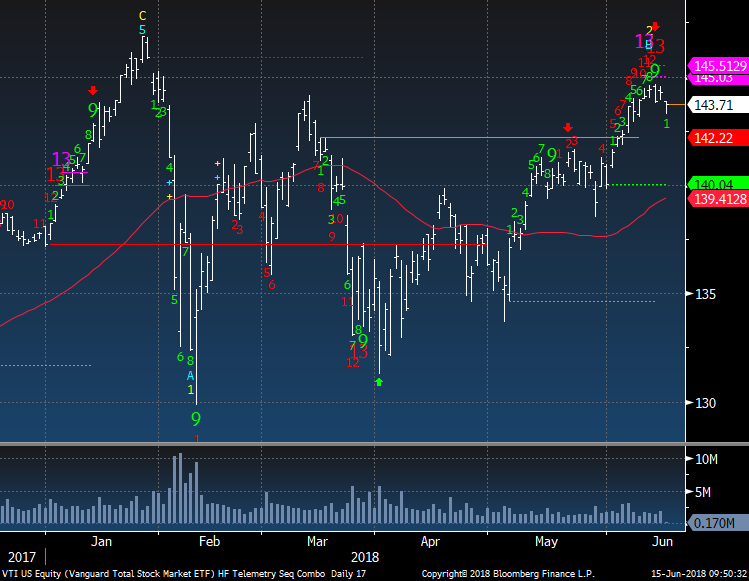
Vanguard Total Stock Market Index has all sorts of upside exhaustion and it's flipping down now too.
|
|
|
|
|
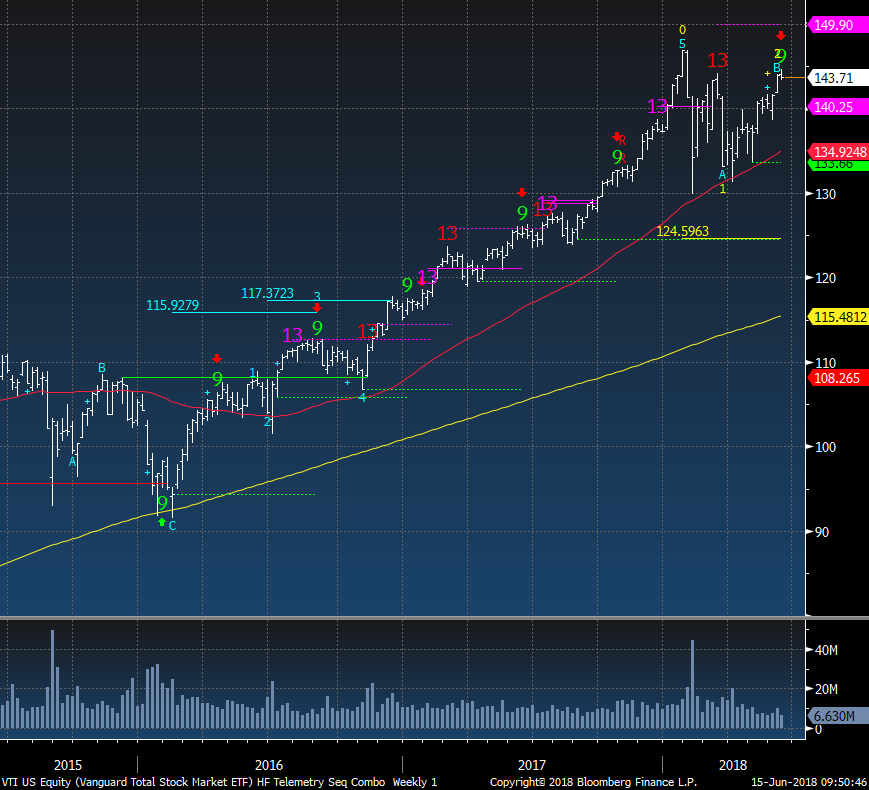
The weekly also has a lower high and green Setup 9. The wave 3 price objective is 124.59 and that would sting
|
|
|
|
|
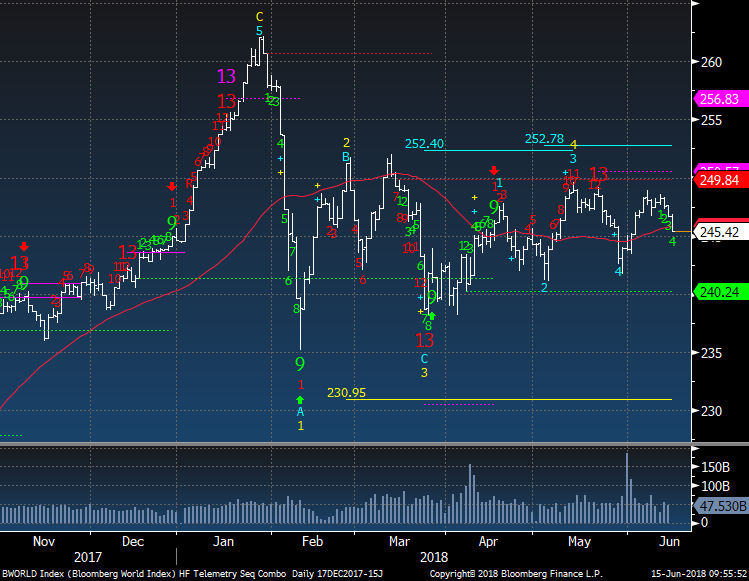
Bloomberg World Index has been going sideways and has broken the 50 day today.
|
|
|
|
|
|
|
|
|
Breaking down further with a downside wave 5 price objective of 42.65
|
|
|
|
|
|
|
|
|
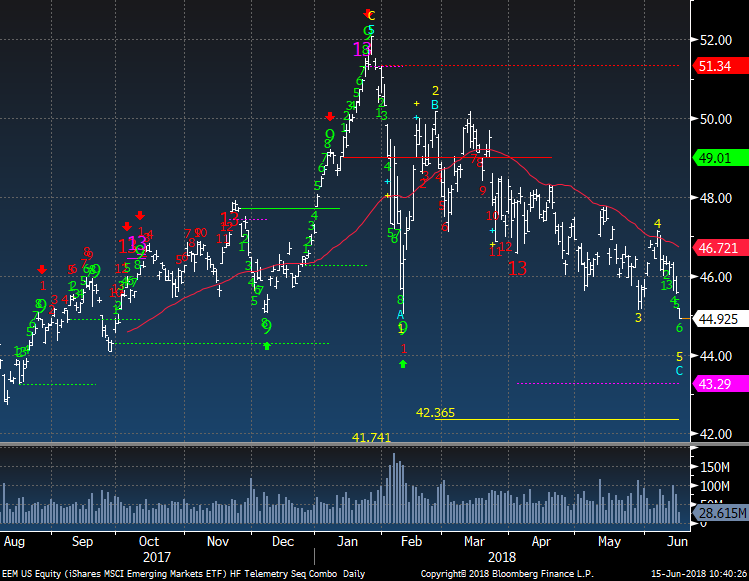
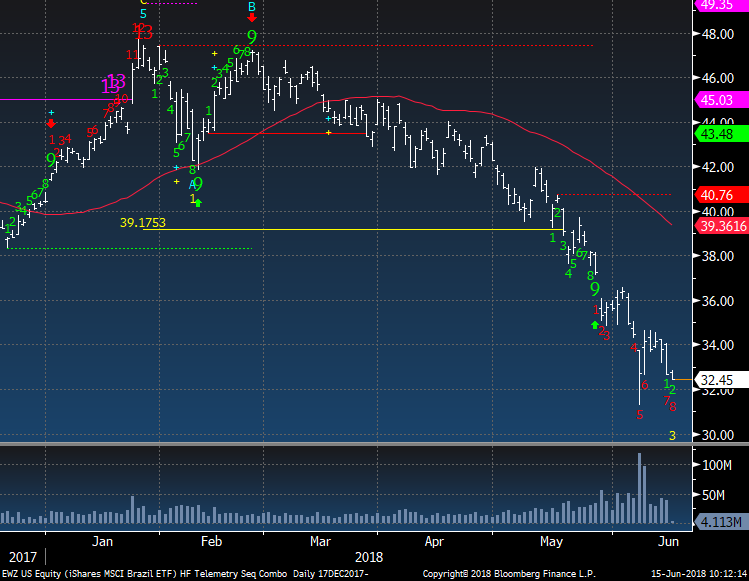
Brazil EWZ still has no signs of a bottom with it on day 8 of 13 with a downside Countdown. I've been negative on Brazil since the beginning of the year.
|
|
|
|
|
|
|
|
|
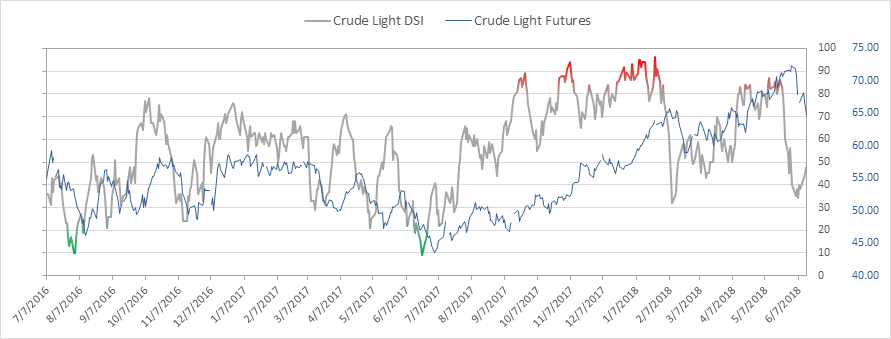
Crude bullish sentiment is at 48% and up from the recent low of 35% and high of 86%.
|
|
|
|
|
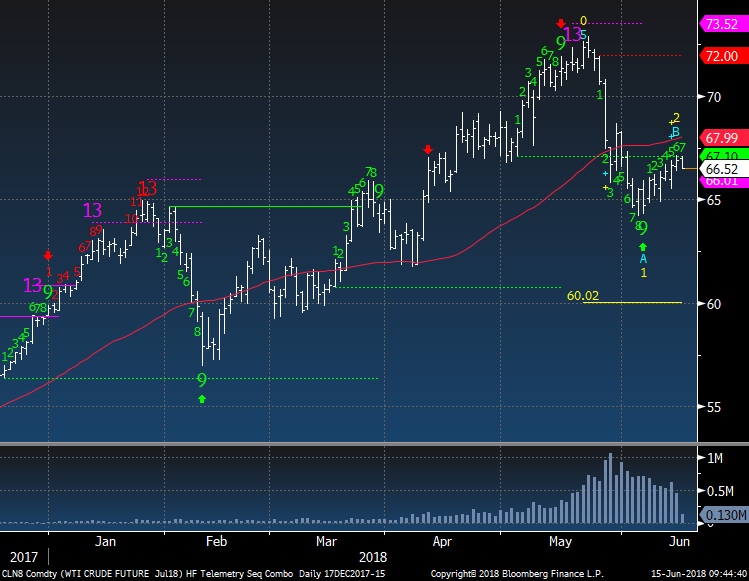
Crude now has a potential downside wave 3 price objective of 60.
|
|
|
|
|
|
|
|
|
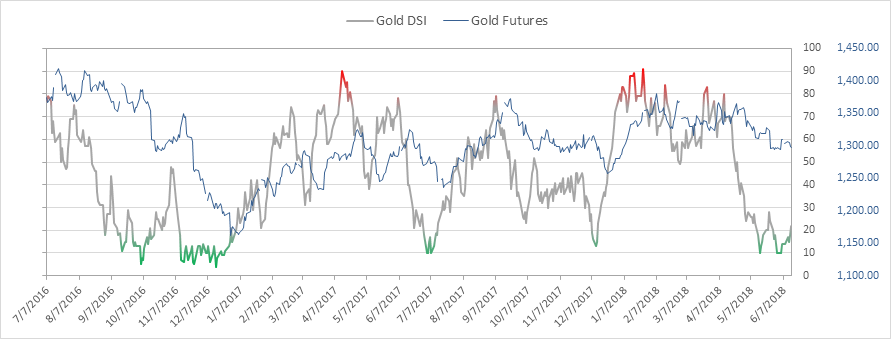
Gold bullish sentiment is at 22% and up from the recent low of 10%. I saw a lot of people mention the low in sentiment as a buying opportunity. I didn't want to buy with the downside DeMark Countdown in progress.
|
|
|
|
|
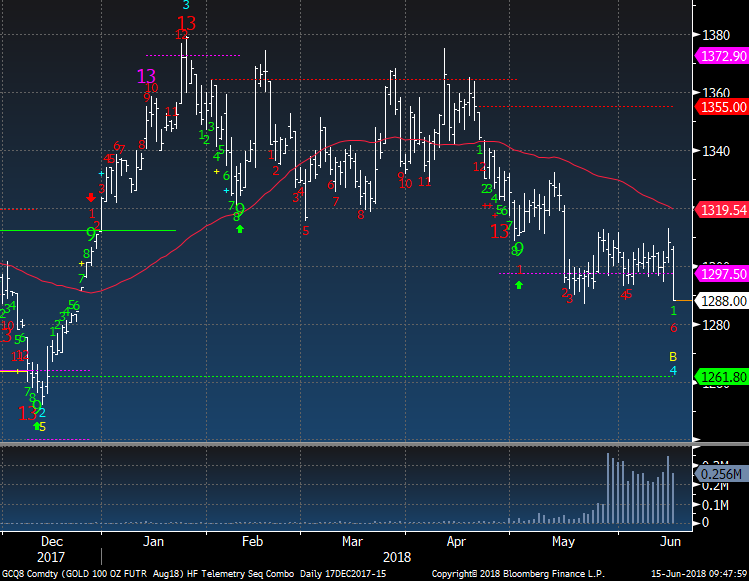
Gold Futures is now on day 8 of 13 with its downside Countdown. Wait for the 13 on the downside. That combination of low sentiment and downside exhaustion was the reason I recommended a long trade in December.
|
|
|
|
|
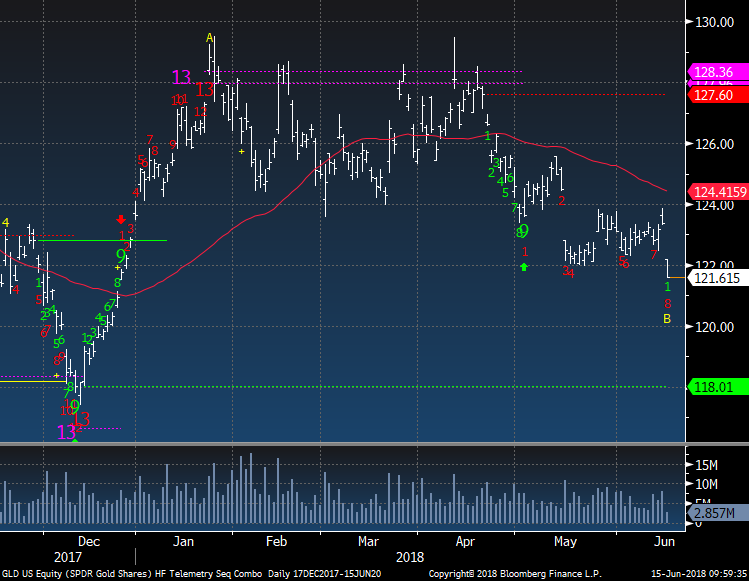
GLD is in sync with the Gold Futures too
|
|
|
|
|
|
|
|
|
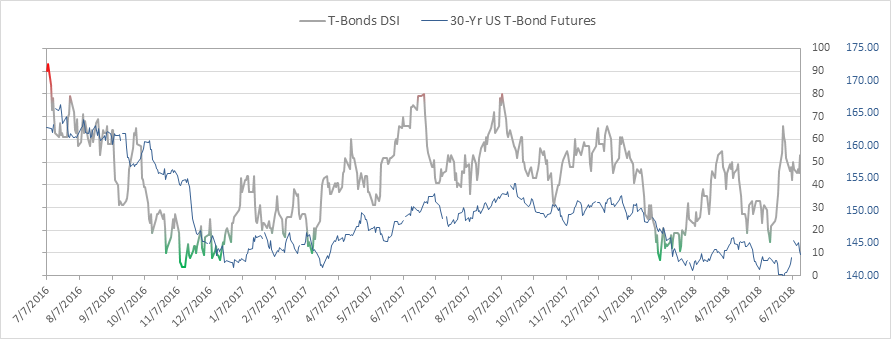
Bond bullish sentiment is at 53% and back above 50%. I expect a run to 70% or higher
|
|
|
|
|
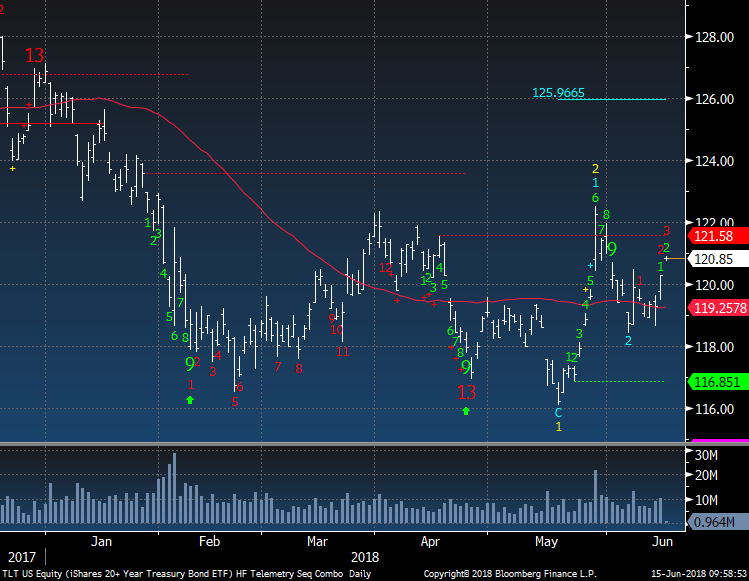
TLT Bond ETF now is on day 3 of 13 with an upside red Sequential Countdown. I like this still as a buyable long.
|
|
|
|
|
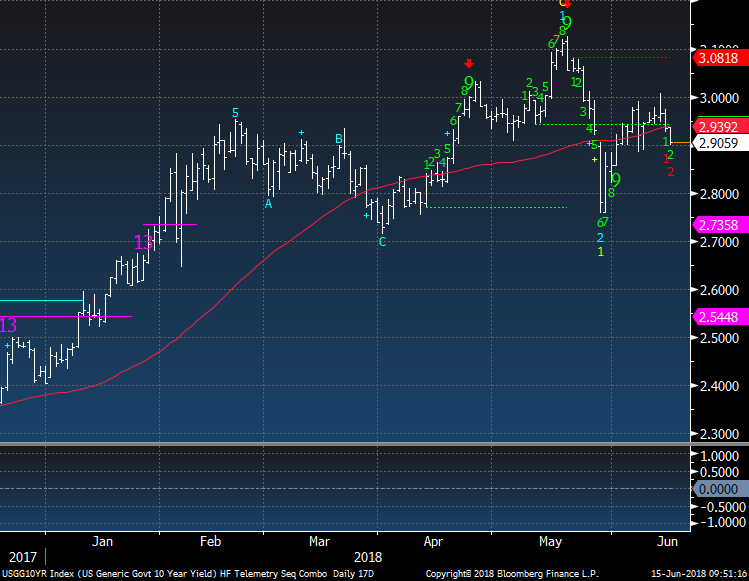
US 10 Year Yields now have a downside Countdown on day 2 of 13. Bond rally is starting.
|
|
|
|
|
|
|
DEMARK SCREENS - Daily, Weekly, Monthly Upside/Downside Exhaustion Signals
|
|
|
Daily/Weekly DeMark upside/downside exhaustion signals (Sequential) weekly updated on Monday's and monthly on the first day of the new month. Price flips occur when a stock closes higher/lower than four previous closes and increases conviction of a price turn.
The upside 13's are sell signals and downside 13's are buy signals. Price flip's are confirmation signals that increases potential for a price trend change. For example, if you are long a stock and there is an upside 13, you will want to take cautious action by selling down or out of a position. If initiating a short sale with the upside 13's, we tend to start with a 1/2 size and add with the downside price flip. The opposite is true for when there are downside 13's. Take a 1/2 size position
and add with the upside price flip. The DeMark Indicators are designed to assist the user with buying into weakness and selling into strength to anticipate trend exhaustion. Selling into a rally and buying into a decline often afford the opportunity to exit a trade without too serious a loss if wrong.
S&P 1500 Universe:
DAILY UPSIDE 13: ADP, AIT, CPRT, CSCO, FICO, ICUI, JJSF, MSI, PTC, SAM, SWX, TECH
DAILY DOWNSIDE 13: FULT, MHK, MHO, PB, SJM, TGI
DAILY UPSIDE WITH PRICE FLIP REVERSAL DOWN: AEO, CLGX, GM, IT, JNPR, MRK, MUR, SON, SSD, TFX, THC, UA
DAILY DOWNSIDE WITH PRICE FLIP REVERSAL UP: NONE
Updated: 6/11/18
WEEKLY UPSIDE 13: ABT, AKAM, AMGN, KMPR, RMD, SYK
WEEKLY DOWNSIDE 13: NONE
Updated: 6/4/18
MONTHLY UPSIDE
13: BJRI, IDA, NSP, PFS, PVH, SCSC, SYY, TSCO, VDSI, VLO
MONTHLY DOWNSIDE 13: CLW, LQDT
Euro Stoxx 600 Universe:
DAILY
UPSIDE 13: AI FP, BNZL LN, DGE LN, DSM NA, ITX SM, KSP ID, MCRO LN, PHIA NA
DAILY DOWNSIDE 13: GLE FP, LLOY LN
DAILY UPSIDE WITH PRICE FLIP REVERSAL DOWN: NONE
DAILY DOWNSIDE WITH PRICE FLIP REVERSAL UP: BMW GR, DIA SM, LLOY LN
Updated: 6/11/18
WEEKLY UPSIDE 13: EKTAB SS, HLMA LN
WEEKLY DOWNSIDE 13: HMB SS, MAP SM
Updated: 6/4/18
MONTHLY UPSIDE 13: ADS GR, AMEAS FH, AV/ LN, BVS LN, DG FP, HELN SW, HLMA LN, ITRK LN, LEG GR, NESTE FH
MONTHLY DOWNSIDE 13: NONE
|
|
|
Unsubscribe me from Hedge Fund Telemetry
Hedge Fund Telemetry LLC, P.O. Box 4675, Greenwich, CT 06861, United States
CONFIDENTIALITY NOTE and DISCLAIMER: This message is for the named person's use only. It may contain confidential, proprietary or legally privileged material. No confidentiality or privilege is waived by any accidental or unintentional transmission. If you receive this message in error, please immediately delete it and all copies of it from your system, destroy any hard copies and notify the sender. You must not, directly or indirectly, use, disclose,
distribute, print or copy any part of this message if you are not the intended recipient. Hedge Fund Telemetry LLC. cannot guarantee the confidentiality of the material transmitted; therefore, information of a sensitive or confidential nature should not be transmitted. There is risk in trading markets. Hedge Fund Telemetry LLC reports are based on information gathered from various sources and believed to be reliable, but are not guaranteed as to accuracy and completeness. The information is subject to change without notice and Hedge Fund Telemetry LLC has no obligation to provide any updates or changes. Hedge Fund Telemetry LLC is providing this data for informational and educational purposes and does not believe that it is sufficient to base an investment decision on. This information should not be regarded as a solicitation or recommendation of any particular security or to engage in any trading strategy. One should always check with your licensed financial
advisor to determine suitability of any investments.
|
|
|
|
|