|
|
|
|
|
|
Currency reversals lifting equities
|
|
|
Recently we have been highly focused on the currency market leading other markets. As we have clearly laid out the anticipated DeMark exhaustion signals triggering yesterday and today combined with extreme sentiment, the turn is no surprise. Euro bullish sentiment hit 4% and US Dollar hit 94% - multi year extremes. This combination happens at certain times with various assets. Recall S&P and NDX bullish sentiment in January at 95% combined with the upside exhaustion
signals. As much as I wish I could get more excited the risks remain since the US Dollar pullback will be more of a corrective pullback or wave 4 of 5. This is not an all clear signal as the current US Dollar trend higher will resume soon. The problems in Europe are not over and potentially just beginning a new phase. But the bounce in the Euro and US Dollar weakness has had some CNBC commentators say things are "calming in Europe."
US equity markets are seeing strong bounces specifically with some of the most beaten down sectors - Financials and Energy. As mentioned in recent past notes, there are several daily upside exhaustion Countdowns that are progress specifically Russell 200 IWM and FANG Indexes. The Financial sector has been one of my favorite
places to be short this year and there have been some downside exhaustion signals that I have used to cover shorts successfully. Speaking of covering shorts, today I stopped out of the QQQ and IWM and took profits with few others which I discuss further below. After nailing the top this year within a day, the last short entry on a few indexes were poorly timed. My thought is to clear my head and sit tight on a some cash to redeploy as signals develop.
My recent view is that I will allow the pending upside exhaustion signals to complete with a few indexes and stocks and watch the US Dollar for it to confirm the corrective move into wave 4. Again, this is not an all clear by any means. This Summer is going to not be dull as it will be loaded with opportunities in every market.
Notable:
US Markets - Bounce in weakest sectors of late. Sentiment should be back to 50% level tonight, IWM has a pending upside Countdown exhaustion. Some upside wave price objectives are now clear. The downside waves are still in play too. That is what you get with a sideways market.
Hedge Fund Telemetry Trade Ideas - Took off some shorts a couple wins and a few loses.
European Markets - When I hear "stabilizing" and look at the charts in Europe I have to laugh
Currencies - Mega extreme sentiment combined with exhaustion signals is a high conviction trade.
Asian
Markets - Nikkei should bounce off 50 day, Hang Seng and Shanghai both have downside exhaustion today.
Crude Thoughts
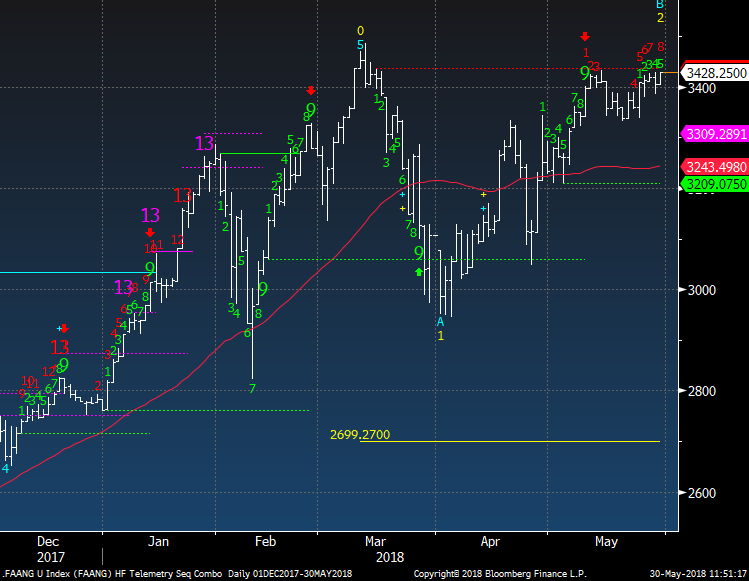
FAANG - A little more upside as it's on day 8/13
Biotech - A sector I still like long
JPM and XLF Update - Covered XLF today
Semiconductor Update - A little more upside expected
Netflix Update - Perfect place to short
Tesla - Covered short as it did not break the recent lows.
Bond Update - Sentiment shot up higher but should back off.
DeMark Screens - Daily, Weekly, Monthly upside/downside exhaustion signals within the S&P 1500 and Euro Stoxx 600
|
|
|
|
|
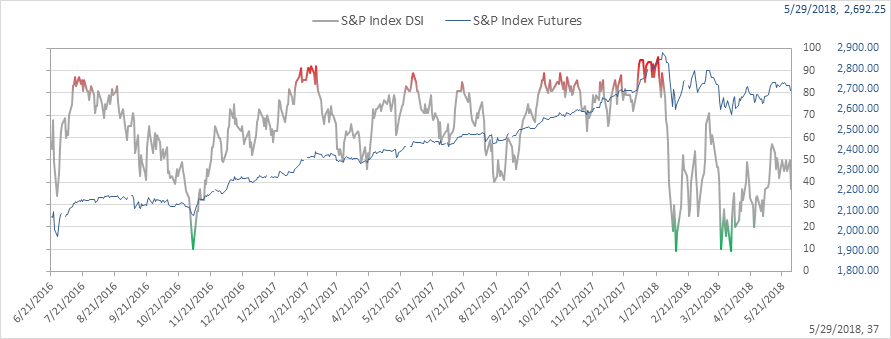
Here's a link to the Hedge Fund Telemetry market sentiment page with 40 charts of sentiment including equities, bonds, currencies, and commodities updated each day.
SPX bullish sentiment is at 37% and should be up back near 50% when you look online after 5:30pm on the website
|
|
|
|
|
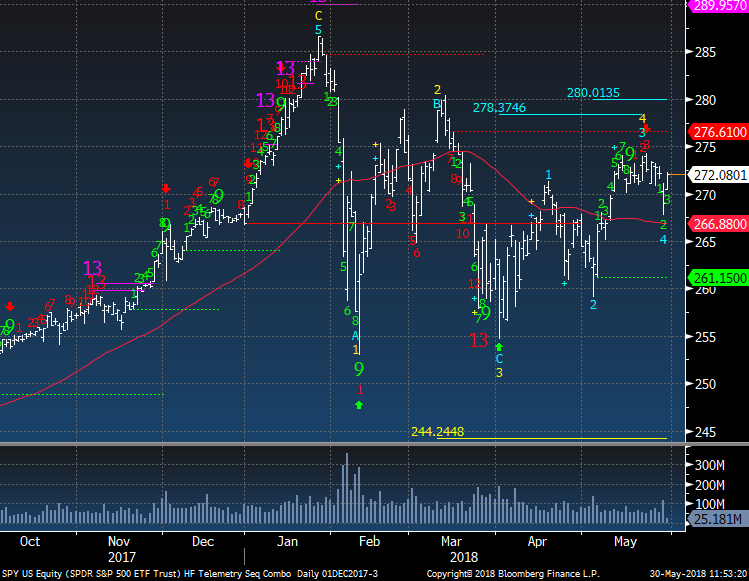
SPY bounced back above the 270 (SPX 2700) and with yesterday's close locked in an upside wave 4 with a new upside wave 5 target of 280.01. Although I remain longer term bearish based on monthly and weekly upside exhaustion signals a move a little higher is not out of the question. I still strongly believe January highs were the top in the SPX
|
|
|
|
|
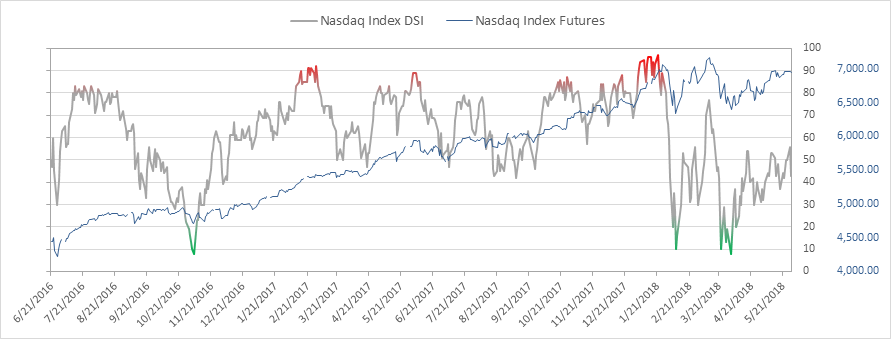
Nasdaq bullish sentiment is at 43%
|
|
|
|
|
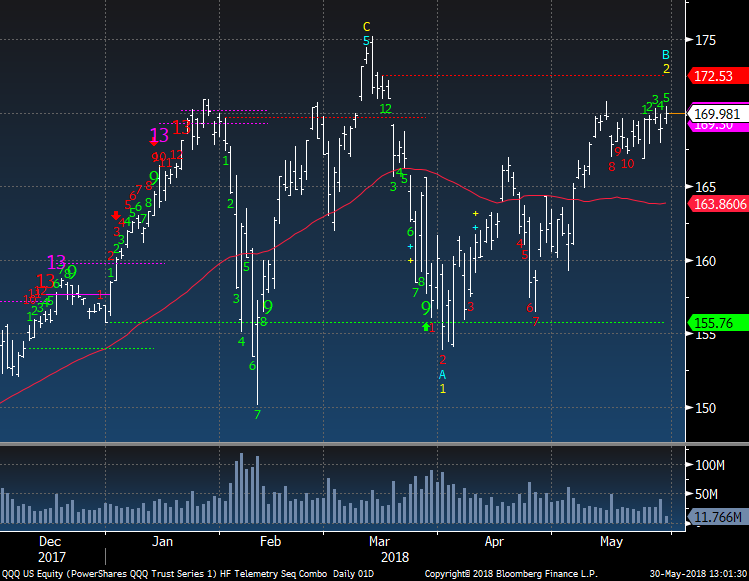
QQQ has been going sideways and is inching higher. I was asked today if the NDX could make a new high. It's possible since it only takes the top weighted 5 stocks to move a little higher. See the FANG chart below as most likely the guide of how much more we have to go on the upside
|
|
|
|
|
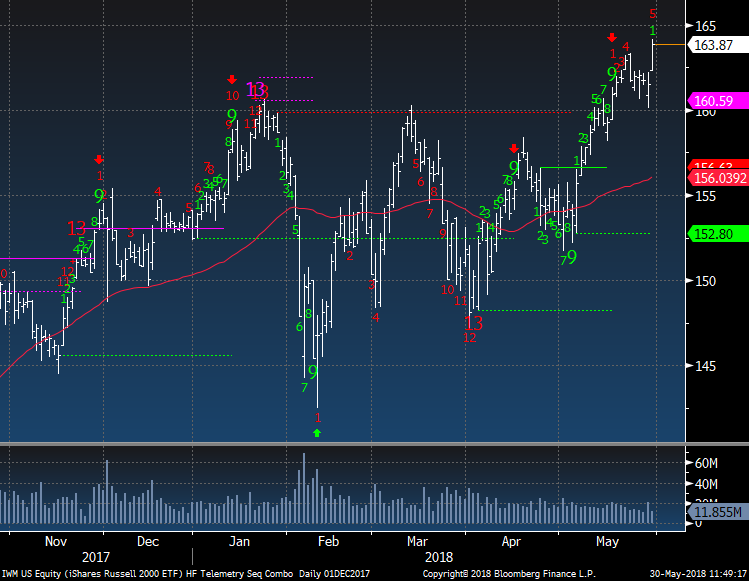
IWM Russell 2000 is on day 5 of 13 with an upside red Countdown. As mentioned the other day this had potential of completing on the upside but...
|
|
|
|
|
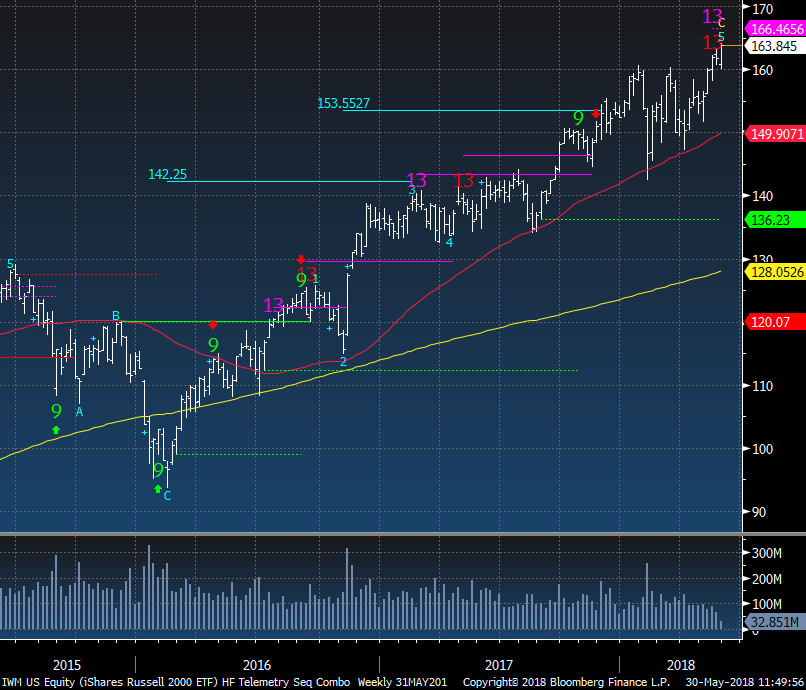
The weekly of the IWM did have upside exhaustion signals and once the daily completes a reversal down of 10% is possible.
|
|
|
|
|
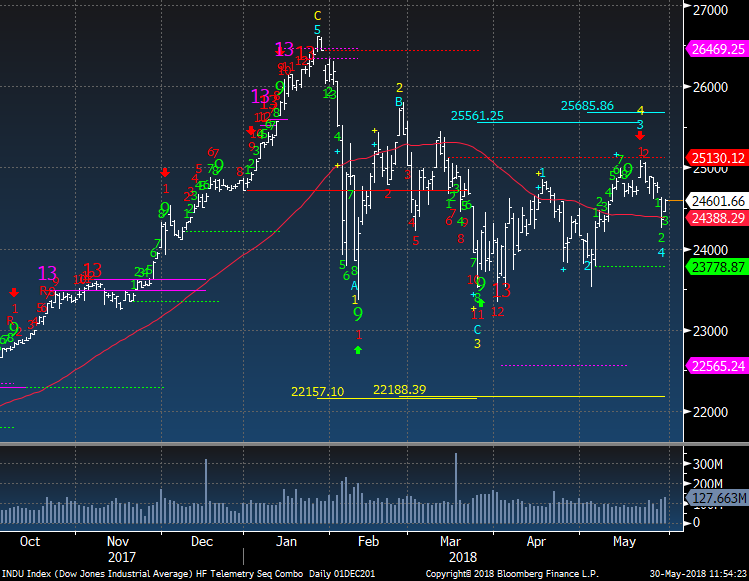
The Dow Jones like the SPX did lock in the 4th corrective wave yesterday with an upside wave 5 price objective of 25,685. Take off all of the expensive and fancy indicators this still looks like a sideways to down move
|
|
|
|
|
|
|
Hedge Fund Telemetry Trade Ideas
|
|
|
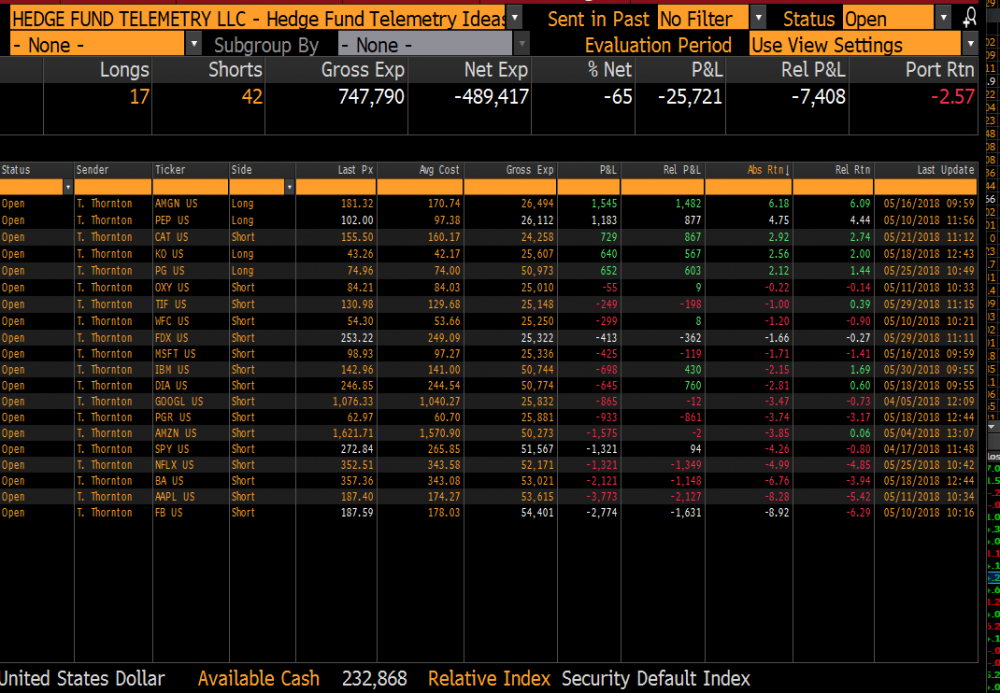
Trade Ideas: Covered QQQ --7%, IWM --8%, TSLA +5%, XLF +3%, SAP+2%, NVDA +3%. Doubled up IBM to 5% weight. I believe when IBM breaks 140 it won't see that number for a while. PNL has bounced up and down 60bps for the past couple weeks and I raised some cash to put it to more productive ideas.
|
|
|
|
|
|
|
|
|
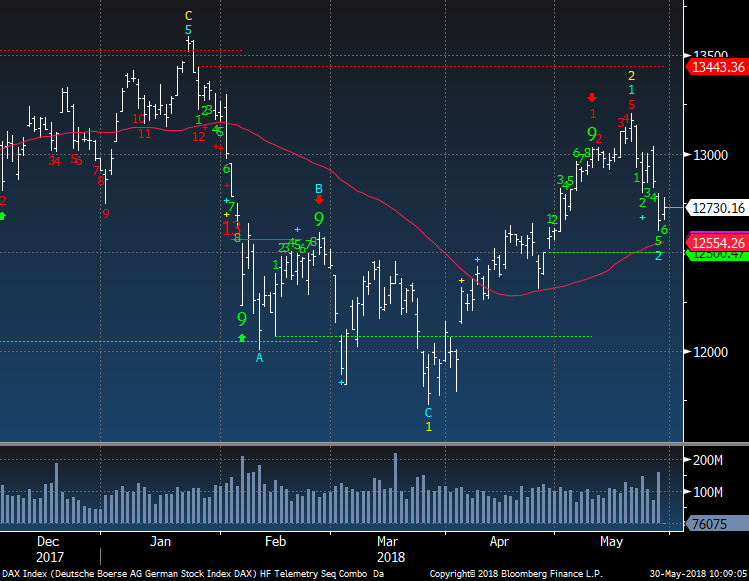
DAX bounced today but not enough to move above yesterday's high. It's on day 5 of 13 with an upside red Countdown but also on day 6 of 9 with a green Setup. If this completes the downside green Setup (9 consecutive closes under 4 previous closes) the red Countdown will be cancelled.
|
|
|
|
|
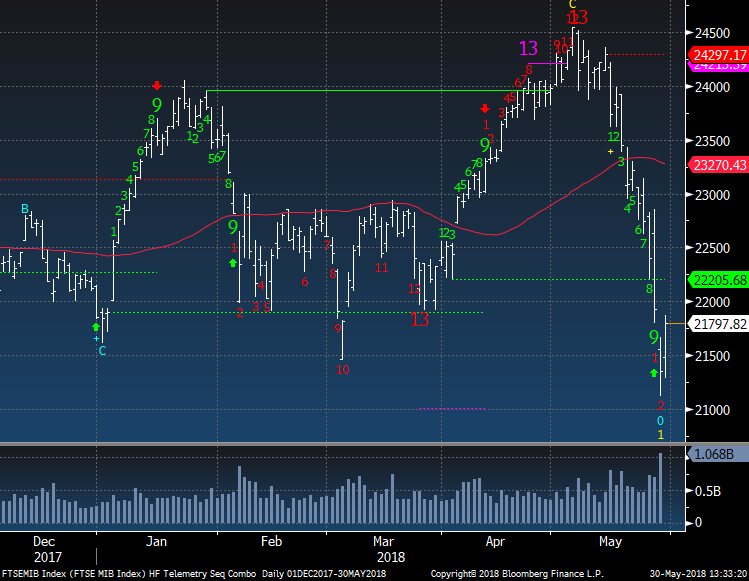
Italy bounced today up 2% and that is what CNBC called "stabilizing" There is a downside red Countdown on day 2 of 13 and the recent green 9 Setup should see a few days of a bounce before this resumes lower. I feel the way investors in the US ignore some of the macro risks is going to be their undoing.
|
|
|
|
|
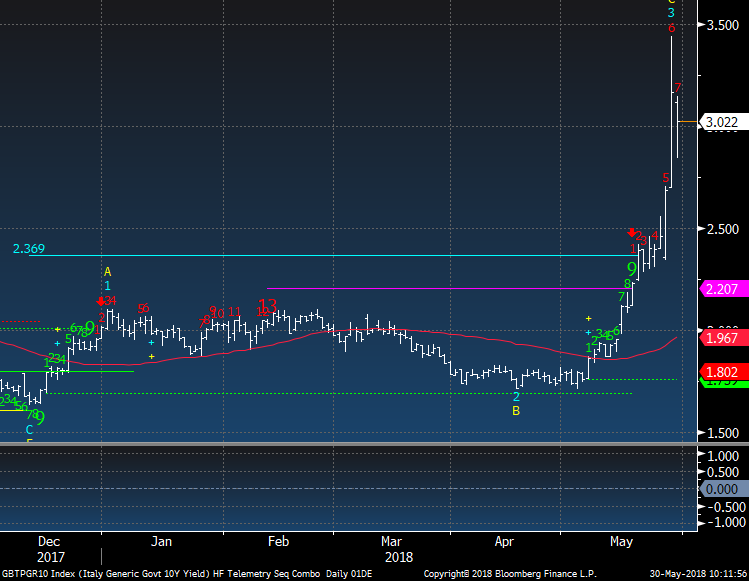
More stabilizing... Italian 10 year yield dropped a little yet there remains an upside red Countdown on day 7 of 13. The more stabilizing was my sarcasm
|
|
|
|
|
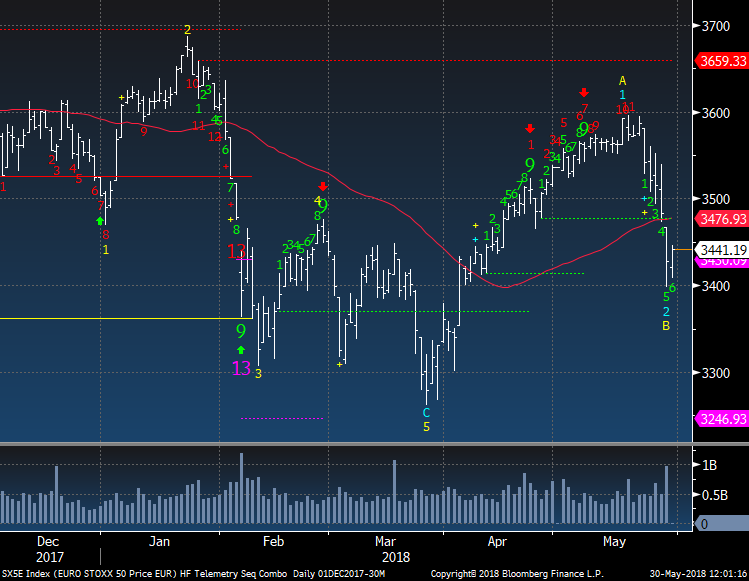
Euro Stoxx 50 is on day 6 of 9 with a green Setup. Again if this makes 9 consecutive closes under 4 previous closes the upside pending red Countdown is cancelled.
|
|
|
|
|
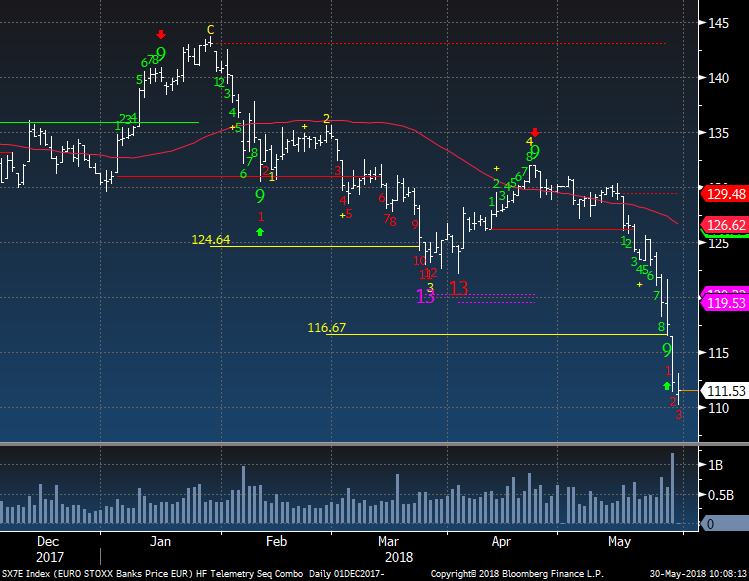
Euro Banks did not the get the memo that things were stabilizing. On day 3 of 13 with a downside red Countdown
|
|
|
|
|
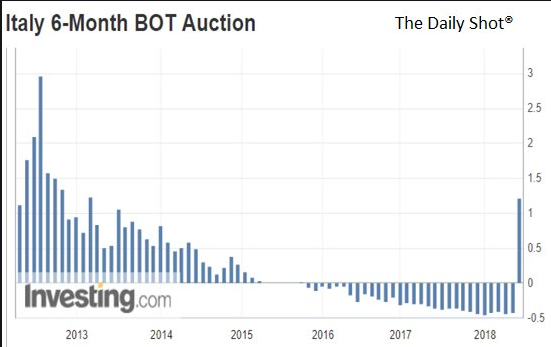
This is an amazing chart of nearly 3 years of NIRP negative interest rate issuance in Italy. So if you were an Italian bank and you bought negative interest rate bonds you only have to pay the interest back for a few more months. Oh what about the longer term duration issued around the world with negative interest rates? This was complete insanity then and now.
|
|
|
|
|
|
|
|
|
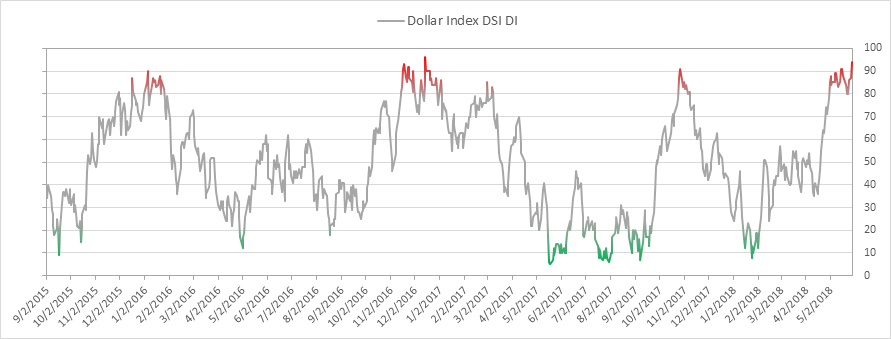
US Dollar bullish sentiment it 94%. About as bullish as it gets as it surpassed the 2016 high of 93%
|
|
|
|
|
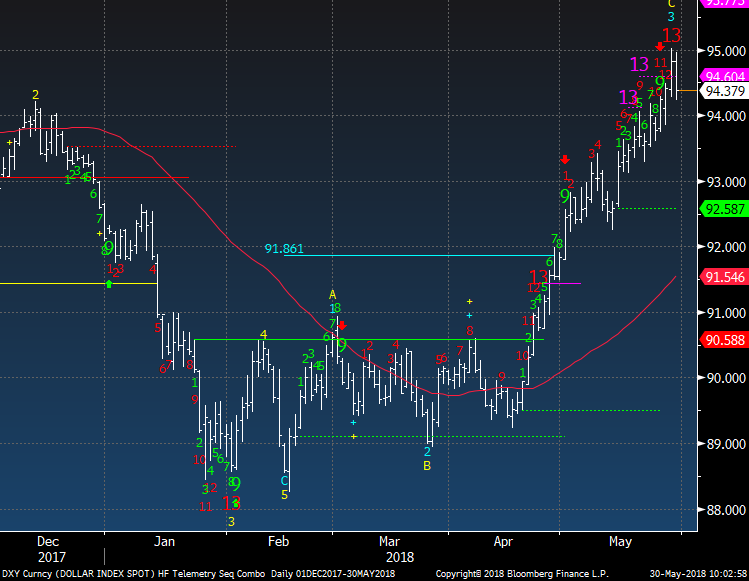
DXY US Dollar Index had the red Sequential upside 13 yesterday and has reversed down today. For the wave 4 to trigger this has to make a 13 day closing low. Currently that is at 92.58 and tomorrow it will be above 93 and even closer to the current price each day. I expect it will trigger between 93-94 and then move higher. That's when things will get very tricky for many assets.
|
|
|
|
|
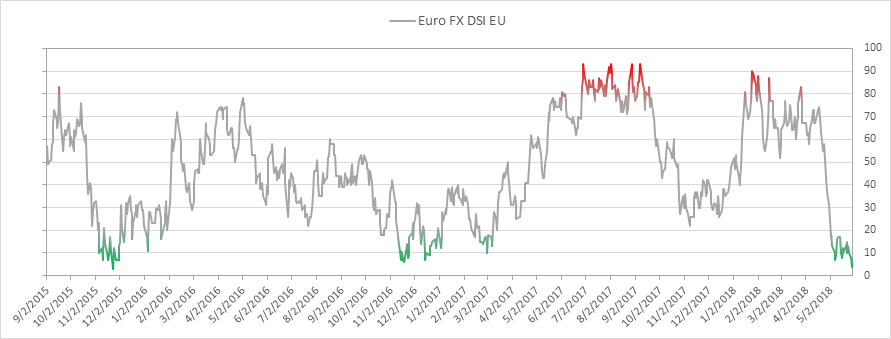
Euro bullish sentiment hit 4% and that is the lowest reading in over 3 years
|
|
|
|
|
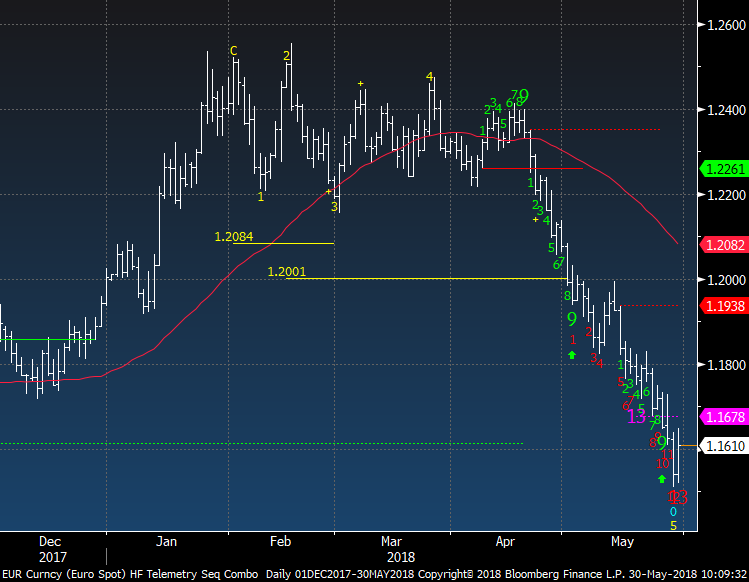
Euro today got the downside red Countdown 13 and has reversed. Combined with the sentiment a bounce was easy to call
|
|
|
|
|
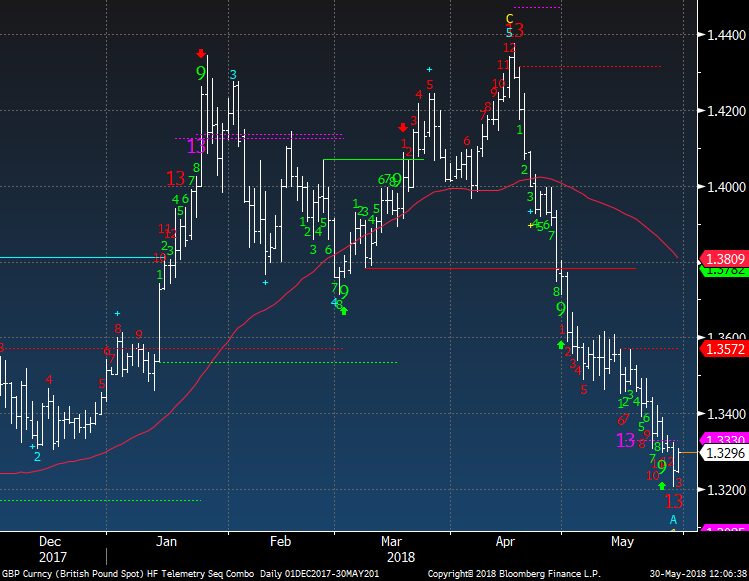
GBP also had a downside red 13 and is bouncing. Sentiment is at 10% and down from the extreme highs above 80% when it had the upside exhaustion
|
|
|
|
|
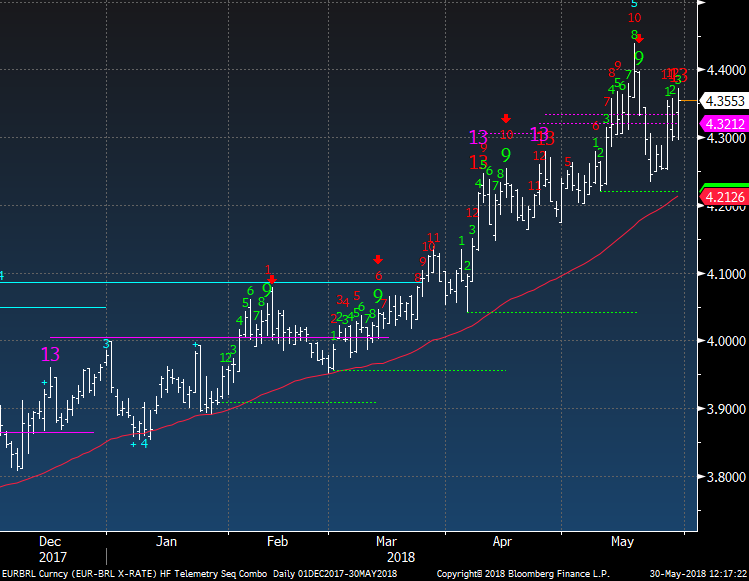
EURBRL has an upside exhaustion 13 today too - by request. USDBRL is on day 9/13
|
|
|
|
|
|
|
|
|
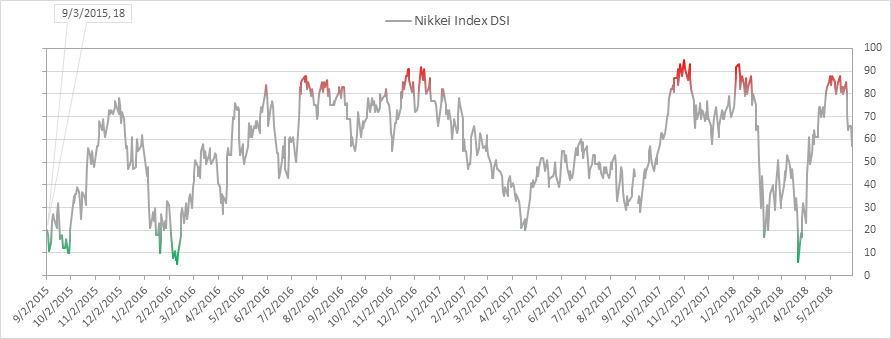
Nikkei bullish sentiment is at 57% down from a recent high of 88%.
|
|
|
|
|
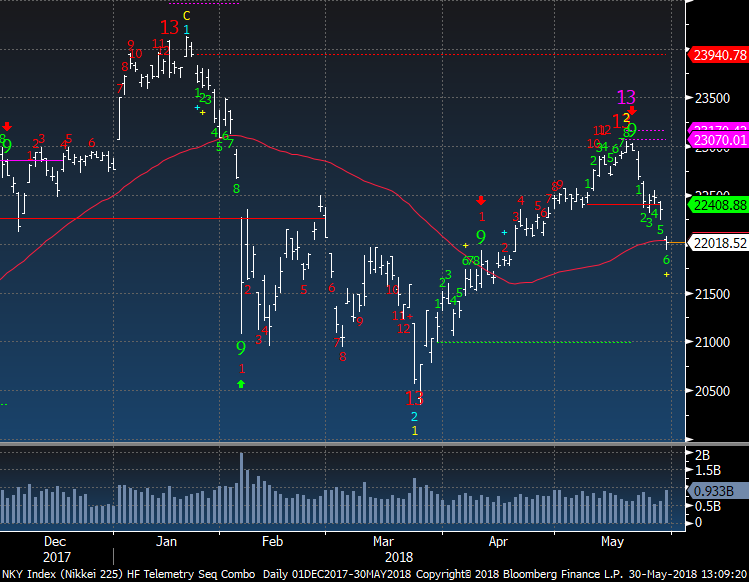
Nikkei had a great and expected reaction after the upside exhaustion 13's and 9. It's at the 50 day and should bounce tomorrow.
|
|
|
|
|
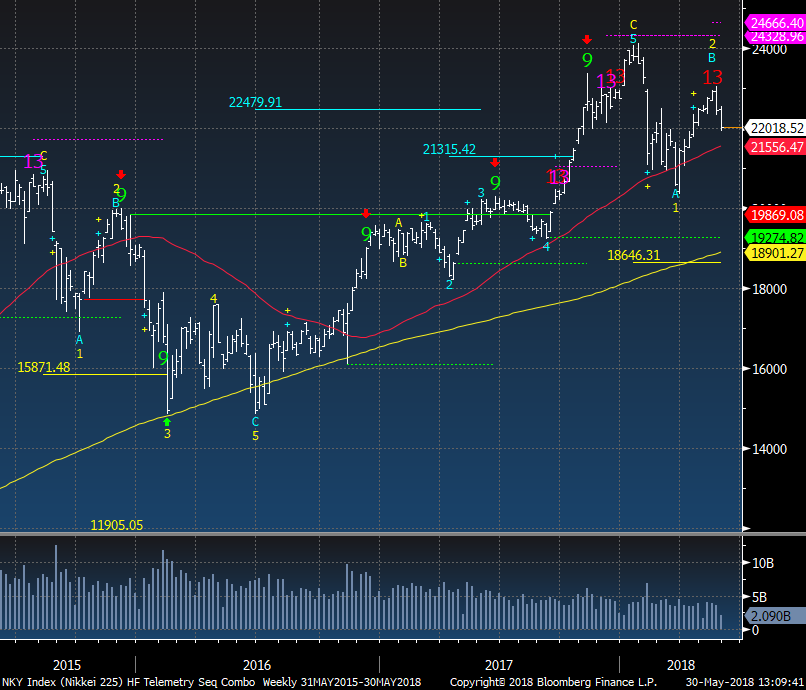
Nikkei weekly looks dangerous as it made a lower high and had upside exhaustion. The wave 3 downside price objective is at 18,646. Notice the previous 5 wave down move on the left side.
|
|
|
|
|
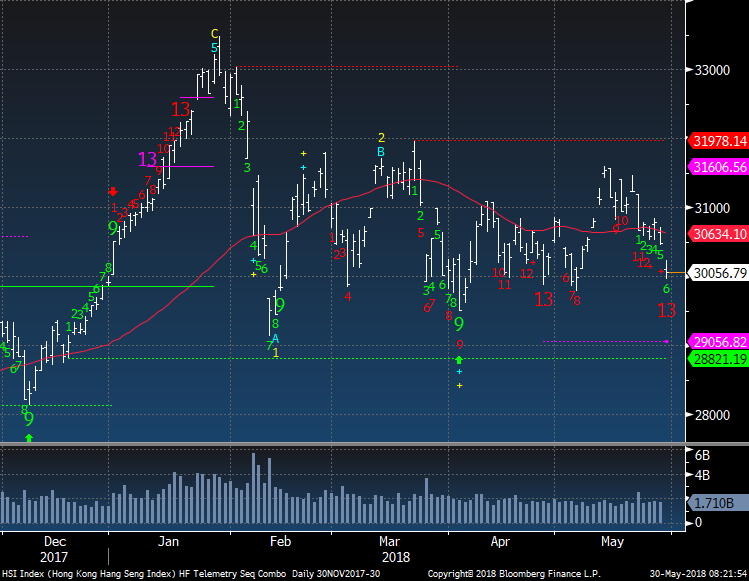
Hang Seng achieved the downside red 13 Countdown exhaustion high today
|
|
|
|
|
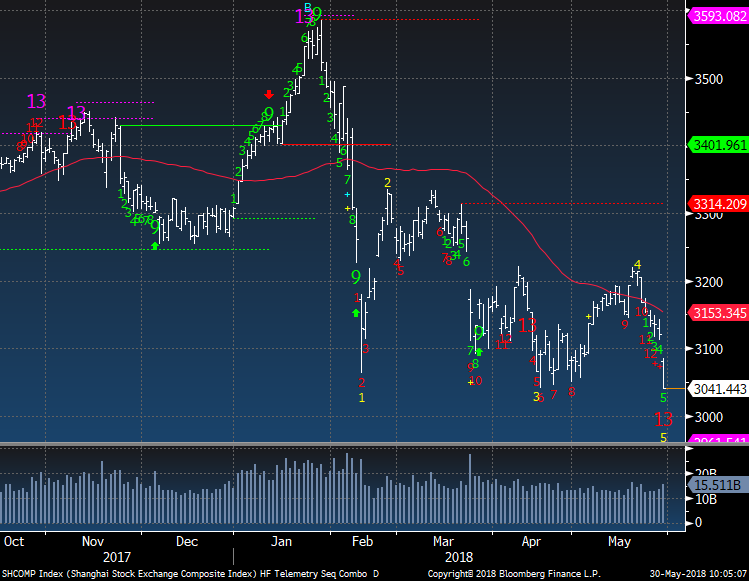
Same with the Shanghai Composite
|
|
|
|
|
|
|
|
|
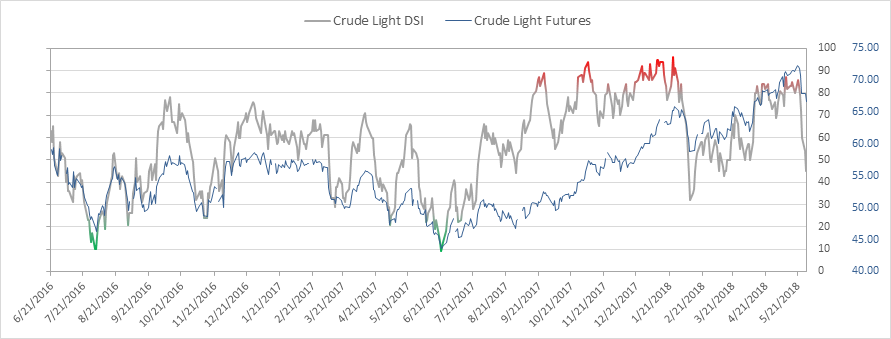
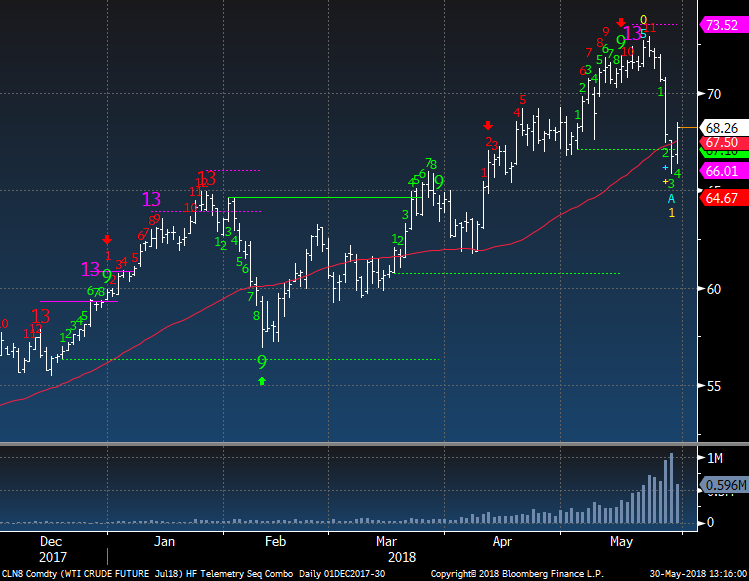
Crude bullish sentiment isat 45% and down quickly from the 80%+ level just 6 days ago
|
|
|
|
|
Crude is bouncing today around the 50 day and green TDST support.
|
|
|
|
|
|
|
|
|
This is one of the reasons I covered the QQQ just to lower a little exposure to something I see up for a few more days. It is now on day 8 of 13.
|
|
|
|
|
|
|
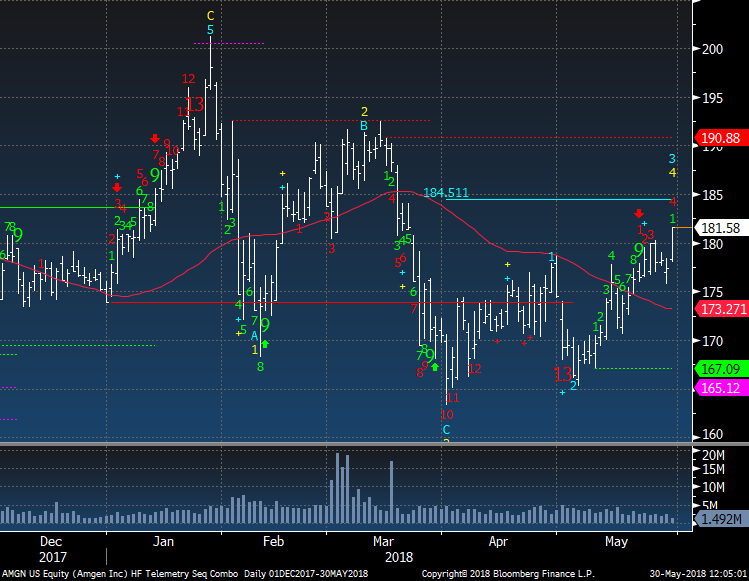
Biotech - I still like long
|
|
|
AMGN my proxy to buy in Biotech is now on day 4/13 with an upside Countdown.
|
|
|
|
|
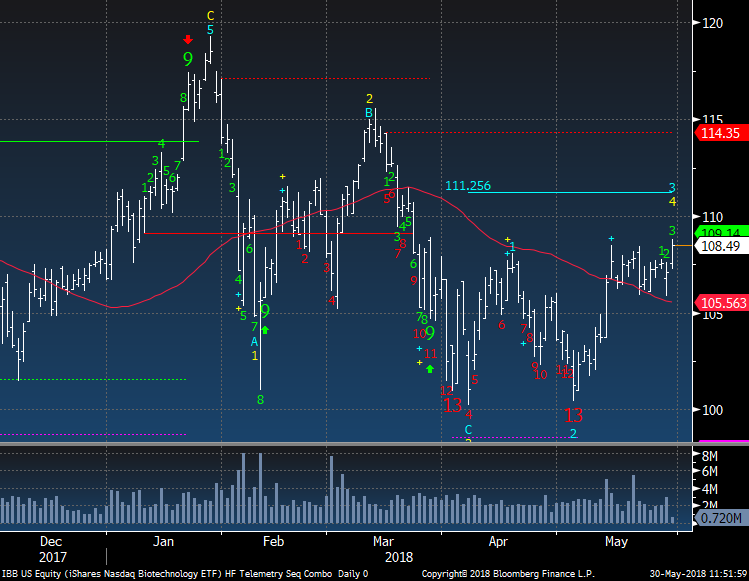
IBB which also had a downside exhaustion at the same time still has upside ahead.
|
|
|
|
|
|
|
|
|
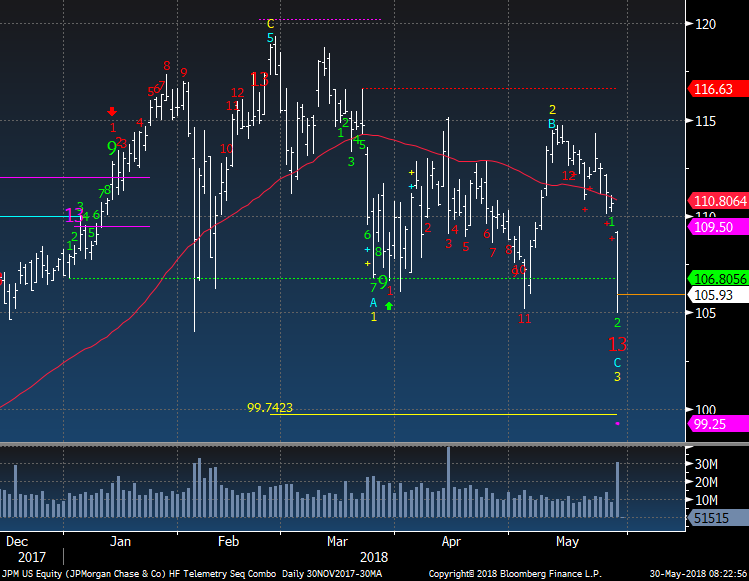
I covered XLF today after shorting it successfully. I really felt we could see a downside break with European banks weak. JPM below really shows how this was on a ledge.
|
|
|
|
|
|
|
|
|
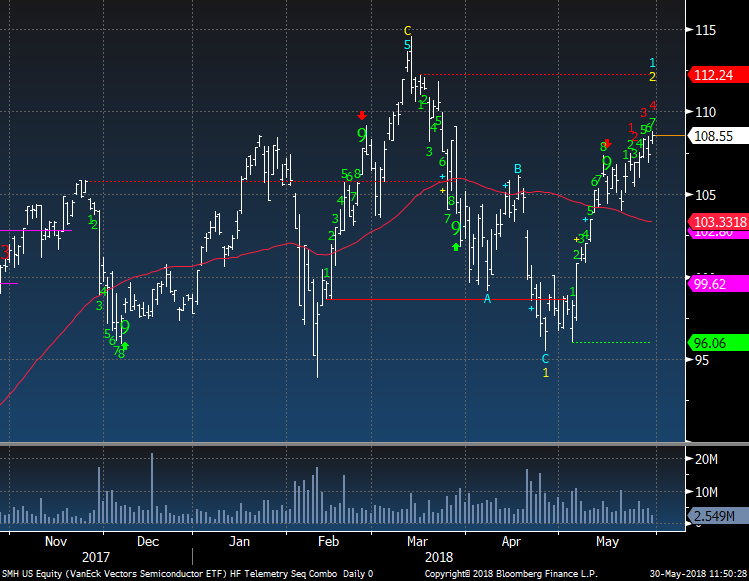
I covered NVDA at a 3% gain based on this chart showing SMH again with an upside Countdown on day 4/13 with a red Countdown. There is a green Setup on day 7/9 and that might limit upside but again, I limited some exposure to a place where people are chasing.
|
|
|
|
|
|
|
|
|
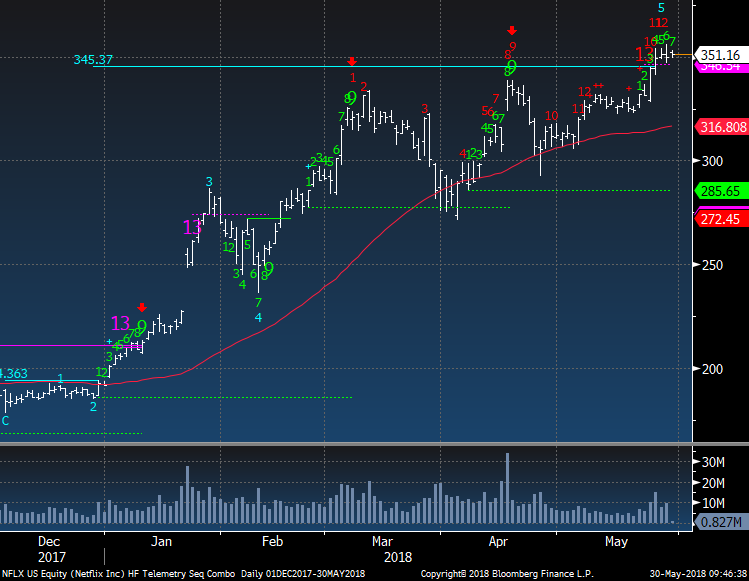
NFLX daily remains on day 12/13 with the secondary upside Countdown. I will remain short
|
|
|
|
|
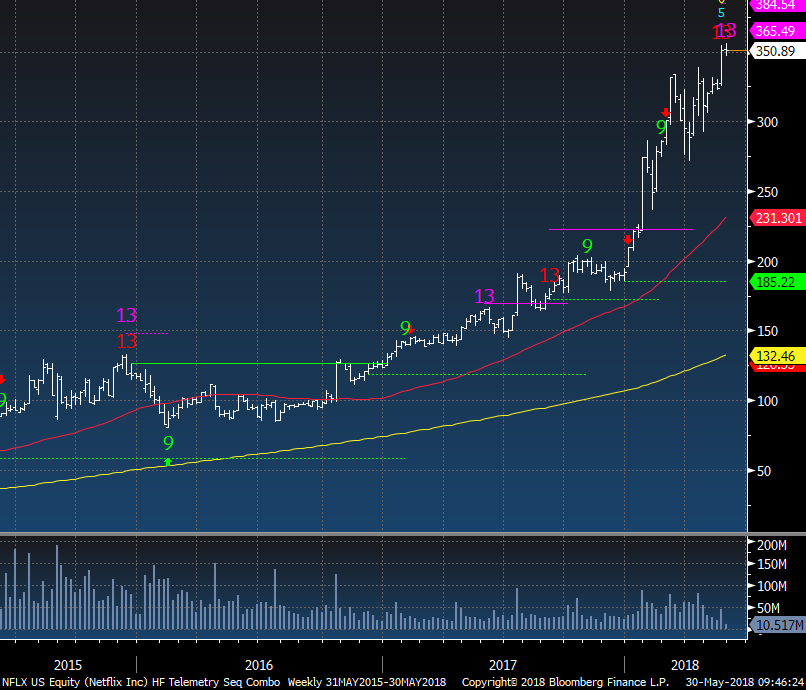
NFLX weekly had both red Sequential and pink Combo upside exhaustion signals.
|
|
|
|
|
|
|
|
|
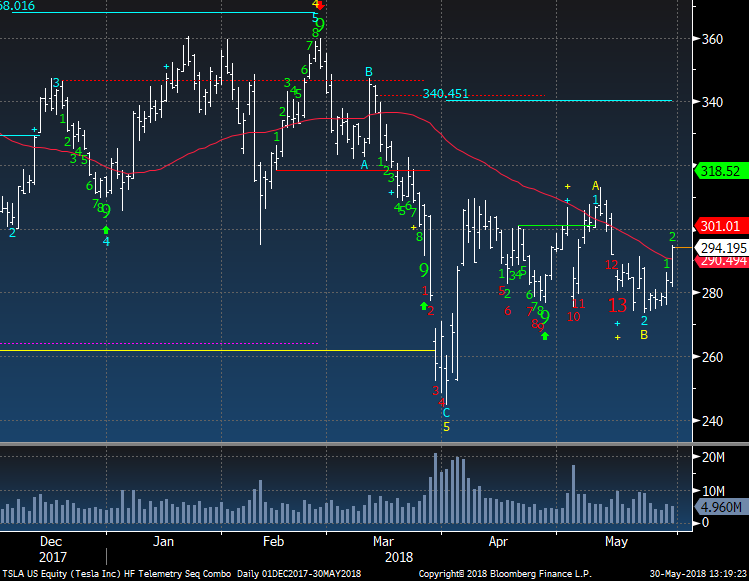
I covered TSLA today and believe the stock is worthless yet it couldn't break the recent low of 275 with any follow through. I will be back short this once this gives me a signal. I am by no means bullish on this joke of a company
|
|
|
|
|
|
|
|
|
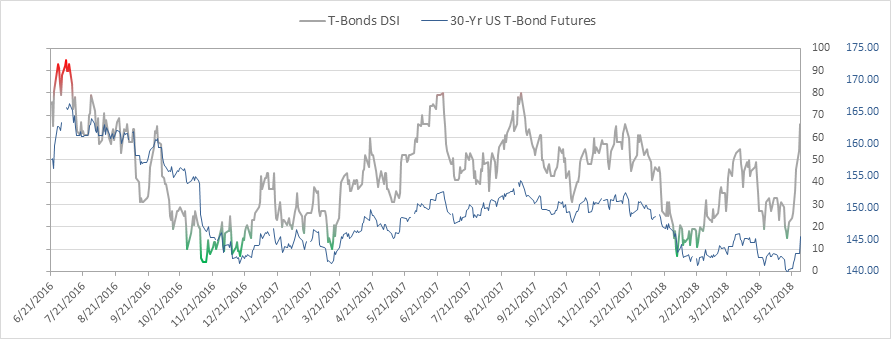
Bond bullish sentiment is at 66% and ripped higher in a quick risk off trade. Expect a decent drop on today's reading
|
|
|
|
|
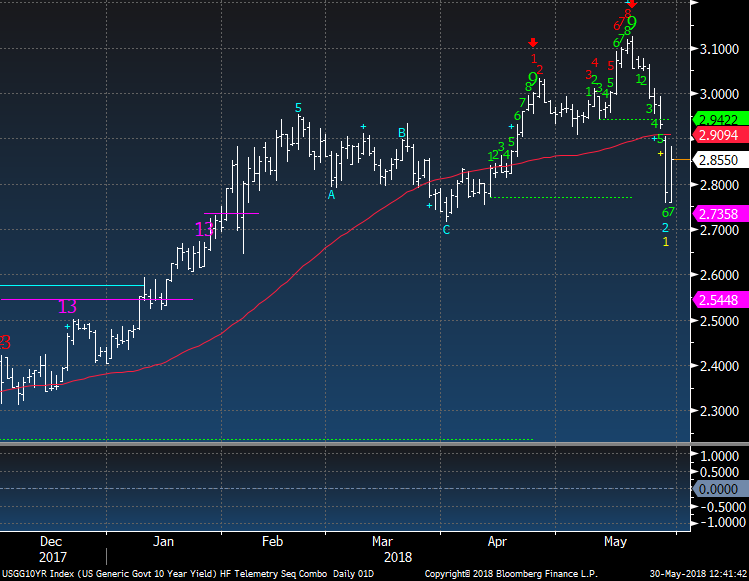
US 10 year yield bounced back from yesterday's big drop. It is on day 7 of 9 with a downside green Setup and if and when it completes as I expect the pending upside red Countdown will be cancelled. The early April low is really and important support level to watch.
|
|
|
|
|
|
|
DEMARK SCREENS - Daily, Weekly, Monthly Upside/Downside Exhaustion Signals
|
|
|
S&P 1500 Universe:
DAILY UPSIDE 13: COR, CPLA, NEE, RGS, SIG, UGI
DAILY DOWNSIDE 13: BAC, CRL, DISCA, HBAN, JPM, OMC
DAILY UPSIDE WITH PRICE FLIP REVERSAL DOWN: AKAM, FFIV, GIFI, HAS, INDB, MCY, SEE, SMRT, UBSI, WY
DAILY DOWNSIDE WITH PRICE FLIP REVERSAL UP: AAN, VSAT
Updated: 5/29/18
WEEKLY UPSIDE 13: ABAX, APD, AVA, BCC, BCPC, CMTL, DE, EMR, FBP, FFIV, GWW, MU, NFLX, PX, RGS, SAM, SXC, TECH, WEX
WEEKLY DOWNSIDE 13: PDCO
Updated: 5/1/18
MONTHLY UPSIDE 13: CTXS, HSII, SYK, UFCS, WBS
MONTHLY DOWNSIDE 13: AKRX, HLX, HVT, MNK
Euro Stoxx 600 Universe:
DAILY UPSIDE 13: NONE
DAILY DOWNSIDE 13: NONE
DAILY UPSIDE WITH PRICE FLIP REVERSAL DOWN: NONE
DAILY DOWNSIDE WITH PRICE FLIP REVERSAL UP: NONE
Updated: 5/29/18
WEEKLY UPSIDE 13: ANTO LN, IHG LN
WEEKLY DOWNSIDE 13: SNH GR
Updated: 5/1/18
MONTHLY UPSIDE 13: HNR1 GR, HWDN LN, MHG NO
MONTHLY DOWNSIDE 13: AGK LN
Daily/Weekly DeMark upside/downside exhaustion signals (Sequential) Weekly updated on Monday's. Price flips occur when a stock closes higher/lower than four previous closes. The upside 13's are sell signals and downside 13's are buy signals. Price flip's are confirmation signals that increases potential for a price trend change. For example, if you are long a stock and there is an upside 13, you will want to take cautious action by selling down or out of a
position. If initiating a short sale with the upside 13's, we tend to start with a 1/2 size and add with the downside price flip. The opposite is true for when there are downside 13's. Take a 1/2 size position and add with the upside price flip. The DeMark Indicators are designed to assist the user with buying into weakness and selling into strength to anticipate trend exhaustion. Selling into a rally and buying into a decline often afford the opportunity to exit a trade without too serious a loss if wrong.
|
|
|
Unsubscribe me from Hedge Fund Telemetry
Hedge Fund Telemetry LLC, P.O. Box 4675, Greenwich, CT 06861, United States
CONFIDENTIALITY NOTE and DISCLAIMER: This message is for the named person's use only. It may contain confidential, proprietary or legally privileged material. No confidentiality or privilege is waived by any accidental or unintentional transmission. If you receive this message in error, please immediately delete it and all copies of it from your system, destroy any hard copies and notify the sender. You must not, directly or indirectly, use, disclose,
distribute, print or copy any part of this message if you are not the intended recipient. Hedge Fund Telemetry LLC. cannot guarantee the confidentiality of the material transmitted; therefore, information of a sensitive or confidential nature should not be transmitted. There is risk in trading markets. Hedge Fund Telemetry LLC reports are based on information gathered from various sources and believed to be reliable, but are not guaranteed as to accuracy and completeness. The information is subject to change without notice and Hedge Fund Telemetry LLC has no obligation to provide any updates or changes. Hedge Fund Telemetry LLC is providing this data for informational and educational purposes and does not believe that it is sufficient to base an investment decision on. This information should not be regarded as a solicitation or recommendation of any particular security or to engage in any trading strategy. One should always check with your licensed financial
advisor to determine suitability of any investments.
|
|
|
|
|