|
|
|
|
|
|
|
|
Today's action in the global markets is seeing a flight to safety from risky assets. The typical flight to safety places to hide are usually US bonds and in Europe German bonds. On occasion Gold works but the USD continues higher. In the US the action early was a gap lower but quickly the buy the dip people went into their own flight to safety trade - buy large cap Nasdaq leaders or FANG. On a relative basis it's working well today. Banks and financials on the other hand are getting
crushed with the lower yields and concerns with what is happening in Europe within the financial sector. Banks are a crowded long in the US with most strategists recommending them as buys as well people like Steve Eisman mentioning how the balance sheets are in the best shape since the 1990's. I wouldn't disagree but as the big banks reported 'good numbers' this past April the sector dropped mostly due to tempered lending, trading and costs going up. The bank (both large and small) bull case was the prospect for higher rates.
Energy fell out of bed last week as Crude dropped hard on some OPEC news and I was asked a few times why I didn't short the energy sector with all of the upside DeMark signals on every ETF and the end of the seasonal trade. Simply, I was
waiting for the upside Sequential on Crude to step in and get short. Sometimes we might get all of the signals lined up and this time I didn't yet I did add OXY as a short idea AND most importantly gave a lot of warning that the sector had to be sold if long. I am glad several of you did let me know you took down exposure in Energy!
As I finish up this note, the US markets have sunk to the lows of the day. The S&P and Dow have made nearly 3 week lows while the Nasdaq and Russell relatively are holding the recent lows in the 3 week range. For those who didn't check out
yesterday's Currency Weekly it's posted on the website or let me know and I will send to you. A heads up for Friday. I might not publish a daily note as I am traveling to Cayman's to meet with my friends at Real Vision. If you are not a subscriber to Real Vision, you should as the content they are putting out is a step above anything else. I have contributed to both videos and Think Tank publications. Here is a small taste with the new "Killer Charts." My long Consumer Staples idea with a couple charts are in the report.
Notable:
- US Markets - Sentiment should move much lower from the mid point. Starting to see breakdowns from the tight 3 week range. NDX and IWM relatively winning for now.
- Hedge Fund Telemetry Trade Ideas - Removed PPG long, Added new shorts: TIF, FDX
- European Markets - What a mess in Italy and Spain. Volatility continuing higher
- Currencies - Some exhaustion signals and near exhaustion signals.
- Asian Markets - Nikkei and Hang Seng still look lower
- Brazil Update - Haven't seen this much sadness since Ayrton Senna died
- Fight to Safety - FANG stocks and Consumer Staples top 5 weights
- A couple new short ideas - TIF, FDX
- XLF Financials ETF - Downside exhaustion 13 today but I'm holding short for now
- Bond Update - Risk off trade and flight to safety in US 10 year and TLT. Credit spreads are quietly starting to widen
- DeMark Screens - Daily, Weekly, Monthly upside/downside exhaustion signals within the S&P 1500 and Euro Stoxx 600
|
|
|
|
|
Here's a link to the Hedge Fund Telemetry market sentiment page with 40 charts of sentiment including equities, bonds, currencies, and commodities updated each day.
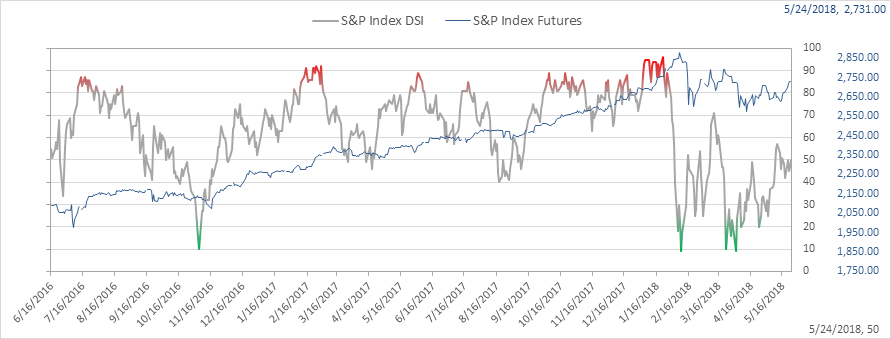
SPX bullish sentiment is at 45%
|
|
|
|
|
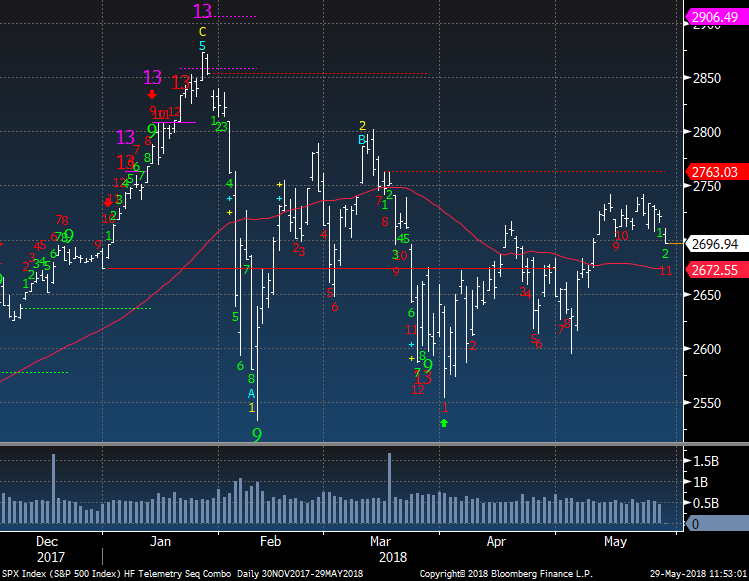
SPX Cash Index broke 2700 as of now and the next level people will be watching is the 50 day at 2672.
|
|
|
|
|
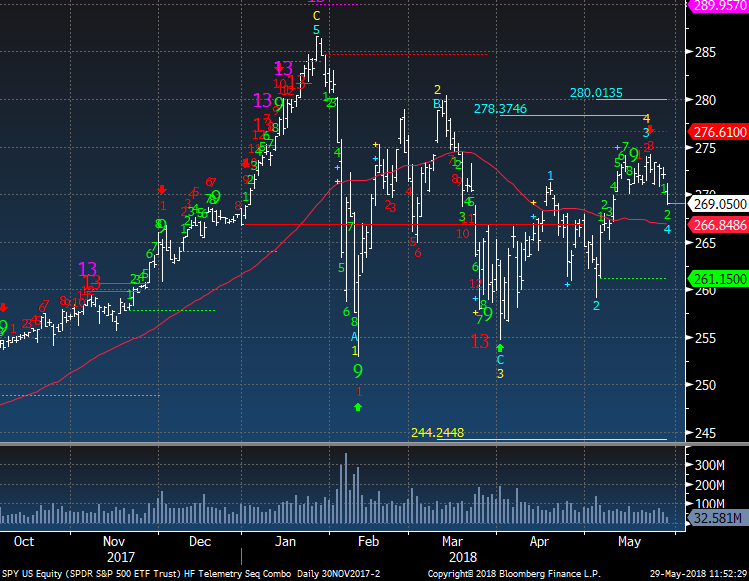
SPY broke the bottom of the 3 week range. 266.84 is the 50 day but more importantly the late April lows are likely where things get ugly
|
|
|
|
|
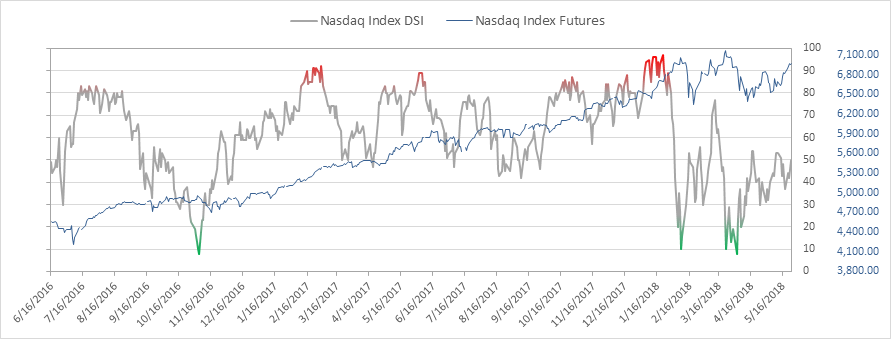
Nasdaq bullish sentiment is at 50%
|
|
|
|
|
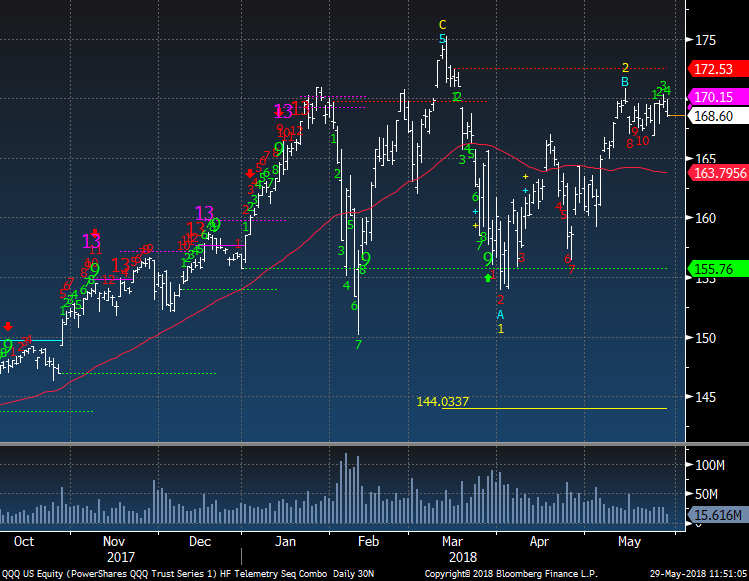
QQQ did not break the low of the recent range
|
|
|
|
|
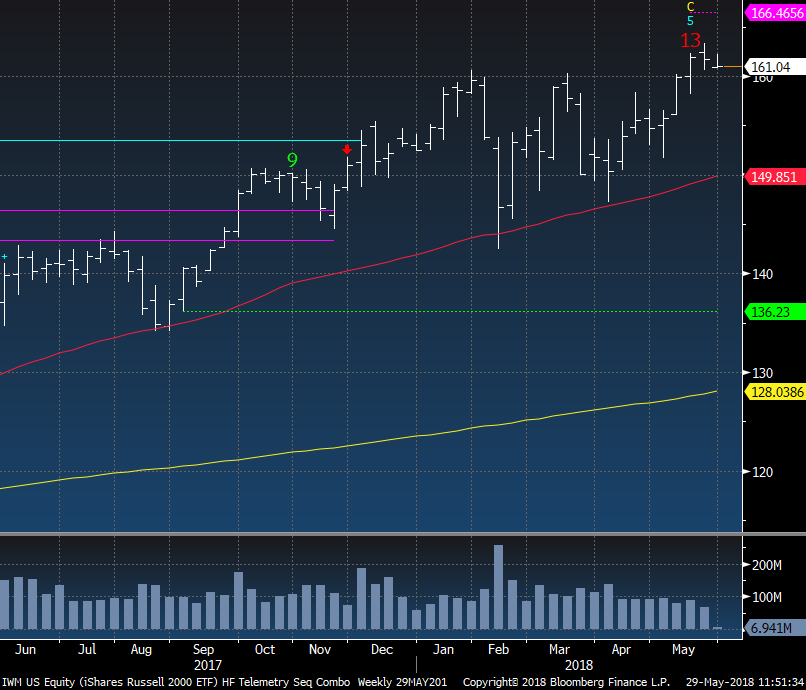
Russell 2000 IWM ETF had a "buying climax" last week whereas it made a 52 week high but closed down on the week. This is not a DeMark indicator but an old school signal that many people watch.
|
|
|
|
|
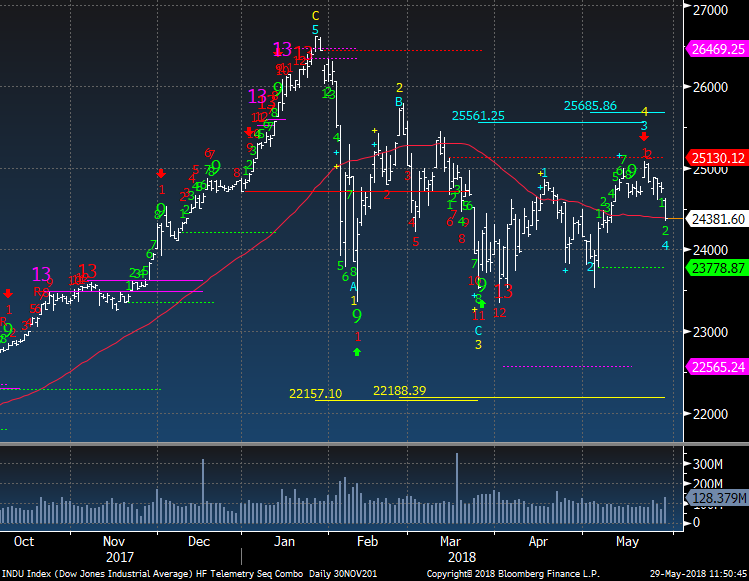
Dow Jones is slightly below the 50 day with the next level (April lows) at 23,778. There still is a downside wave 5 price objective all the way down at 22,188
|
|
|
|
|
|
|
Hedge Fund Telemetry Trade Ideas
|
|
|
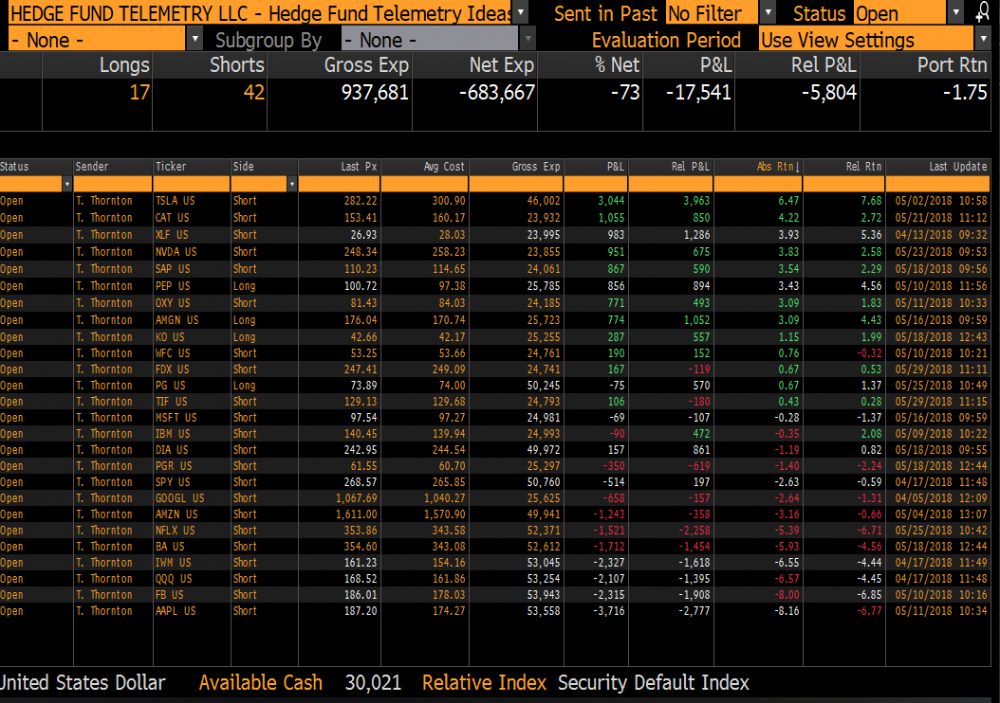
Trade Ideas - slowing making up some of the recent drawdown. Removed PPG long as it didn't turn as expected -1% loss. Added TIF and FDX short both 2.5% sized
|
|
|
|
|
|
|
|
|
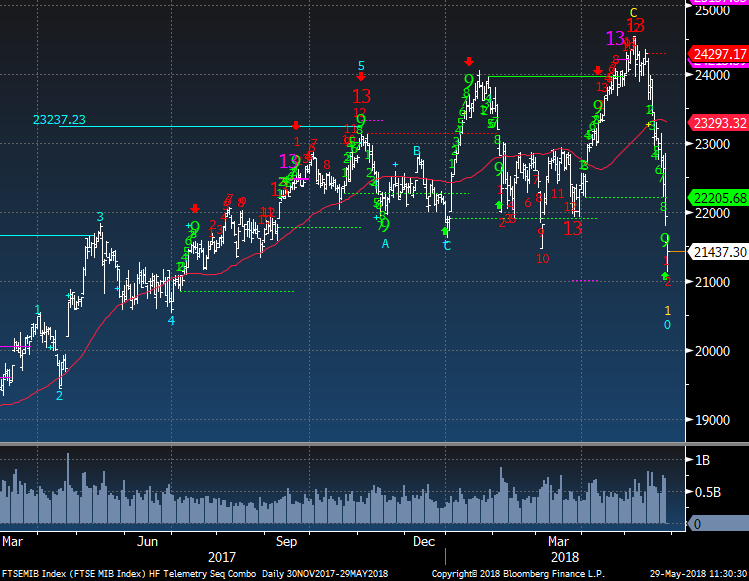
Italy was last year the best of the big European markets by far and the recent upside exhaustion signals on both he upside and downside have been quite effective. Today there is a new downside red Countdown on day 2 of 13. Recall the last time the red Countdown started on the downside it chopped around but did not collapse.
|
|
|
|
|
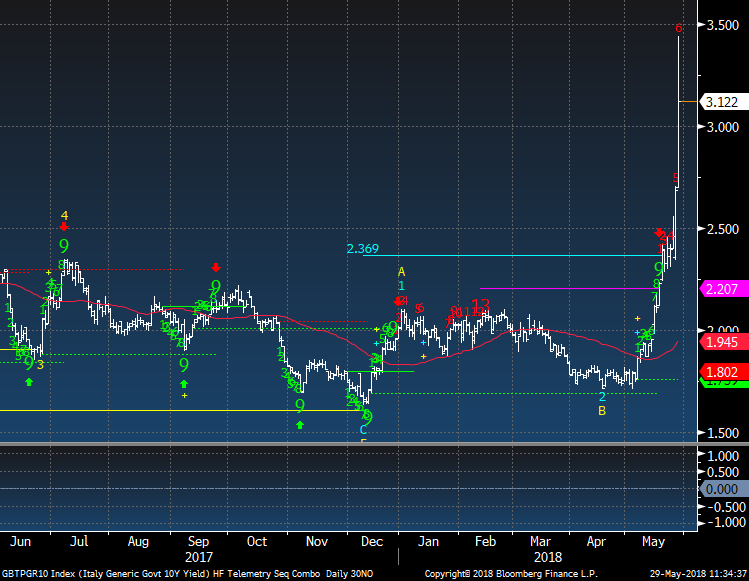
Italian 10 year has had quite the range today and in the past few days. There still is an upside Countdown on day 6 of 13. Can this go higher? Yes in 2011 it doubled from this level. This is going to hurt a lot of Italian banks as they have been the main buyer of Italian debt in the past 5 years. This crisis is not over and could threaten the entire Euro Zone.
|
|
|
|
|
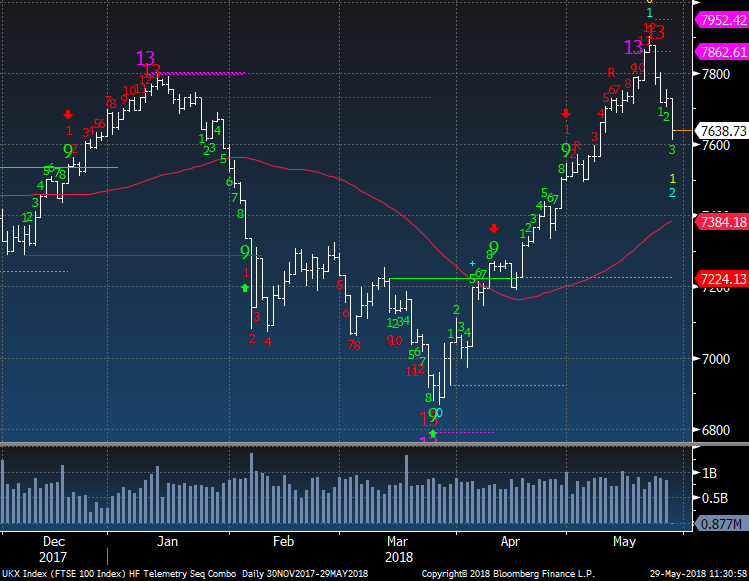
UK FTSE good reversal after the latest upside exhaustion.
|
|
|
|
|
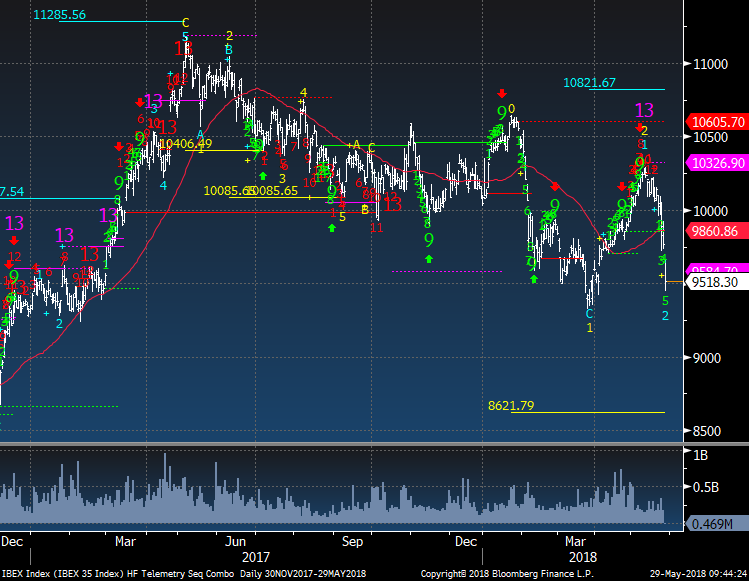
Spain had the pink Combo trigger but the Sequential only made it to 12/13. A break of the March lows opens up the wave 3 downside price objective of 8621.
|
|
|
|
|
Spainish yields have also moved in the past few weeks. This is a weekly chart and you can see where this could get out of control. Spain has its own political mess too.
|
|
|
|
|
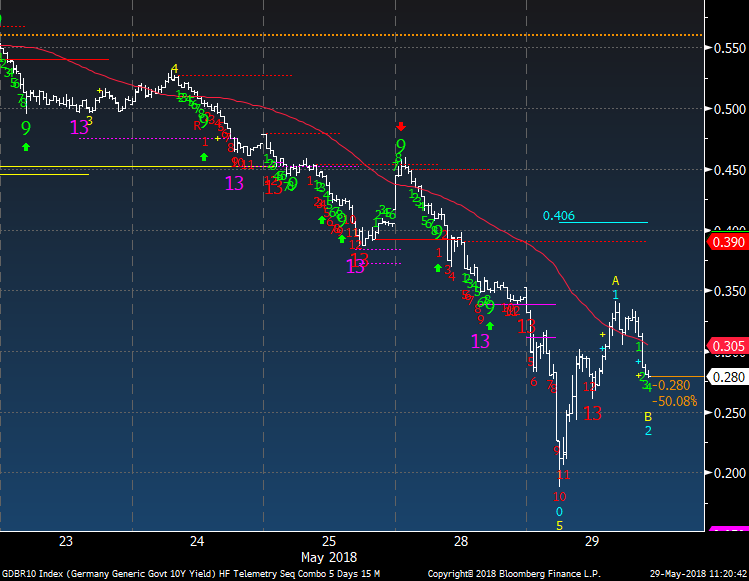
German 10 year yields has seen a flight to quality in the past few weeks after lifting along with the US 10 year yields.
|
|
|
|
|
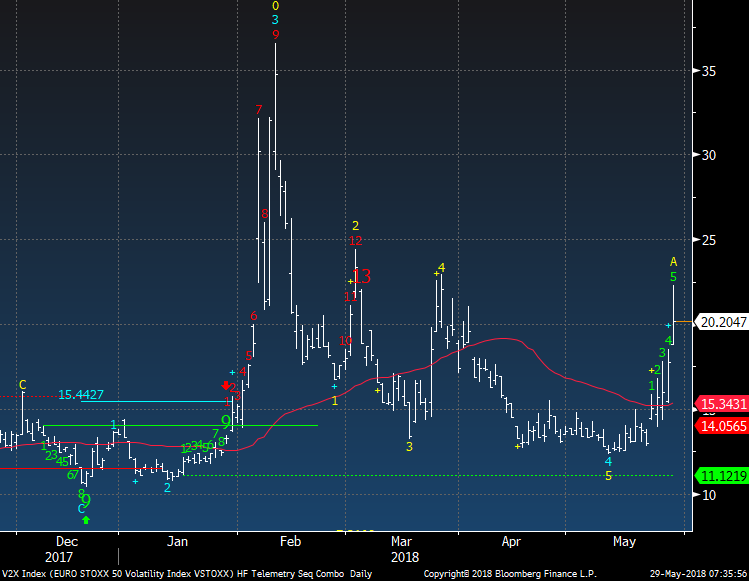
Euro Stoxx 50 Volatility continues to pick up.
|
|
|
|
|
|
|
|
|
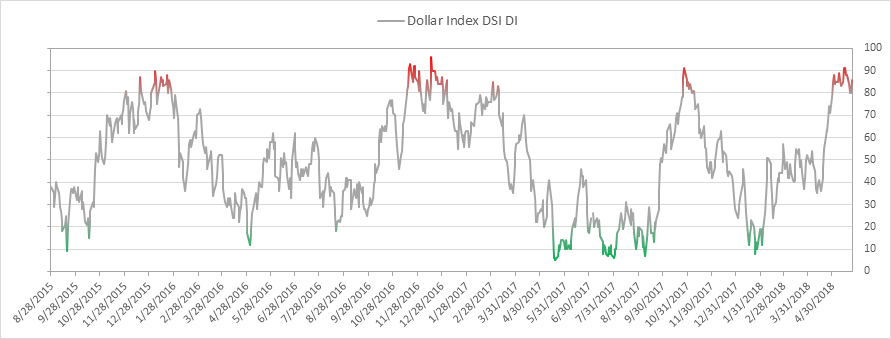
US Dollar index is at 86% and remains in the extreme zone
|
|
|
|
|
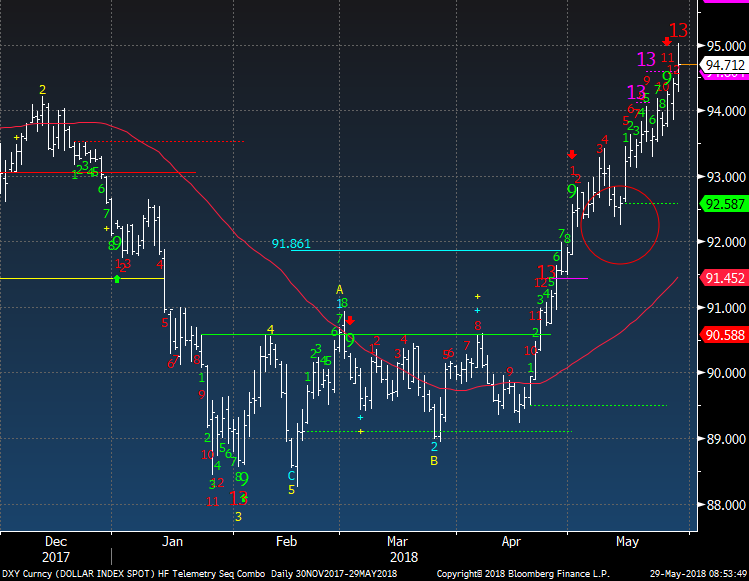
DXY Index did get the upside red Sequential 13 exhaustion today. A pause is due in the next couple days. This has been wave 3 so the pause will be wave 4 followed by an even higher move in wave 5. Don't get complacent.
|
|
|
|
|
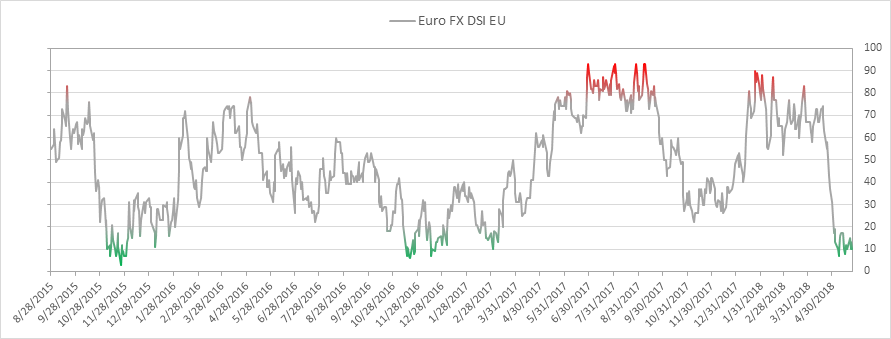
Euro bullish sentiment is at 10% and also extreme
|
|
|
|
|
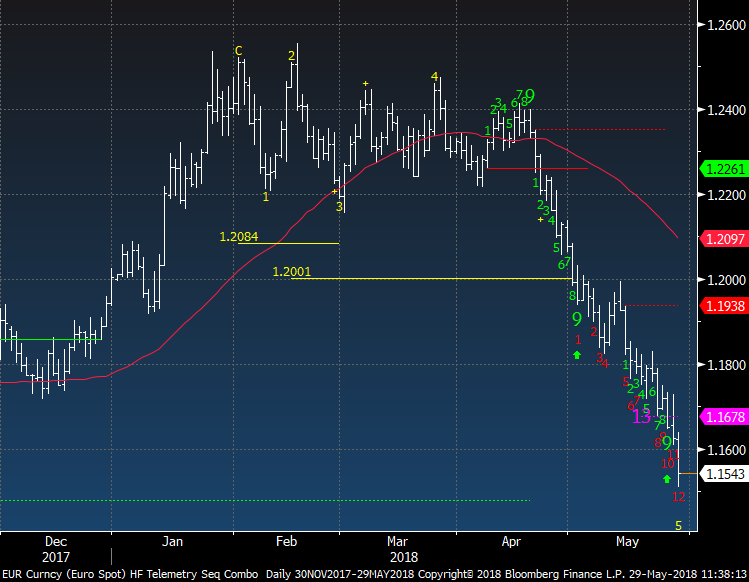
Euro spot is on day 12/13 with the downside Countdown.
|
|
|
|
|
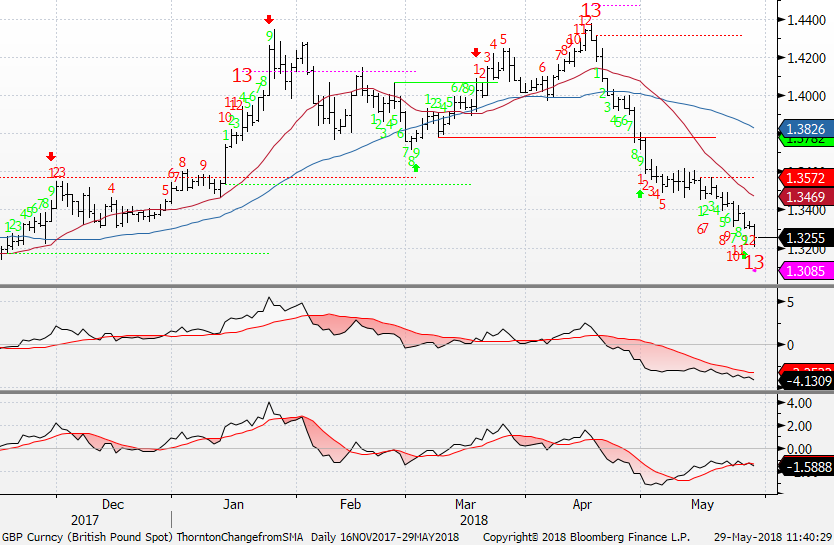
British Pound did get the 13 today. I'm pleased the upside 13 worked as expected.
|
|
|
|
|
|
|
|
|
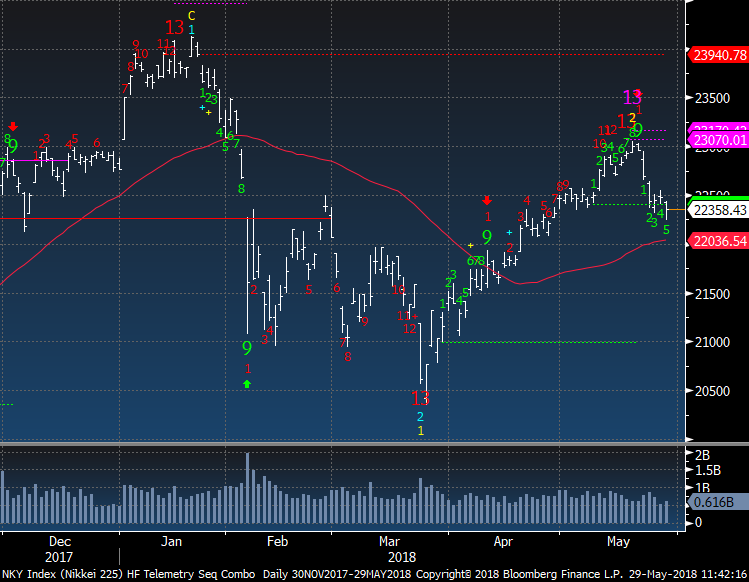
Nikkei did reverse after the latest upside exhaustion signals. I expect lower still
|
|
|
|
|
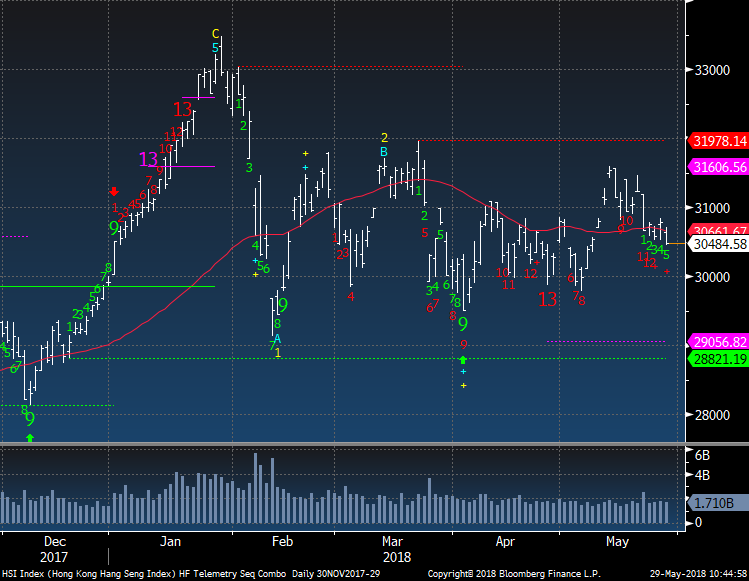
Hong Kong Hang Seng needs to close under 30,000 to get the downside red 13 exhaustion
|
|
|
|
|
|
|
|
|
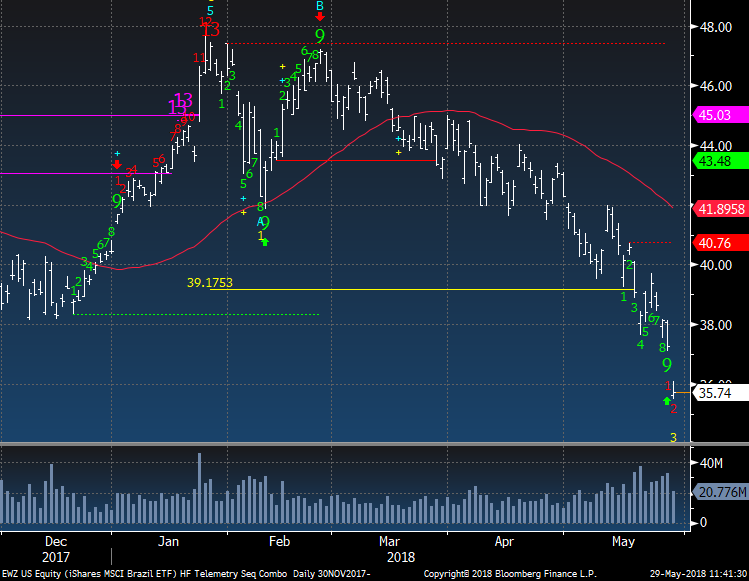
EWZ Brazil just is a mess. I've been negative on this all year and see no reason to buy it
|
|
|
|
|
|
|
Flight to Safety - FANG and Consumer Staples
|
|
|
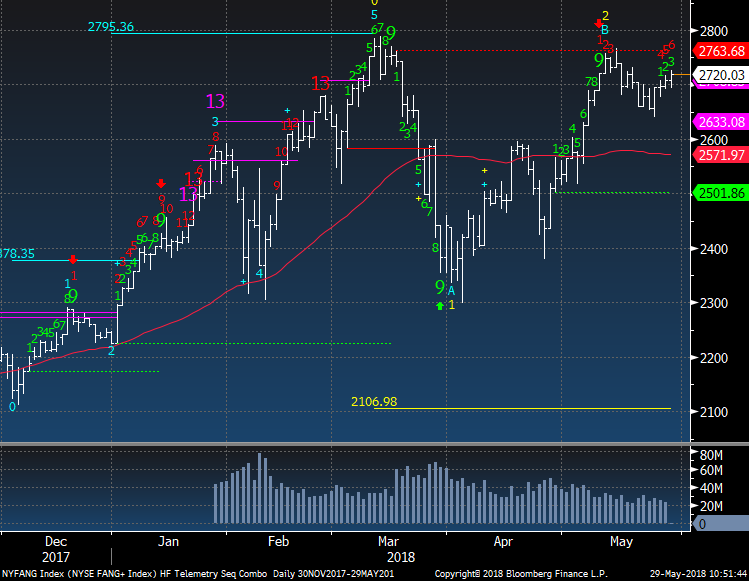
FANG + Index holds in like a champ and is on day 6/13. It wouldn't shock me to see this break out but fade soon after the exhaustion triggers. Banks were a very crowded trade too and look how they are trading today. Risk comes fast and the over crowding in these names will not last
|
|
|
|
|
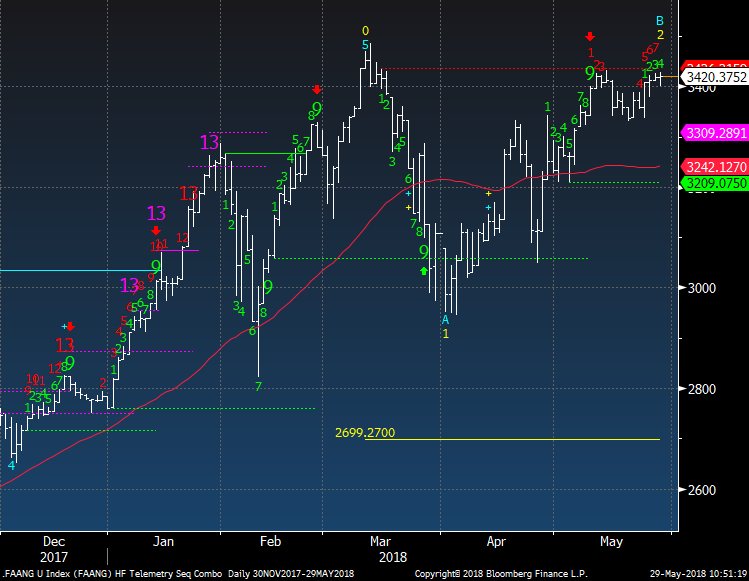
FAANG a little more narrow custom index shows the same story.
|
|
|
|
|
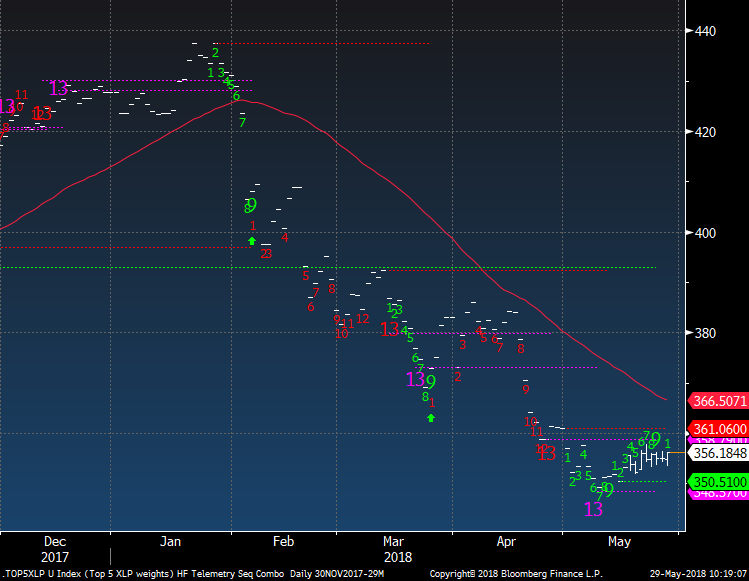
Consumer Staples made 5 waves down and the top 5 weights as a custom index looks like it wants to turn higher. PG, KO, PEP, MO, and WMT are the stocks. 3.90% an average yield too.
|
|
|
|
|
|
|
|
|
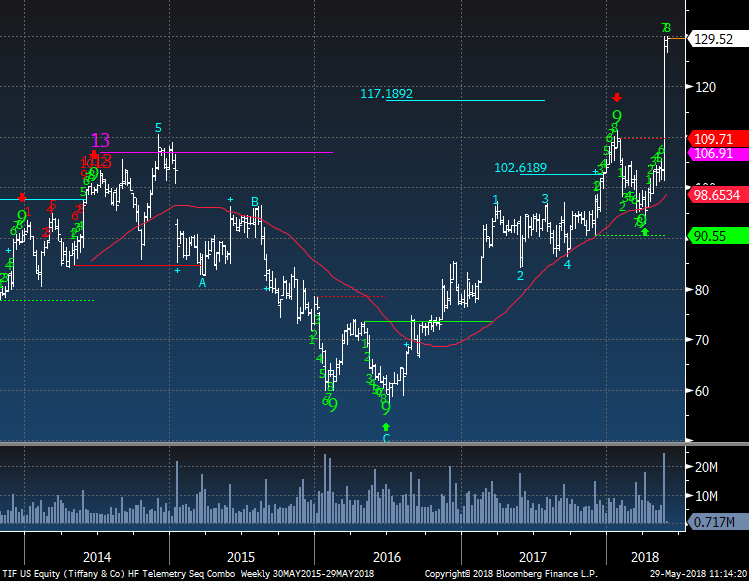
Tiffany reported earnings that were good and the market rewarded them by moving it up 30%. I would bet anyone short ahead of the number has had the shoulder tap and is gone. I shorted it with a 2.5% sized position as tomorrow there will be a new green Setup 9 and the Setup's on both the upside and downside have seen price reactions. And if Europe comps were weaker than expected last quarter I doubt that trend will change for the better.
|
|
|
|
|
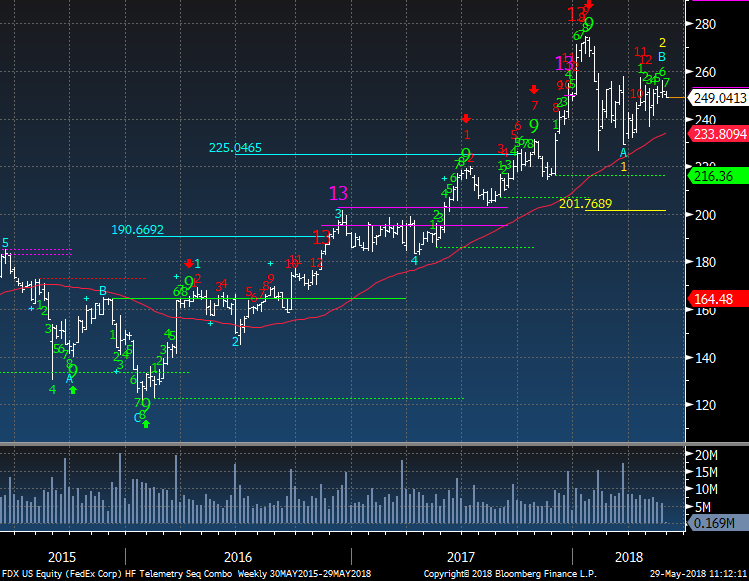
Fed Ex weekly chart has made a lower high and I expect a break of 240 that will lead to even lower levels.
|
|
|
|
|
|
|
|
|
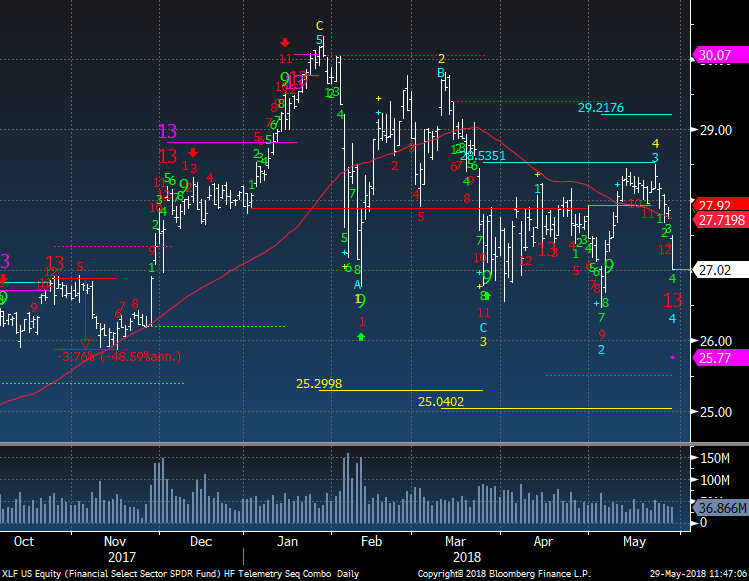
XLF has a downside DeMark red Sequential Countdown 13 today. I have been short XLF and I am not covering today. The DeMark risk level on this signal is 25.77 and I want to see if this will break the recent lows considering the Euro Bank Index did break a low.
|
|
|
|
|
|
|
|
|
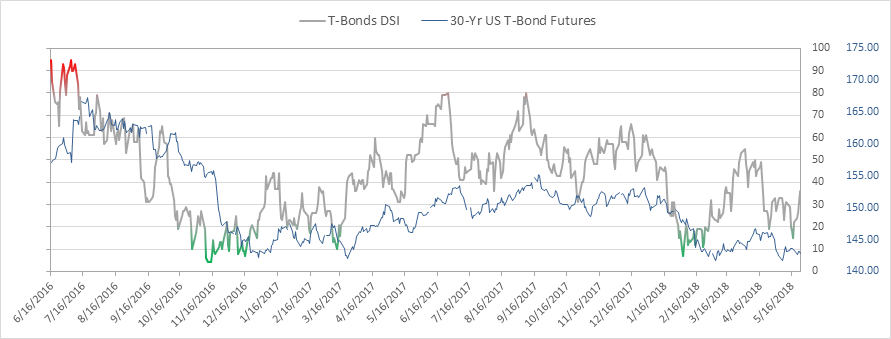
Bond bullish sentiment is at 46% and is rapidly rising.
|
|
|
|
|
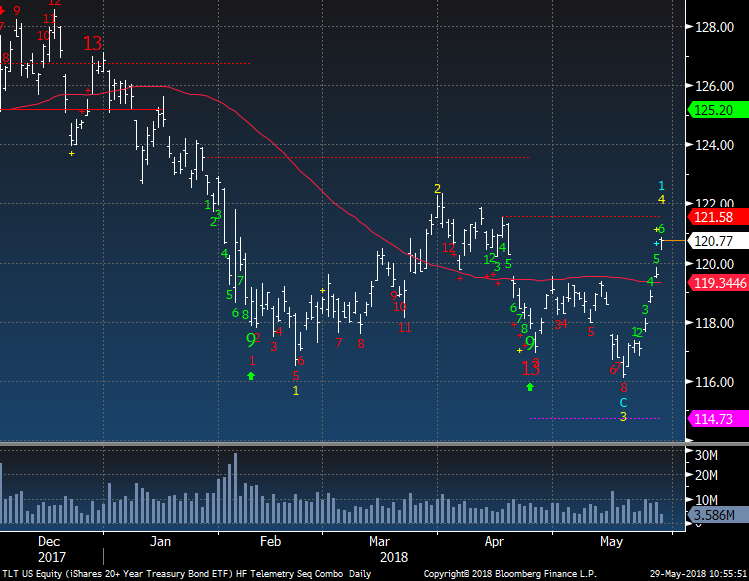
TLT Bond ETF did not get the recent downside Countdown to complete and I've been neutral on bonds. I have tried several times to get long bonds expecting a 'risk off' type of bounce. This could well be the move. 121.58- 1.22 is an important zone to watch.
|
|
|
|
|
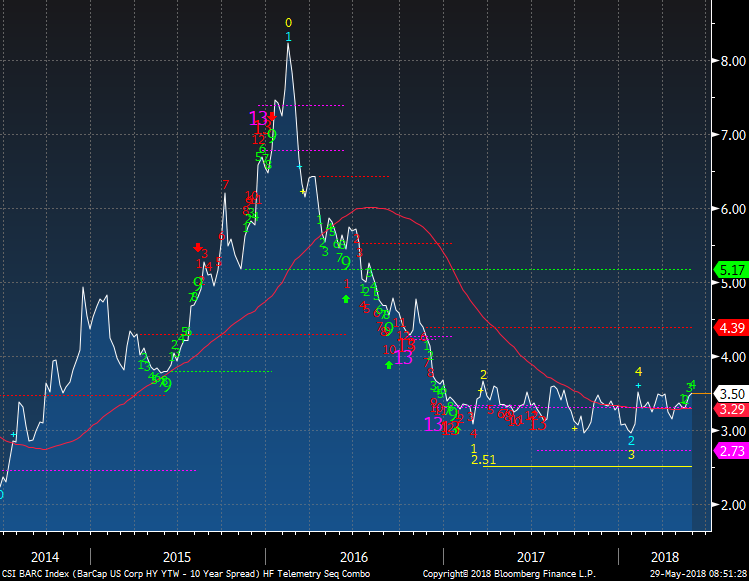
Credit spreads are quietly widening. They won't be quietly widening in the near future.
|
|
|
|
|
|
|
DEMARK SCREENS - Daily, Weekly, Monthly Upside/Downside Exhaustion Signals
|
|
|
S&P 1500 Universe:
DAILY UPSIDE 13: GIFI, HAS, RGR, SEE
DAILY DOWNSIDE 13: BRK/B, MANH, NWL, PRA, TRMD
DAILY UPSIDE WITH PRICE FLIP REVERSAL DOWN: AGYS
DAILY DOWNSIDE WITH PRICE FLIP REVERSAL UP: NONE
Updated: 5/29/18
WEEKLY UPSIDE 13: ABAX, APD, AVA, BCC, BCPC, CMTL, DE, EMR, FBP, FFIV, GWW, MU, NFLX, PX, RGS, SAM, SXC, TECH, WEX
WEEKLY DOWNSIDE 13: PDCO
Updated: 5/1/18
MONTHLY UPSIDE 13: CTXS, HSII, SYK, UFCS, WBS
MONTHLY DOWNSIDE 13: AKRX, HLX, HVT, MNK
Euro Stoxx 600 Universe:
DAILY UPSIDE 13: KYG ID, QIA GR, SAF FP
DAILY DOWNSIDE 13: NONE
DAILY UPSIDE WITH PRICE FLIP REVERSAL DOWN: AMEAS FH, LDO IM
DAILY DOWNSIDE WITH PRICE FLIP REVERSAL UP: HUH1V FH
Updated: 5/29/18
WEEKLY UPSIDE 13: ANTO LN, IHG LN
WEEKLY DOWNSIDE 13: SNH GR
Updated: 5/1/18
MONTHLY UPSIDE 13: HNR1 GR, HWDN LN, MHG NO
MONTHLY DOWNSIDE 13: AGK LN
Daily/Weekly DeMark upside/downside exhaustion signals (Sequential) Weekly updated on Monday's. Price flips occur when a stock closes higher/lower than four previous closes. The upside 13's are sell signals and downside 13's are buy signals. Price flip's are confirmation signals that increases potential for a price trend change. For example, if you are long a stock and there is an upside 13, you will want to take cautious action by selling down or out of a
position. If initiating a short sale with the upside 13's, we tend to start with a 1/2 size and add with the downside price flip. The opposite is true for when there are downside 13's. Take a 1/2 size position and add with the upside price flip. The DeMark Indicators are designed to assist the user with buying into weakness and selling into strength to anticipate trend exhaustion. Selling into a rally and buying into a decline often afford the opportunity to exit a trade without too serious a loss if wrong.
|
|
|
Unsubscribe me from Hedge Fund Telemetry
Hedge Fund Telemetry LLC, P.O. Box 4675, Greenwich, CT 06861, United States
CONFIDENTIALITY NOTE and DISCLAIMER: This message is for the named person's use only. It may contain confidential, proprietary or legally privileged material. No confidentiality or privilege is waived by any accidental or unintentional transmission. If you receive this message in error, please immediately delete it and all copies of it from your system, destroy any hard copies and notify the sender. You must not, directly or indirectly, use, disclose,
distribute, print or copy any part of this message if you are not the intended recipient. Hedge Fund Telemetry LLC. cannot guarantee the confidentiality of the material transmitted; therefore, information of a sensitive or confidential nature should not be transmitted. There is risk in trading markets. Hedge Fund Telemetry LLC reports are based on information gathered from various sources and believed to be reliable, but are not guaranteed as to accuracy and completeness. The information is subject to change without notice and Hedge Fund Telemetry LLC has no obligation to provide any updates or changes. Hedge Fund Telemetry LLC is providing this data for informational and educational purposes and does not believe that it is sufficient to base an investment decision on. This information should not be regarded as a solicitation or recommendation of any particular security or to engage in any trading strategy. One should always check with your licensed financial
advisor to determine suitability of any investments.
|
|
|
|
|