|
|
|
|
|
|
Checking in with the Smart Money Flow Index
|
|
|
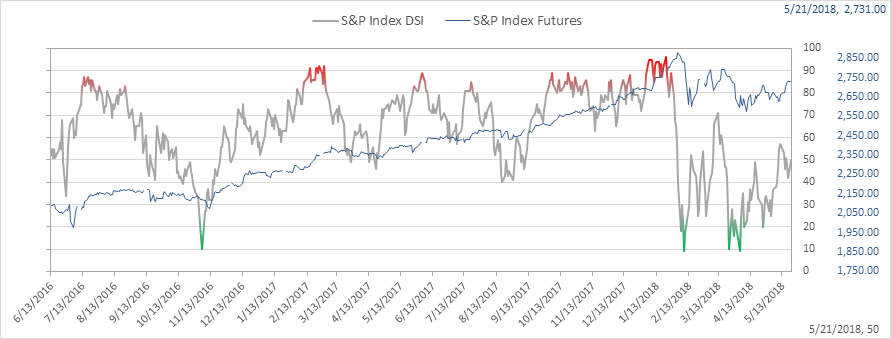
Last year I showed often the Smart Money Flow Index which is calculated by taking the action of the Dow in two time periods: the first 30 minutes and the close. The first 30 minutes represent emotional buying, driven by greed and fear of the crowd based on good and bad news. There is also a lot of buying on market orders and short covering at the opening. Smart money waits until the end and they very often test the market before by shorting heavily just to see how the market
reacts. Then they move in the big way. These heavy hitters also have the best possible information available to them and they do have the edge on all the other market participants.
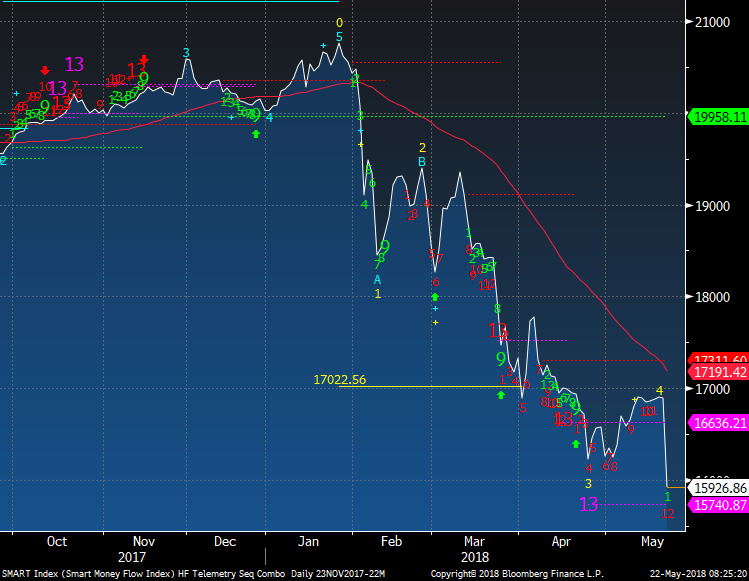
This chart from the peak on January 26th looks like it fell off a cliff, a big one like the Grand Canyon. Despite all of the calls for the market acting better, sellers still dominate the late day action. It's worth thinking about when you're making trades throughout the day. It may pay to go out to looong lunch and come back and make your decisions in the last hour. Chart is below.
Some other internals within the equity markets are surprisingly not confirming the recent stability seen in May. A couple below such as new 20 day highs or stocks within an index trading above the 50 day moving average are not giving me any reason to turn constructive on the equity markets at this point. Today I look at equity markets and some recent stock ideas.
I sent
the Hedge Fund Telemetry Currency Focus email early last night and I want to say thank you for all the suggestions and nice messages. Be sure to check it out even if you're not a currency trader since it is my belief the direction in the US Dollar will be a key catalyst on every other asset class in the coming quarters.
Notable:
- US Markets - Sentiment back at the midpoint - a look at some internals that are mixed
- Hedge Fund Telemetry Trade Ideas - Added NFLX short 2.5% size with daily and weekly exhaustion signals
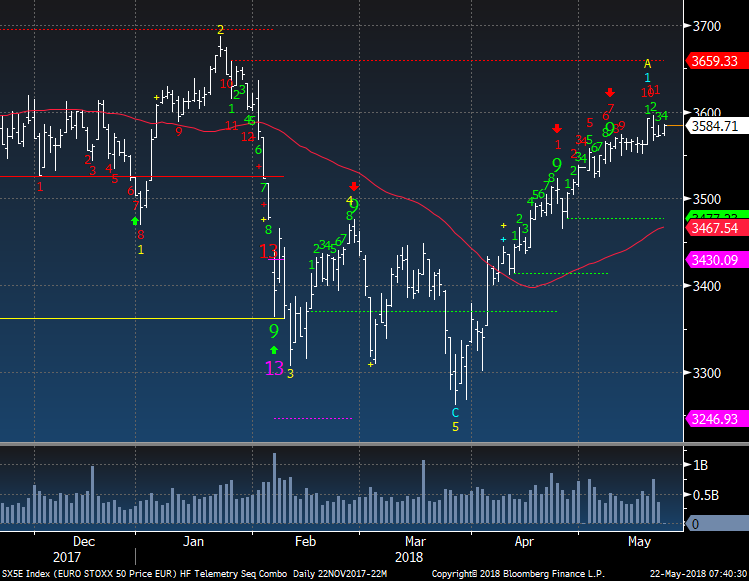
- European Markets - Extended and nearly exhausted on the Euro Stoxx 50
- Small and Micro Cap Indexes - A little upside left on the Small Cap daily and daily and weekly upside exhaustion signals now in play
- Smart Money Flow Index - Just
incredible
- Currencies - USD daily and weekly views
- Asian Markets - Nikkei Index very important to watch this close after upside exhaustion with extreme bullish sentiment
- Bloomberg World Index and Vanguard International (ex USA) - upside exhaustion now
- Recent Equity Ideas
- Bond Update
- DeMark Screens - Daily, Weekly, Monthly upside/downside exhaustion
signals within the S&P 1500 and Euro Stoxx 600
|
|
|
|
|
Here's a link to the Hedge Fund Telemetry market sentiment page with 40 charts of sentiment including equities, bonds, currencies, and commodities updated each day.
SPX bullish sentiment is at 50% again and still is in the last few weeks range
|
|
|
|
|
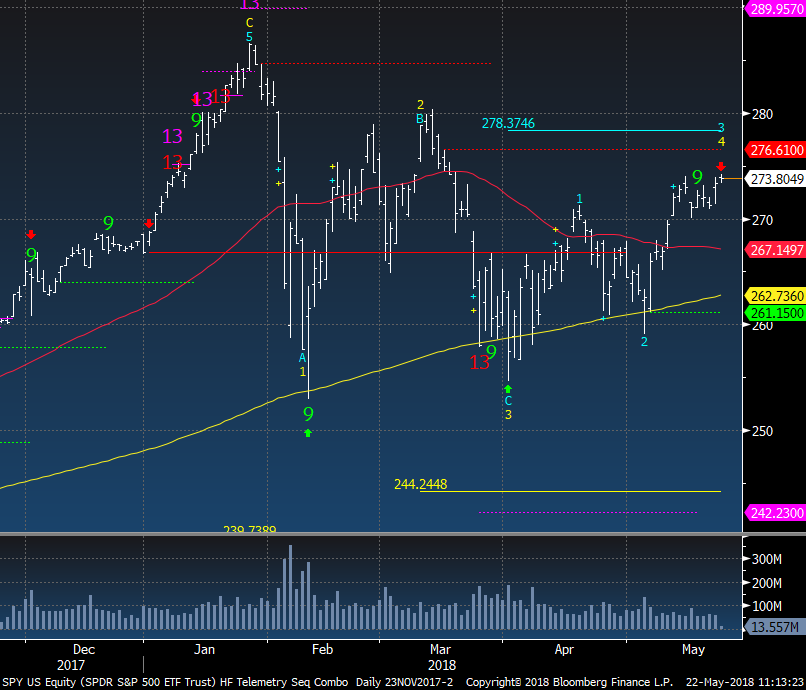
SPY still holding up at the top of the recent 2 week range.
|
|
|
|
|
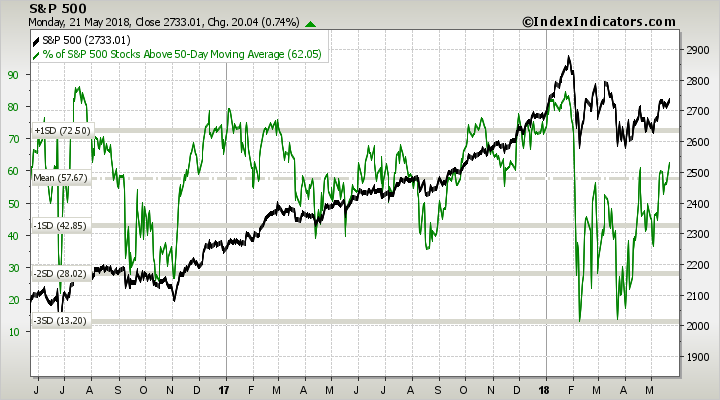
S&P 500 % of stocks above the 50 day moving average is at 62% and improving.
|
|
|
|
|
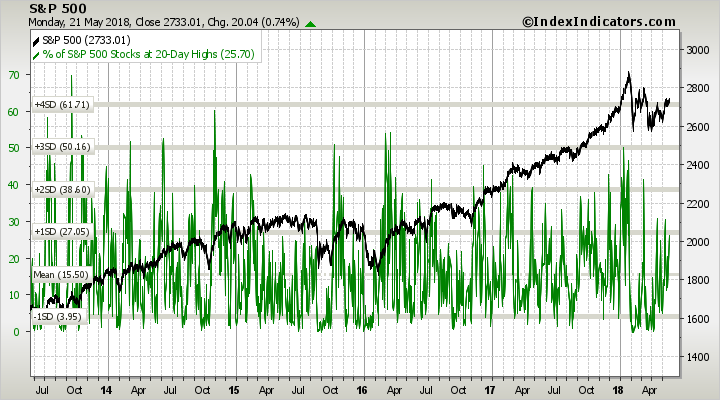
S&P 500 % of stocks making 20 day highs has not improved enough in the past couple weeks of gains
|
|
|
|
|
Nasdaq bullish sentiment is at 44%
|
|
|
|
|
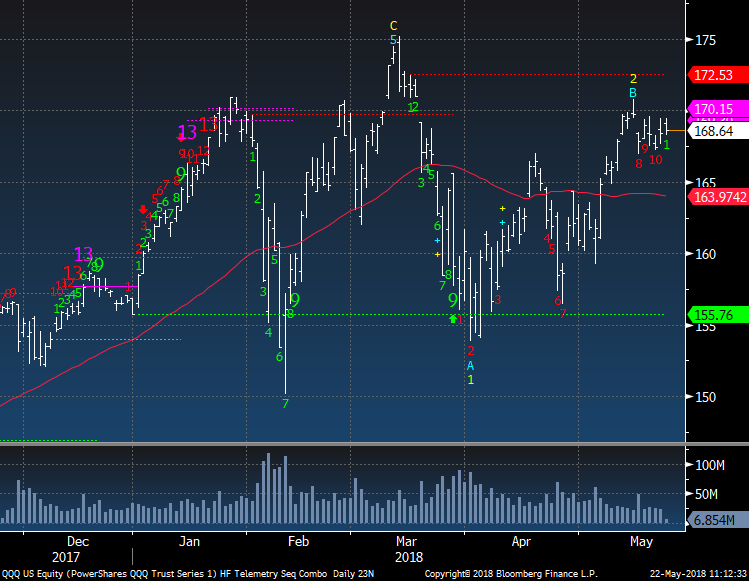
QQQ has been going sideways for 2 weeks. Watch when the closes are below the open.
|
|
|
|
|
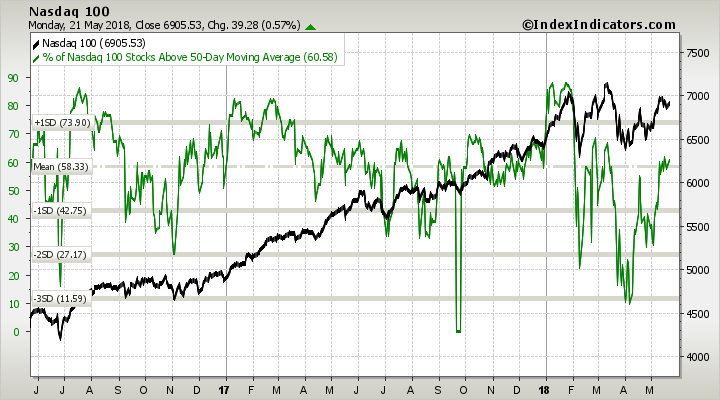
Nasdaq 100 % of stocks above the 50 day is at 60% and has made lower highs.
|
|
|
|
|
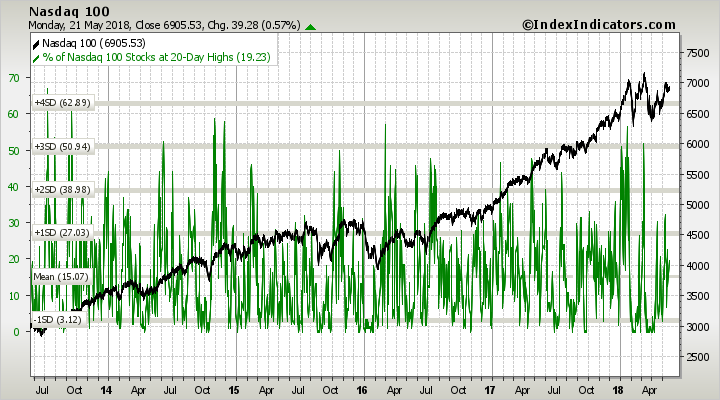
Nasdaq 100 % of stocks making new 20 day highs is at 19% and divergent with recent price action due to the large mega cap stocks doing the majority of the attribution
|
|
|
|
|
|
|
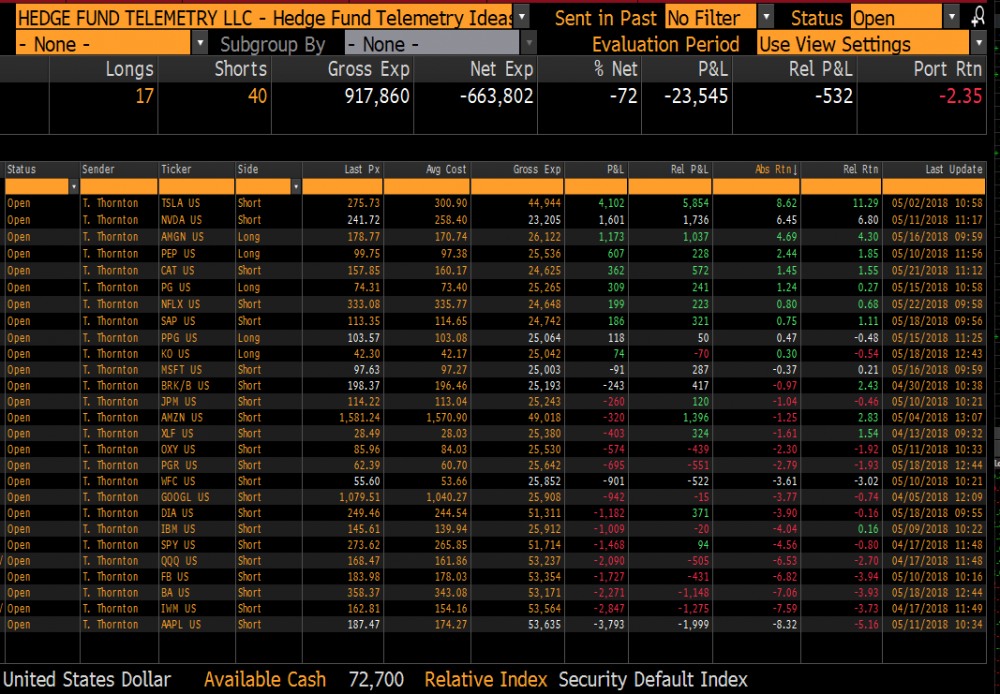
Hedge Fund Telemetry Trade Ideas
|
|
|
Trade Ideas - Added NFLX short again 2.5% size (charts below). Fins are up on lending news and I expect this to fade in a day or two. A note - my positioning net short is more than most people can do or follow but if there is one takeaway it is that I am still quite cautious overall.
|
|
|
|
|
|
|
|
|
Euro Stoxx 50 remains on day 11 of 13 with the upside red Sequential Countdown
|
|
|
|
|
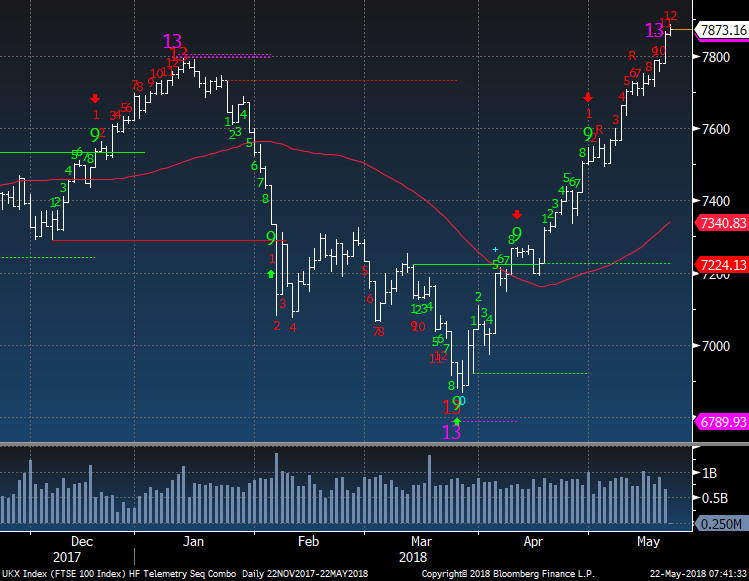
UK FTSE 100 had a recycled upside red Countdown and is now on day 12 of 13. A pullback should occur within the next 2 days.
|
|
|
|
|
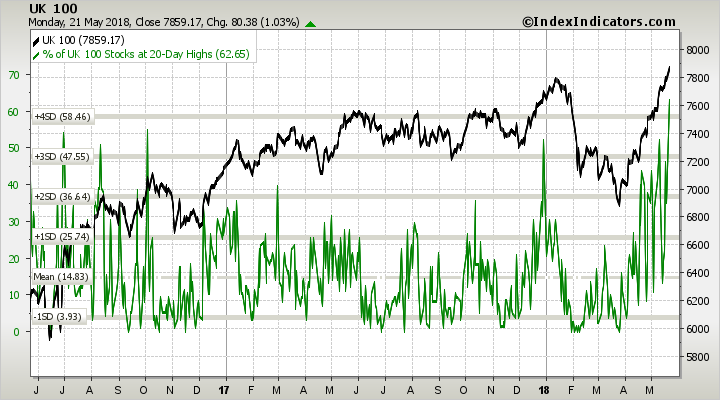
UK FTSE 100 % of stocks making 20 day highs is at 62% and it's a 4 std deviation move. This also should see some moderation as previous spikes have seen pullbacks soon after
|
|
|
|
|
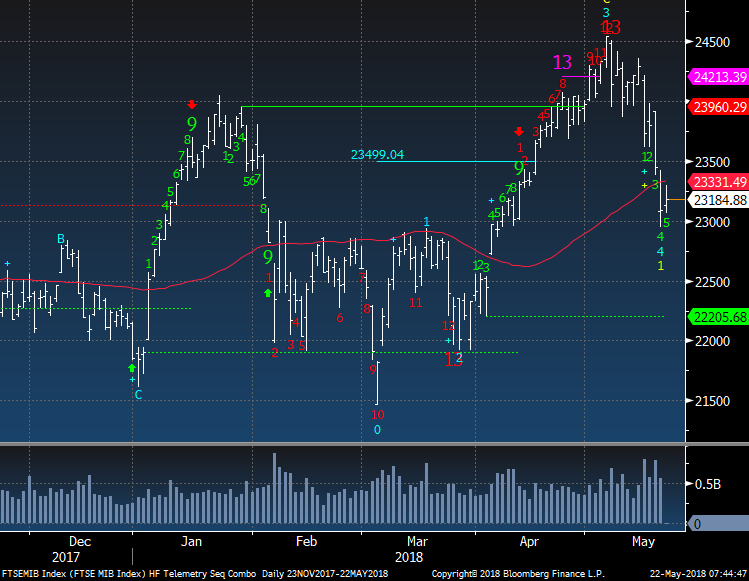
Italy is up a little today but this still looks like there is risk here for the Euro Zone
|
|
|
|
|
|
|
Small and Micro Cap Indexes
|
|
|
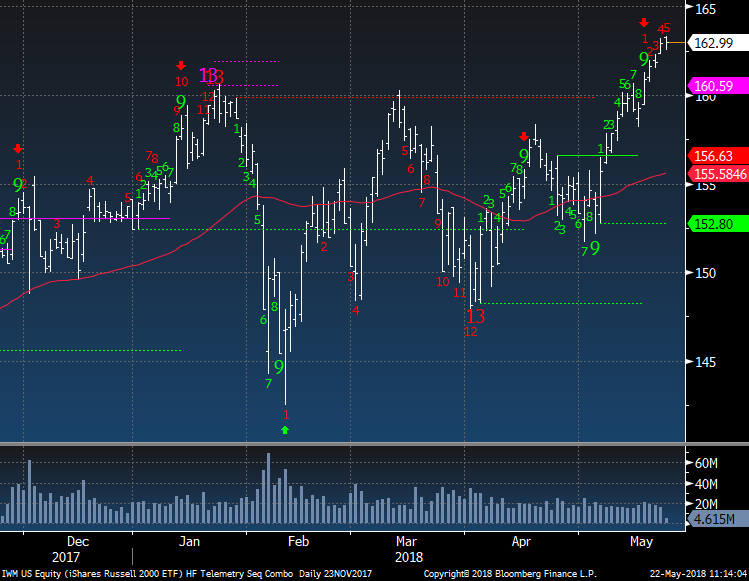
IWM Russell 2000 now has an upside red Sequential daily Countdown on day 5 of 13. The weekly shown recently has upside exhaustion so perhaps we'll see a little more upside
|
|
|
|
|
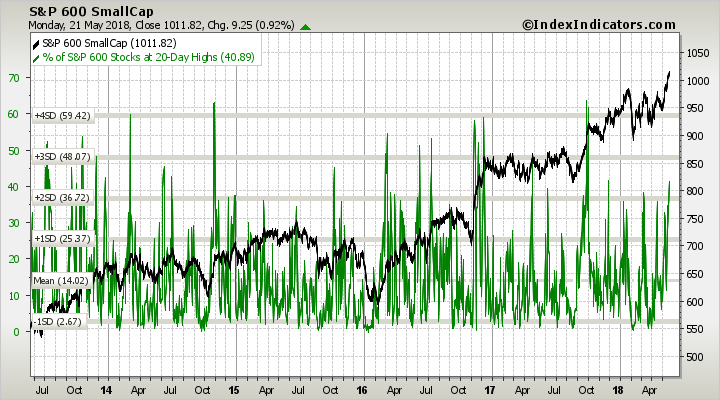
S&P Small Cap 600 has been quite strong however the % of stocks making 20 day highs is only 40%. Maybe this will continue to go a little higher. It just seems strange to me with the recent breakout that this isn't higher.
|
|
|
|
|
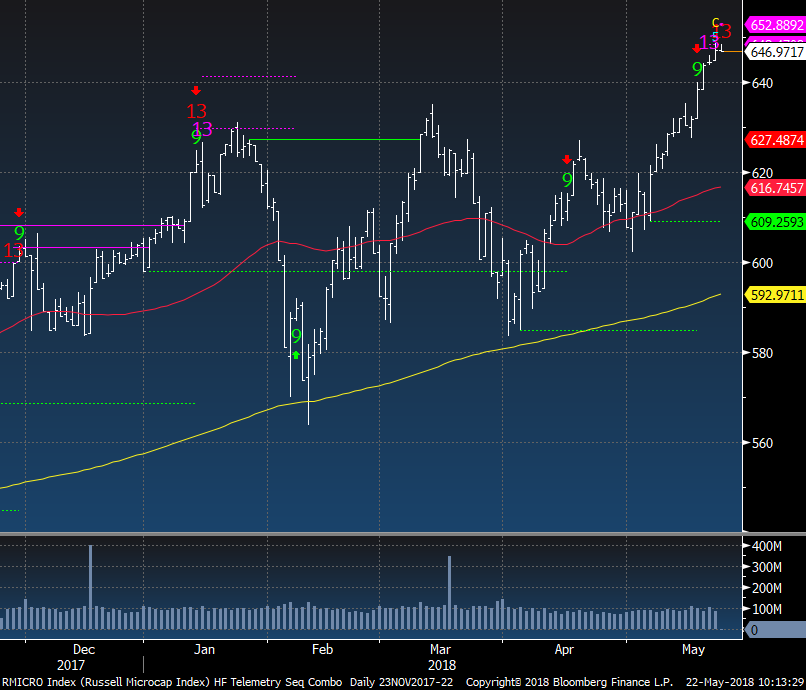
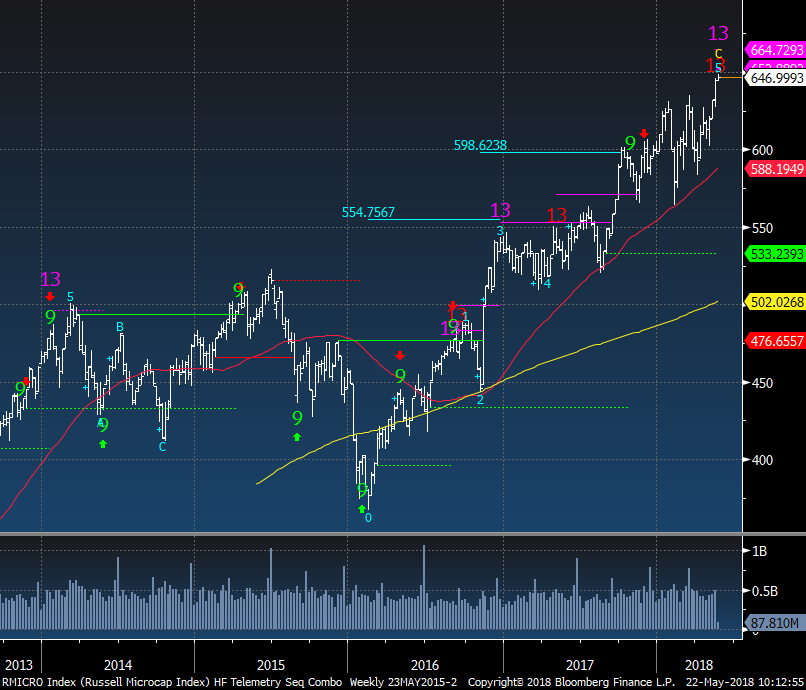
Russell Micro Cap index daily has both pink Combo and red Sequential upside exhaustion signals now
|
|
|
|
|
Micro Cap weekly also has upside pink Combo and red Sequential exhaustion 13's
|
|
|
|
|
|
|
|
|
The daily late last year was throwing off a bunch of upside exhaustion signals that made me take notice of potential market top. Now the daily has made a new low and is on day 12 of 13 with a red Countdown. Will this signal mark a turn? I'll keep you posted but you can just watch how the last hour trades and you'll know.
|
|
|
|
|
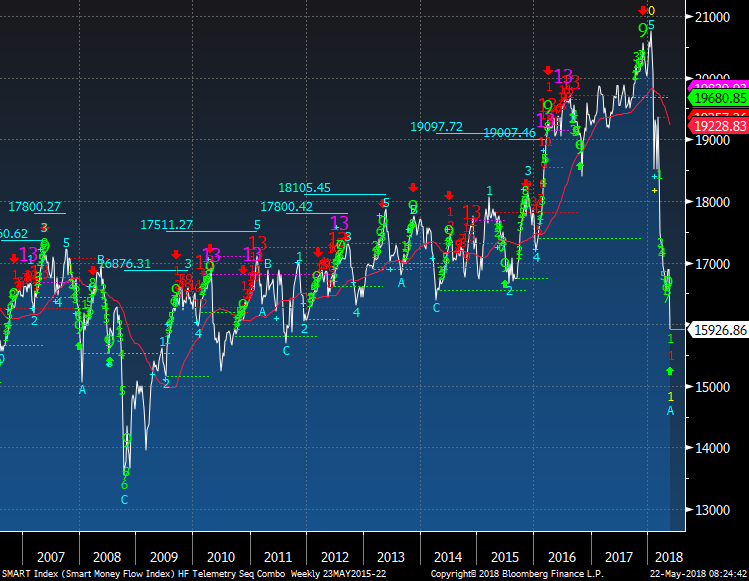
The weekly back in 2007 started to fall hard and it was a good signal for risk off. This year has been nothing short of remarkable.
|
|
|
|
|
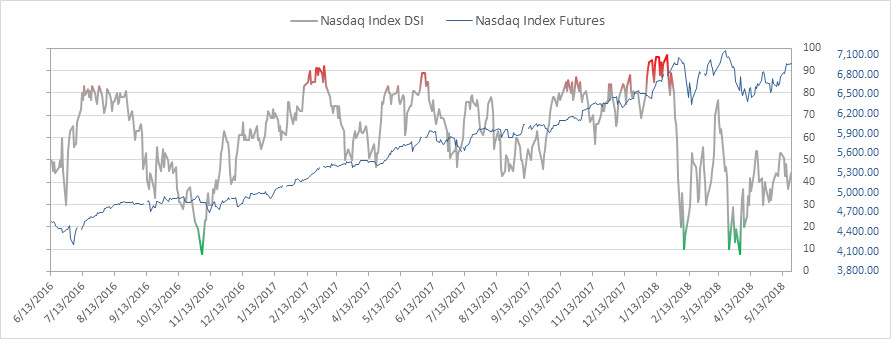
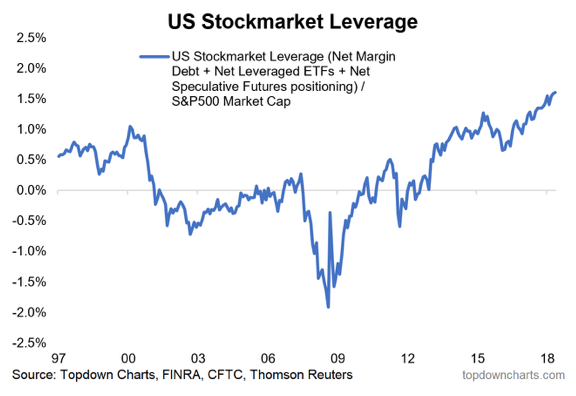
This was from Topdown Charts and is also remarkable considering the year we've had. This could be a real problem when this starts to unwind considering a lot of stocks and indexes are off the year highs.
|
|
|
|
|
|
|
USD Update - Daily vs Weekly View
|
|
|
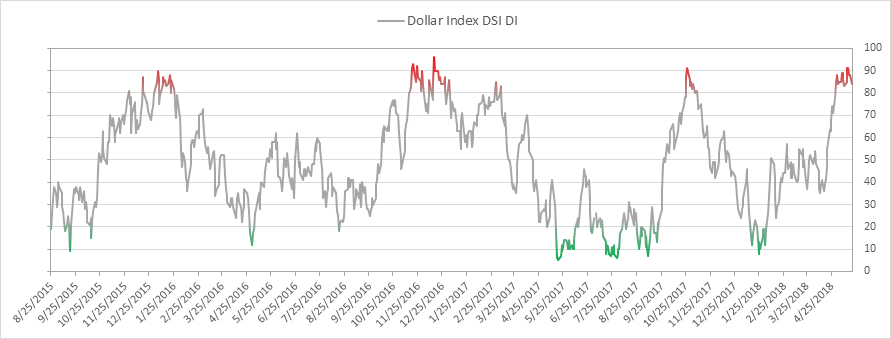
US Dollar bullish sentiment is at 84% and still in extreme zone
|
|
|
|
|
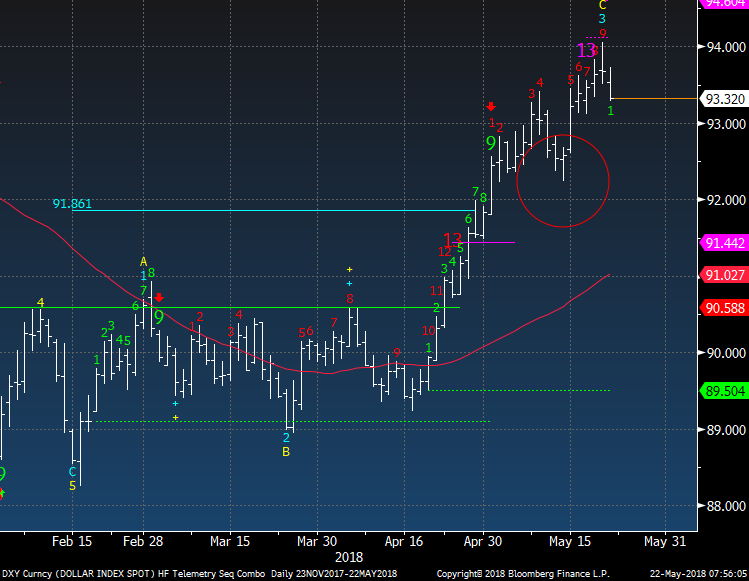
DXY Index has been in wave 3 and a pull back under a 13 day closing low is needed to trigger wave 4 and the upside wave 5 upside price objective. A pullback in the USD is due
|
|
|
|
|
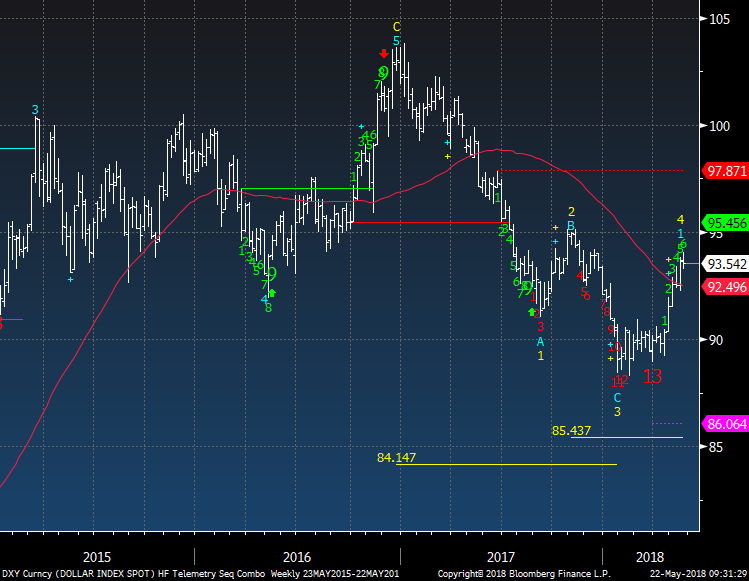
Weekly DXY Index shows the downside red Countdown 13 that took its sweet time after the 12. This pattern is either starting upside 5 waves or will fail under the recent yellow 2nd wave and will head lower to 85.43 downside wave 5 price objective. This is why I am watching the 95 level so close
|
|
|
|
|
|
|
|
|
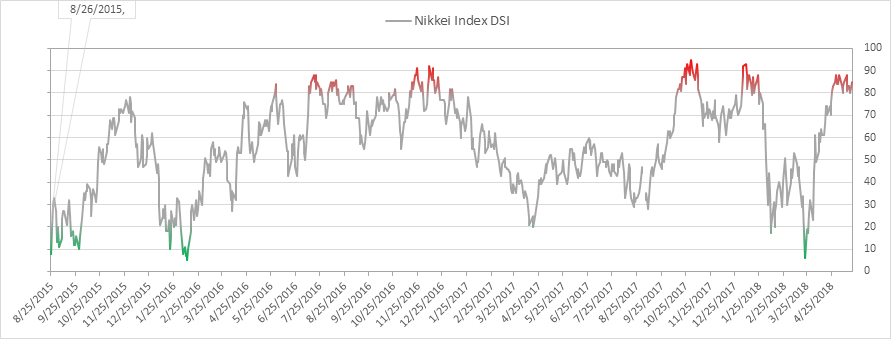
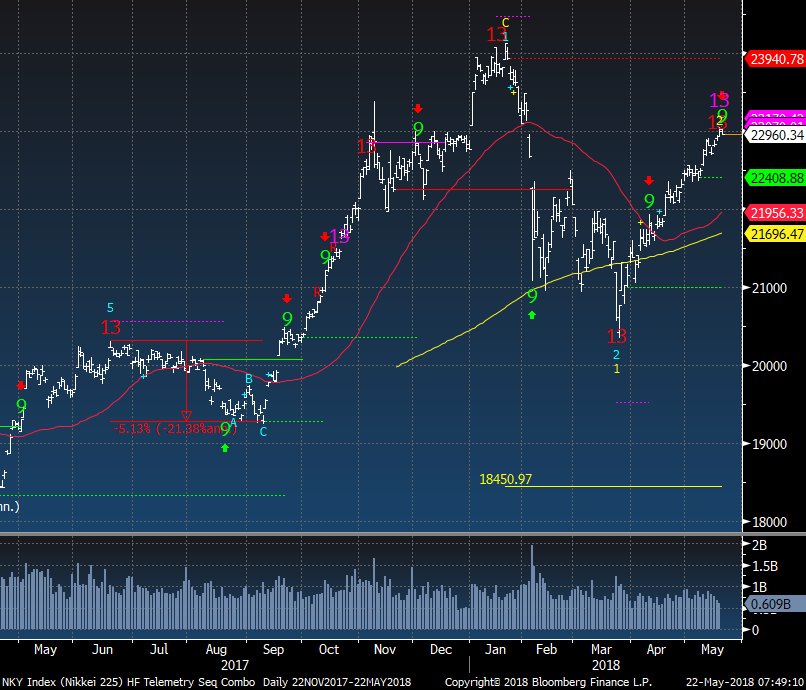
Nikkei bullish sentiment is at 85% and in the extreme zone
|
|
|
|
|
I am really focused on the Nikkei in Asia as the recent upside exhaustion signals will see a pullback or total failure under the March lows. This could have global implications
|
|
|
|
|
|
|
Bloomberg World Index and Vanguard Total International (ex USA)
|
|
|
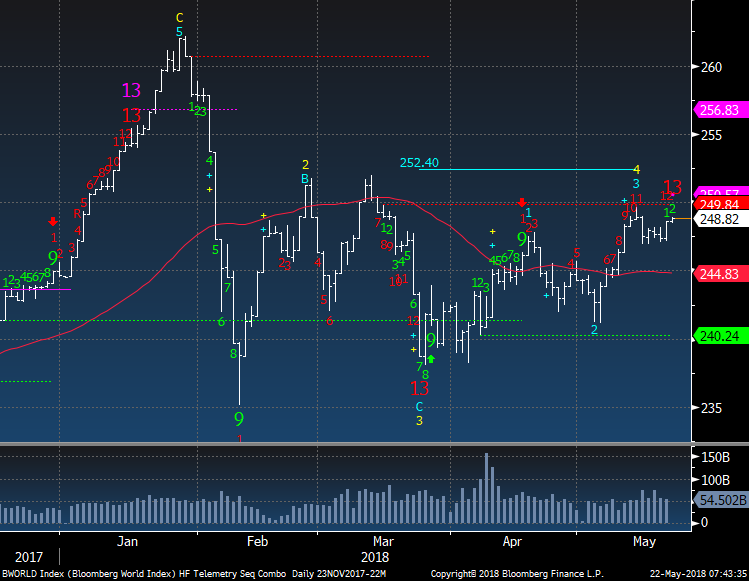
Bloomberg World Index has an upside red Countdown 13 exhaustion today. 244.83 is the 50 day and if that breaks then there will be some problems quite evident
|
|
|
|
|
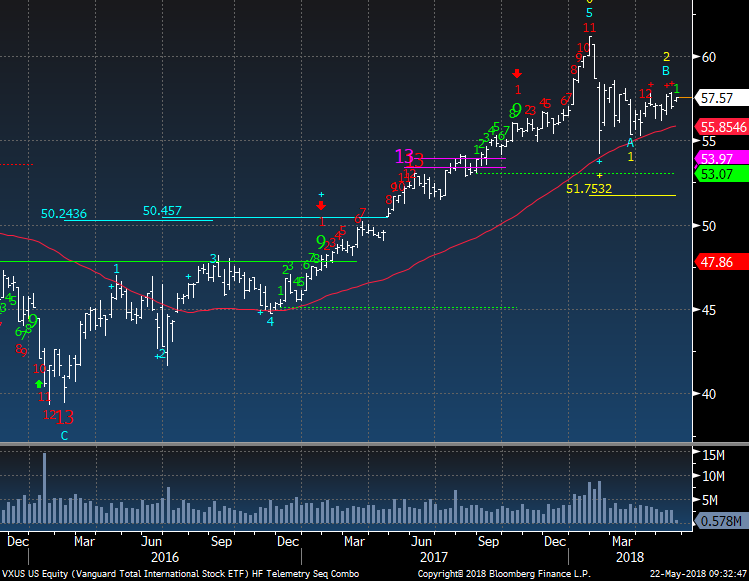
Vanguard International ex USA weekly needs one more push higher to close above the 8th red bar on the Countdown. Failure under 55.85 the 50 day will be notable
|
|
|
|
|
|
|
|
|
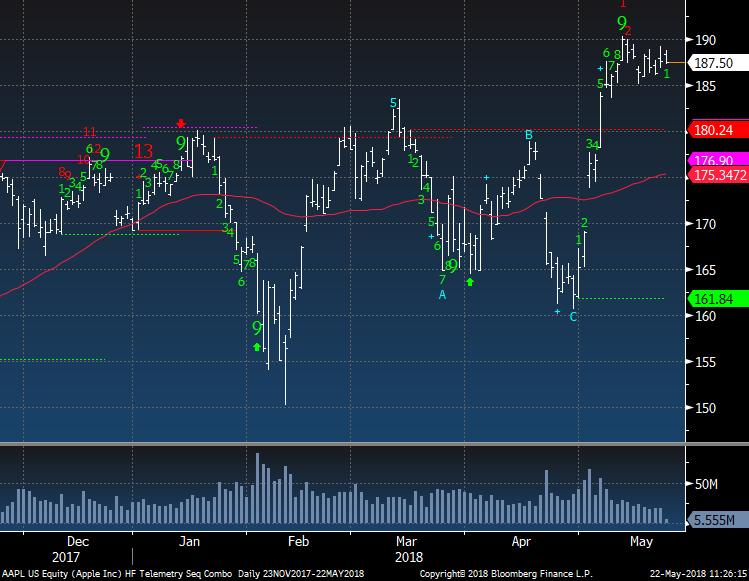
AAPL has been going sideways for the past two weeks. 185 is support and 190 is a breakout level to watch. Honestly I wasn't so concerned after the earnings gap up and buyback announcement to get short. What did surprise me and bug me was the reaction after Buffett said he already bought stock in Q1. A break down under 185 should see this retrace back to the 50 day at 175. Apple is a product driven stock and the recent products are on the refresh year and
we know sales haven't been spectacular as years past. Services are doing fine but that's not enough in my opinion
|
|
|
|
|
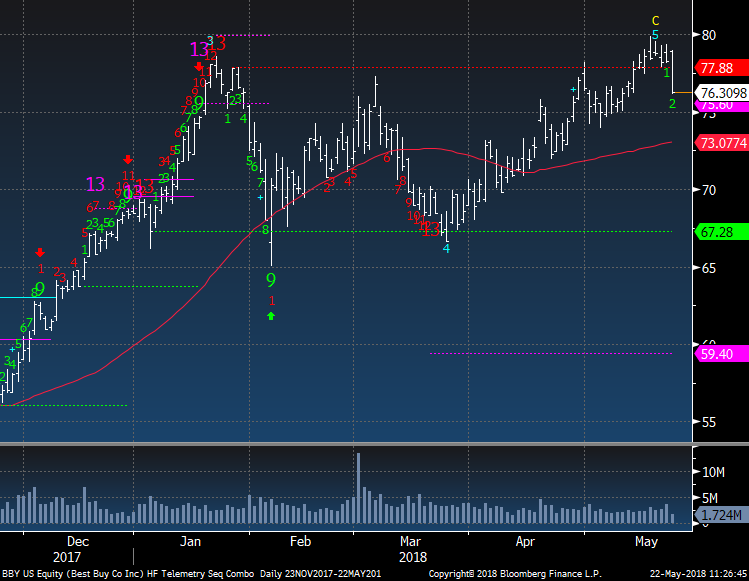
Best Buy was a short idea that drifted up and I stopped out. It's down 3.5% today and will reevaluate getting back into this soon
|
|
|
|
|
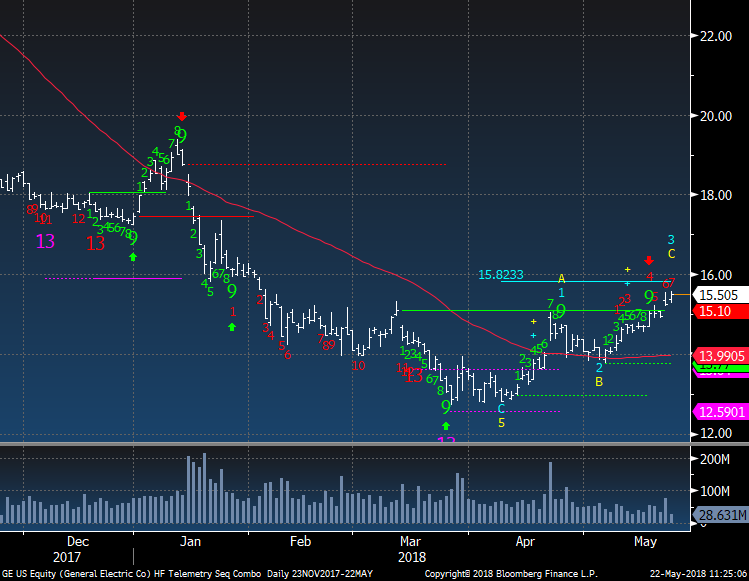
GE continues to trade well and I took profits too soon on this and I'm sorry about that but it's in wave 3 so I'll look to buy it back in wave 4 for the bigger upside move in wave 5.
|
|
|
|
|
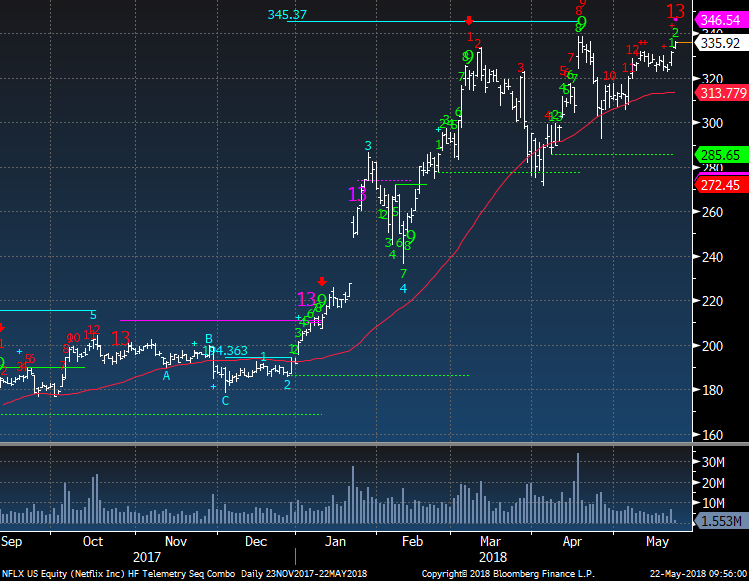
NFLX was a recent short idea that worked with the green Setup on the upside after earnings. I covered it as it held the 50 day and believed the upside red Sequential was worth waiting for and today it triggered so I added a 2.5% sized short position in the Trade Ideas.
|
|
|
|
|
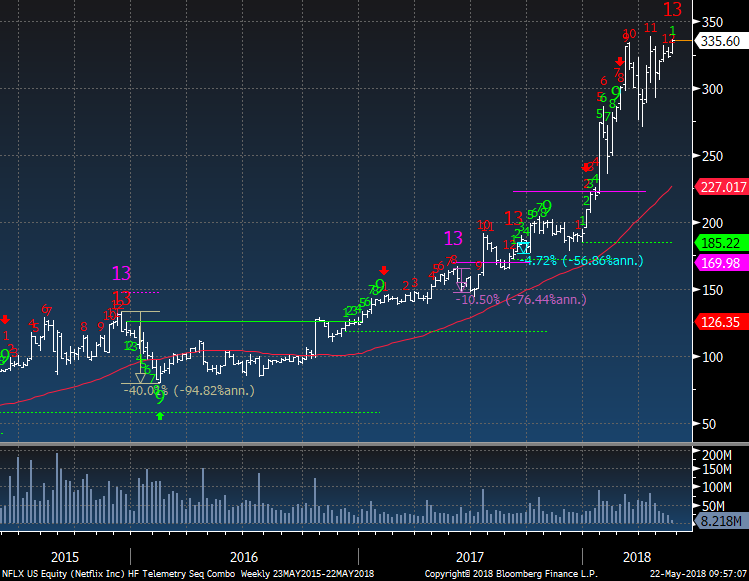
NFLX also has a weekly upside exhaustion and you know how I like to see time layering with upside or downside exhaustion signals together! Recent signals have worked in the past couple years too.
|
|
|
|
|
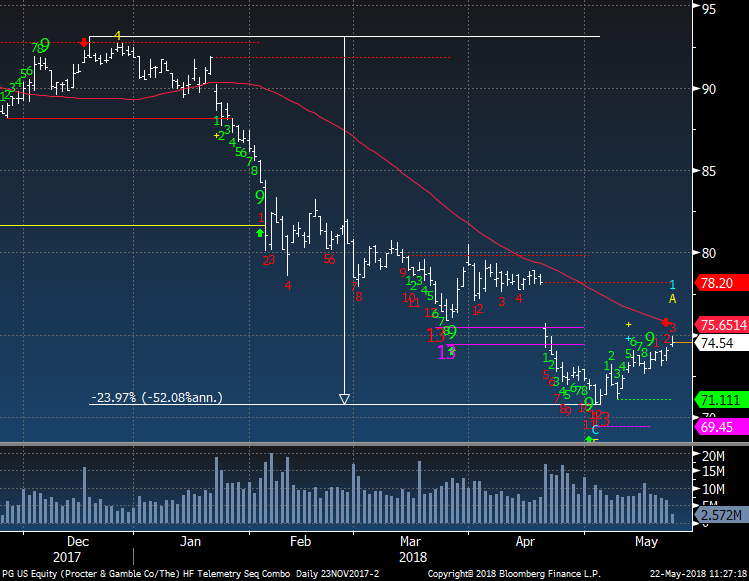
PG is a recent new long idea and it now has an upside red Countdown on day 3 of 13.
|
|
|
|
|
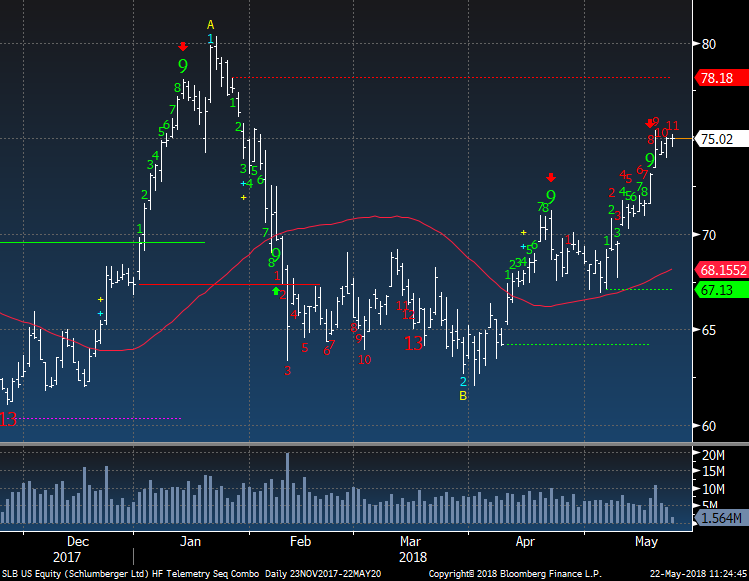
SLB was a recent long idea that worked out well but I sold it a little early with the recent upside exhaustion signals on all the energy ETF's. If you're still long it's on day 11 of 13.
|
|
|
|
|
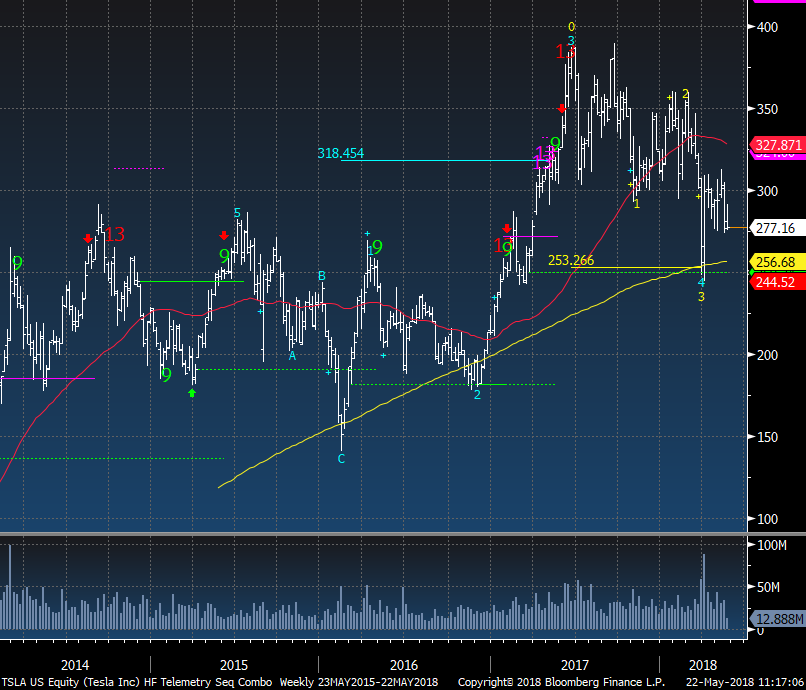
Tesla is on the edge of a major breakdown. The implications are quite severe if this falls another 25 points as it will no doubt shake the longs who have held on through all the chaos in the past year. One added risk is Elon Musk is highly levered with his TSLA stock and he will have to either sell down some of his stake or add collateral. To even fathom a CEO getting a margin call should scare the long holders besides the balance sheet looking very much
cash starved. Don't forget the debt that needs to get rolled over soon too. Tesla will be the story of the year!
|
|
|
|
|
|
|
|
|
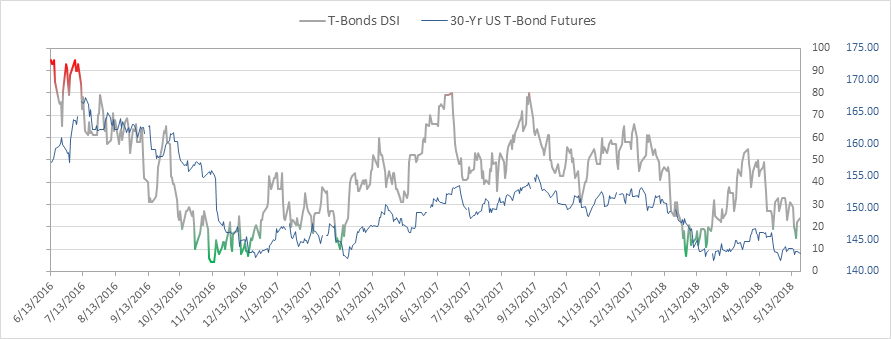
Bond bullish sentiment is at 24% and off the recent low of 15%. I do believe this can work down to 10%
|
|
|
|
|
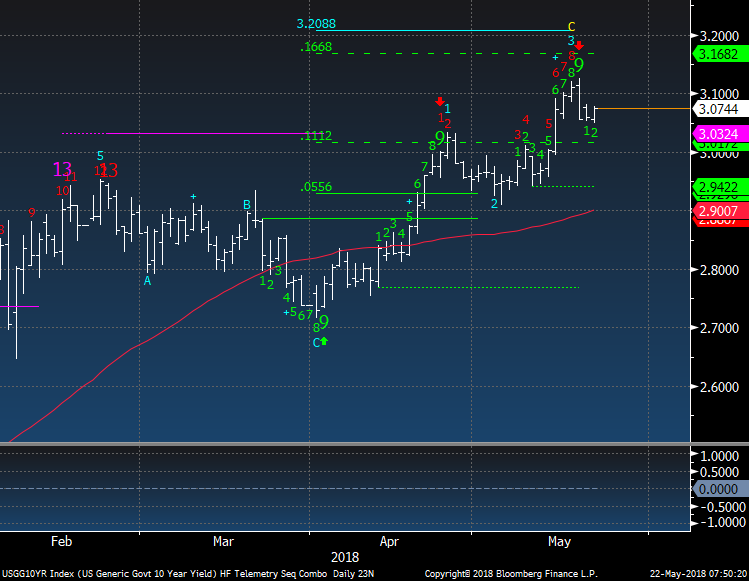
US 10 year yield is backing off with the recent upside green Setup 9. There is decent support at 3% and I wouldn't be shocked to see some yield pullback before it moves higher.
|
|
|
|
|
|
|
DEMARK SCREENS - Daily, Weekly, Monthly Upside/Downside Exhaustion Signals
|
|
|
Daily/Weekly DeMark upside/downside exhaustion signals (Sequential) Weekly updated on Monday's. Price flips occur when a stock closes higher/lower than four previous closes.
The upside 13's are sell signals and downside 13's are buy signals. Price flip's are confirmation signals that increases potential for a price trend change. For example, if you are long a stock and there is an upside 13, you will want to take cautious action by selling down or out of a
position. If initiating a short sale with the upside 13's, we tend to start with a 1/2 size and add with the downside price flip. The opposite is true for when there are downside 13's. Take a 1/2 size position and add with the upside price flip. The DeMark Indicators are designed to assist the user with buying into weakness and selling into strength to anticipate trend exhaustion. Selling into a rally and buying into a decline often afford the opportunity to exit a trade without too serious a loss if wrong.
S&P 1500 Universe:
DAILY UPSIDE 13: AKAM, DNR, EGOV, EOG, INDB, IPCC, MCY, MMSI, MOH, MOS, NFX, NSP, TG,
VRSN
DAILY DOWNSIDE 13: VIAB
DAILY UPSIDE WITH PRICE FLIP REVERSAL DOWN: ABMD, CLF, EGOV, LGND
DAILY DOWNSIDE WITH PRICE FLIP REVERSAL UP: ADT, BLL, CBRL, CLX, DBD, OI, REG, RRTS, WM
Updated: 5/21/18
WEEKLY UPSIDE 13: BRS, CNMD, CUB, CVG, GHL, GWR, HP, MASI, MRO, NSC, MNK, QNST, RJF, SGMS, WPX
WEEKLY DOWNSIDE 13: ALK, PZZA
Updated: 5/1/18
MONTHLY UPSIDE 13: CTXS, HSII, SYK, UFCS, WBS
MONTHLY DOWNSIDE 13: AKRX, HLX, HVT, MNK
Euro Stoxx 600 Universe:
DAILY UPSIDE 13: AHT LN, GSK LN, HLMA LN, HPOLB SS, IBE SM, NXT LN, SVT LN
DAILY DOWNSIDE 13: BKIA SM
DAILY UPSIDE WITH PRICE FLIP REVERSAL DOWN: BVS LN, IBE SM
DAILY DOWNSIDE WITH PRICE FLIP REVERSAL UP: INVP LN
Updated: 5/21/18
WEEKLY UPSIDE 13: AAL LN, AMS SM, BP/LN, FP FP, GN DC, RMG LN, SAF FP, STM IM, UBM LN, UMI BB
WEEKLY DOWNSIDE 13: FER SM
Updated: 5/1/18
MONTHLY UPSIDE 13: HNR1 GR, HWDN LN, MHG NO
MONTHLY DOWNSIDE 13: AGK LN
|
|
|
Unsubscribe me from Hedge Fund Telemetry
Hedge Fund Telemetry LLC, P.O. Box 4675, Greenwich, CT 06861, United States
CONFIDENTIALITY NOTE and DISCLAIMER: This message is for the named person's use only. It may contain confidential, proprietary or legally privileged material. No confidentiality or privilege is waived by any accidental or unintentional transmission. If you receive this message in error, please immediately delete it and all copies of it from your system, destroy any hard copies and notify the sender. You must not, directly or indirectly, use, disclose,
distribute, print or copy any part of this message if you are not the intended recipient. Hedge Fund Telemetry LLC. cannot guarantee the confidentiality of the material transmitted; therefore, information of a sensitive or confidential nature should not be transmitted. There is risk in trading markets. Hedge Fund Telemetry LLC reports are based on information gathered from various sources and believed to be reliable, but are not guaranteed as to accuracy and completeness. The information is subject to change without notice and Hedge Fund Telemetry LLC has no obligation to provide any updates or changes. Hedge Fund Telemetry LLC is providing this data for informational and educational purposes and does not believe that it is sufficient to base an investment decision on. This information should not be regarded as a solicitation or recommendation of any particular security or to engage in any trading strategy. One should always check with your licensed financial
advisor to determine suitability of any investments.
|
|
|
|
|