|
|
|
|
|
|
|
|
Just charts today...
Currency Focus email out tonight or tomorrow morning
Week Ahead will be out Sunday morning
Here's the link to yesterday's webinar
Have a great weekend!
Notable:
- US Markets - Sentiment still relatively weak, SPY vs IWM has exhaustion which says Russell out performance could be ending soon.
- Hedge Fund Telemetry Trade Ideas - Added KO long, PGR short, Doubled up BA short
- High Lows and Cumulative Breadth - High lows not impressive and cumulative breadth is not a great timing indicator
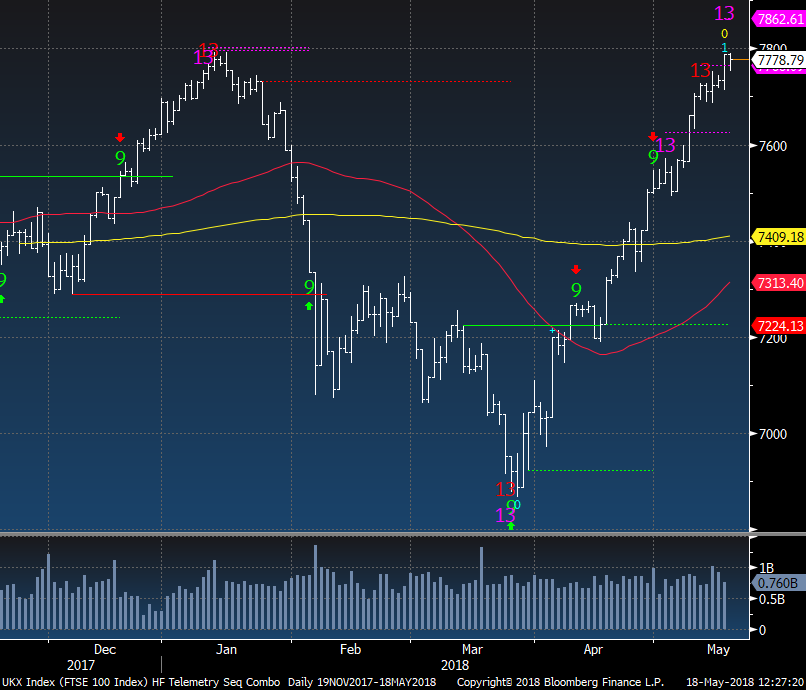
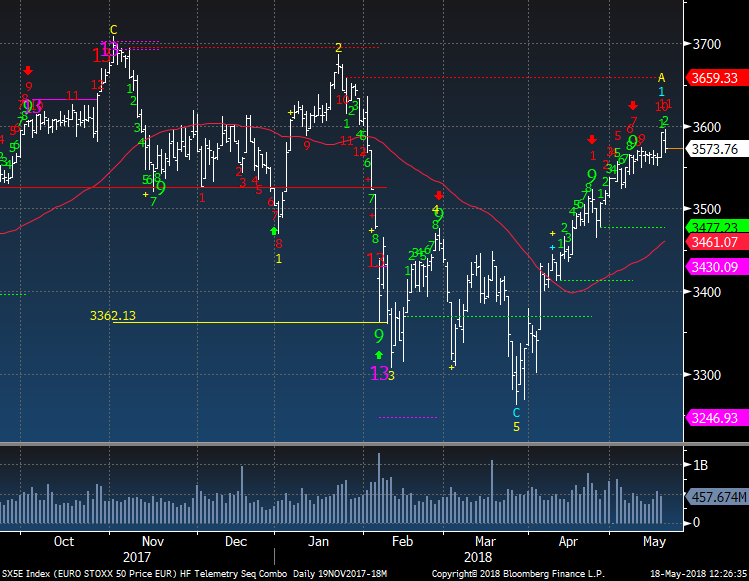
- European Markets - FTSE 100 upside exhaustion, Euro Stoxx 50 closer
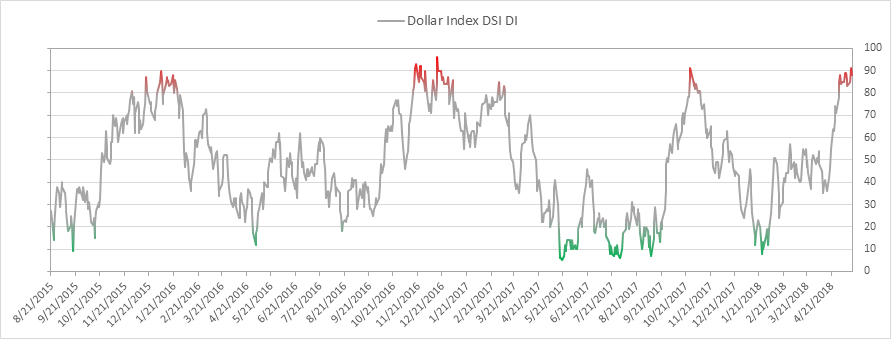
- Currencies - US Dollar
should pullback before going higher
- Asian Markets - Nikkei has upside 13 Countdown exhaustion today
- Energy Update - Lot's of upside exhaustion signals with backdrop of very high sentiment
- New Trade Ideas - Details
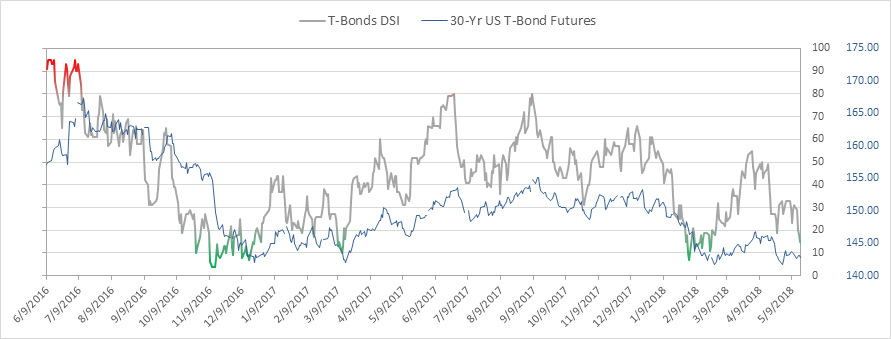
- Bond Update - Could see a stalling of the upside before higher. Sentiment is at 15% now
- DeMark Screens - Daily, Weekly, Monthly upside/downside exhaustion signals within the S&P 1500 and Euro Stoxx 600
|
|
|
|
|
Here's a link to the Hedge Fund Telemetry market sentiment page with 40 charts of sentiment including equities, bonds, currencies, and commodities updated each day.
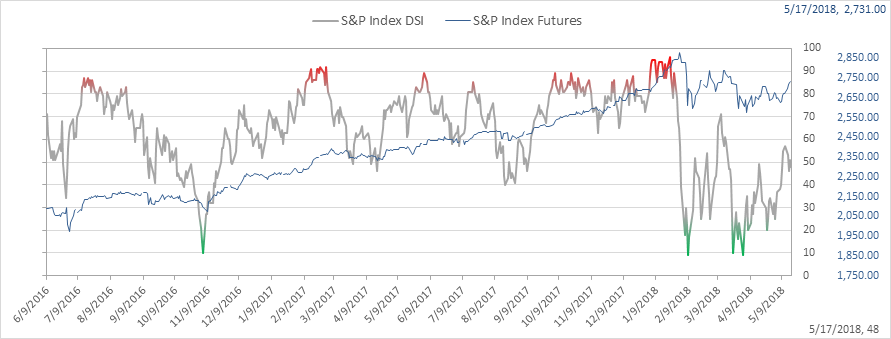
SPX bullish sentiment is at 48% and stuck in the mid point of the range
|
|
|
|
|
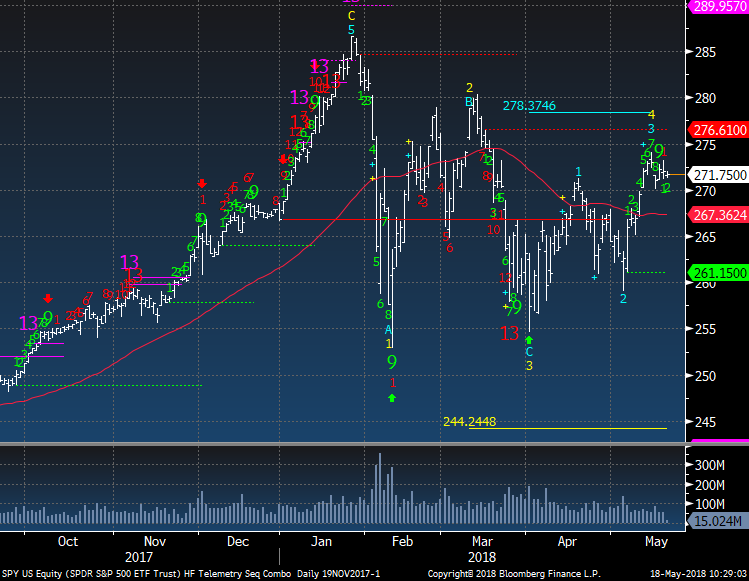
SPY down a little again today. Watching 270 for short term support
|
|
|
|
|
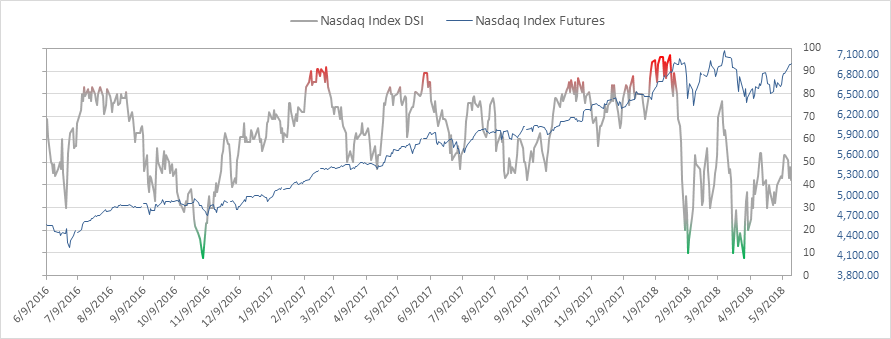
Nasdaq bullish sentiment is at 42% and weaker than SPX. A break of 30% would likely see much deeper selling
|
|
|
|
|
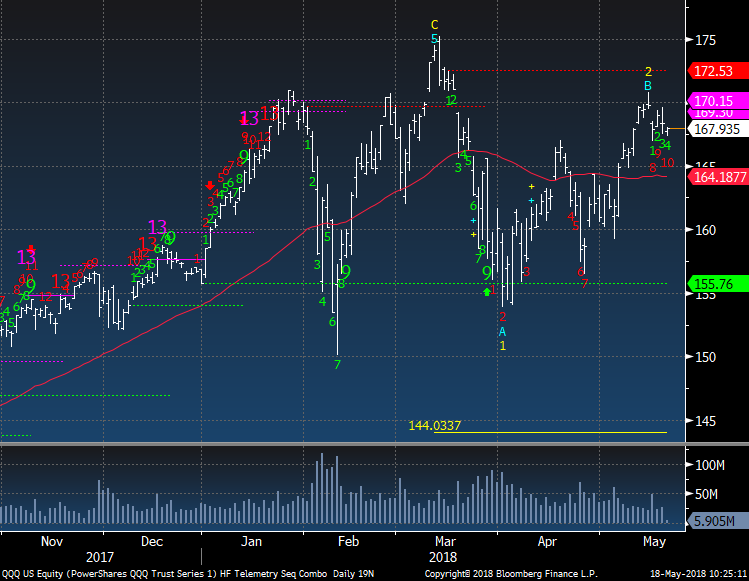
QQQ is congested after making a near term high last week. 164 the 50 day is really key
|
|
|
|
|
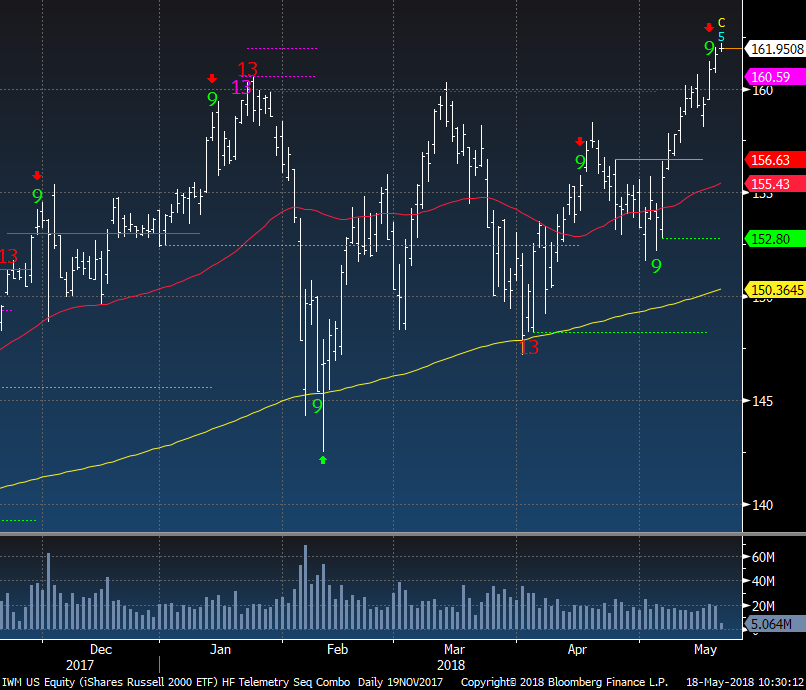
IWM breaking out from what everyone who doesn't use DeMark indicators is saying. The breakouts into upside exhaustion signals tend to fail
|
|
|
|
|
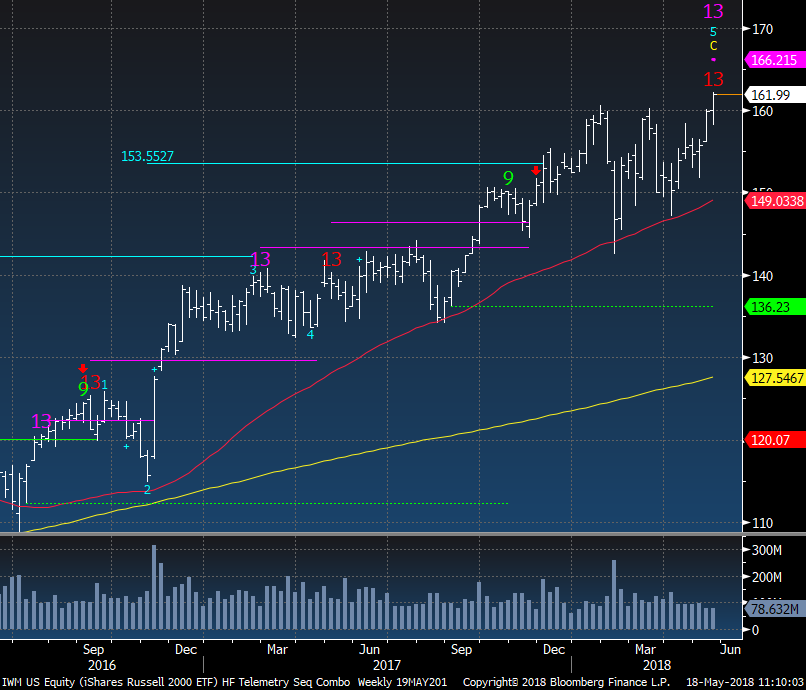
IWM Weekly has both pink Combo and red Sequential upside Countdown exhaustion signals
|
|
|
|
|
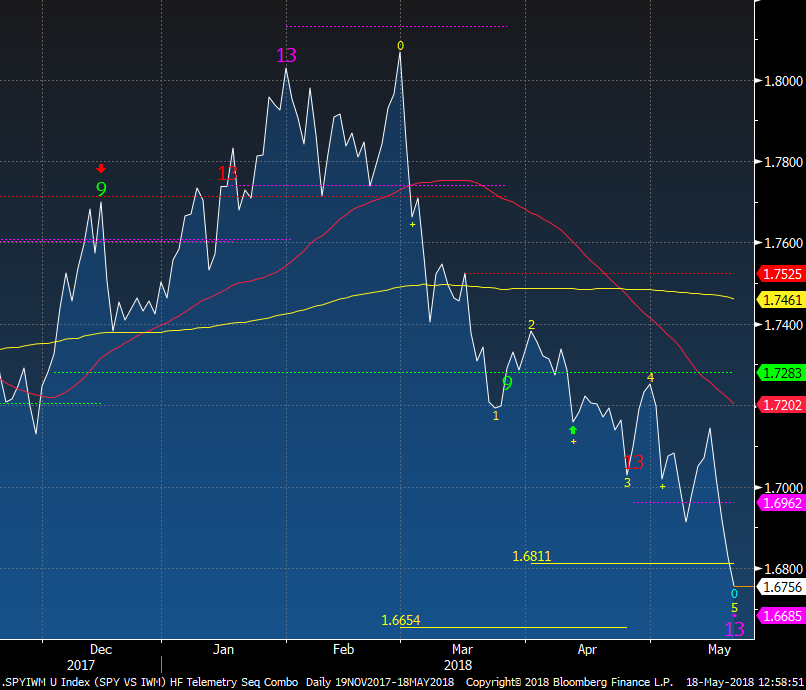
SPY vs IWM ratio has a combo 13 today. Another sign that the long small cap trade is likely over soon.
|
|
|
|
|
|
|
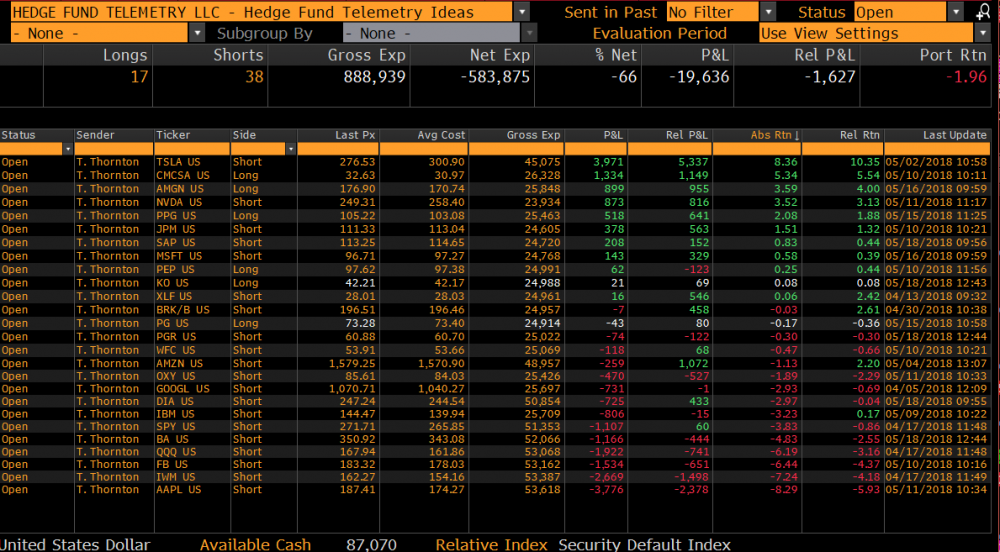
Hedge Fund Telemetry Trade Ideas
|
|
|
Trade Ideas: Added KO long, PGR short both 2.5% size. Doubled up BA short to 5%. Details below
|
|
|
|
|
|
|
|
|
UK FTSE 100 with some upside exhaustion here at the highs
|
|
|
|
|
Euro Stoxx 50 on day 11 of 13 with an upside Countdown
|
|
|
|
|
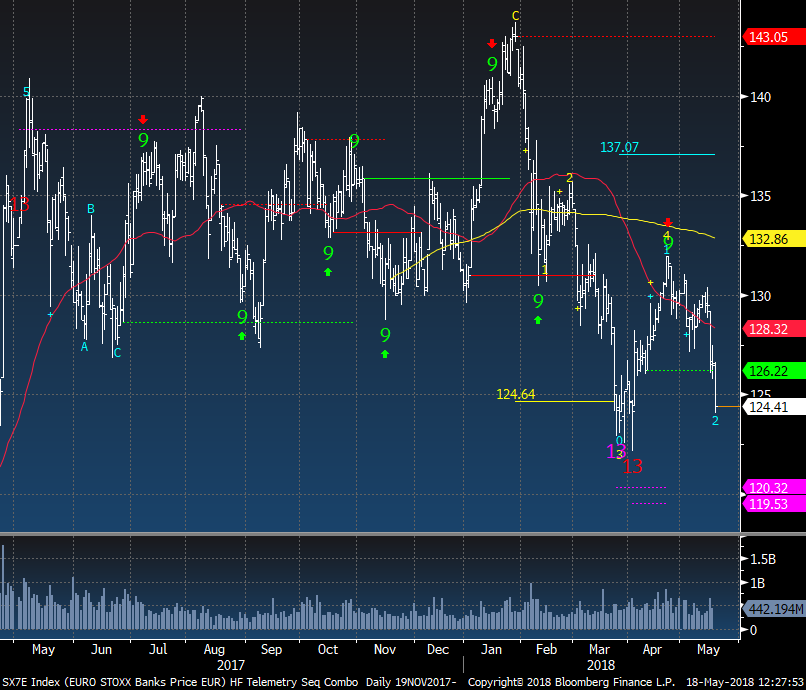
Euro Bank Index continues sharply lower. I have been negative on Euro banks for a while so nothing new
|
|
|
|
|
|
|
|
|
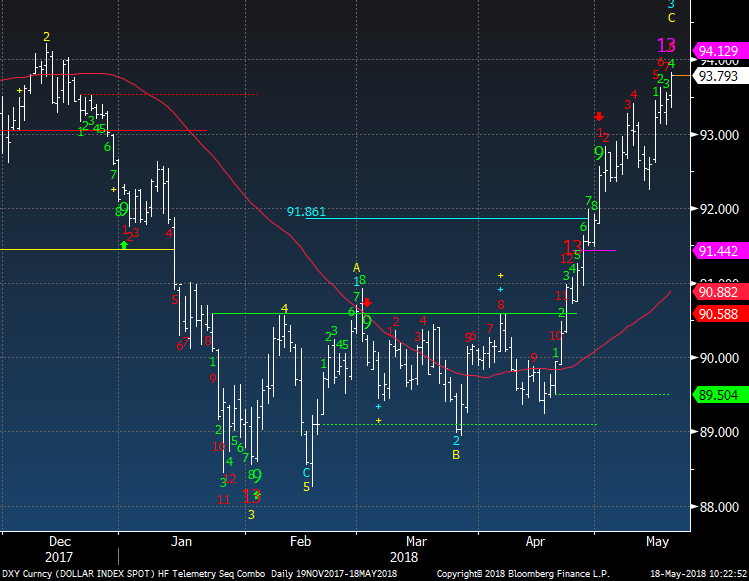
US Dollar bullish sentiment is at 88% and remains in the extreme zone
|
|
|
|
|
DXY US Dollar Index now has a pink Combo 13 and is on day 8 of 13 with the red Sequential Countdown. I expect a higher low ahead especially with the extreme sentiment, and then higher
|
|
|
|
|
|
|
| High Low's and Cumulative Breadth
|
|
|
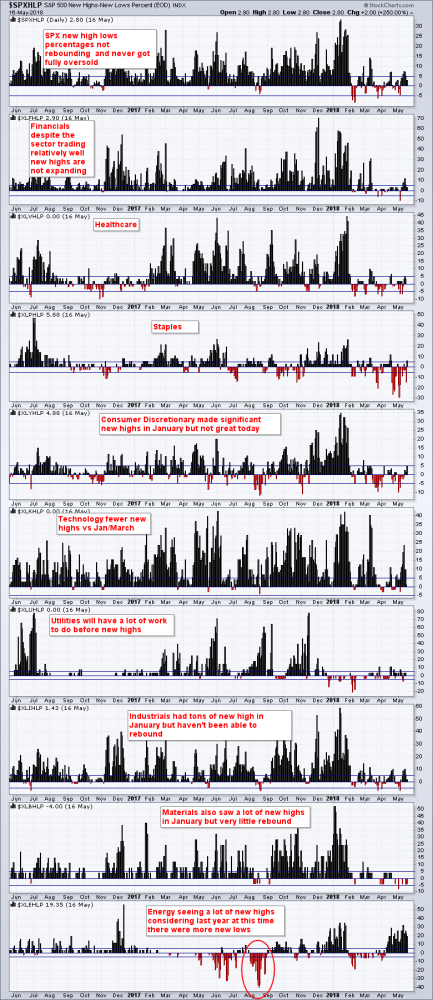
This is the high low data for the SPX and subsectors. What stands out is the lack of new highs except for Energy at the bottom. If cumulative breadth is so good at the highs shouldn't we see more new highs?
|
|
|
|
|
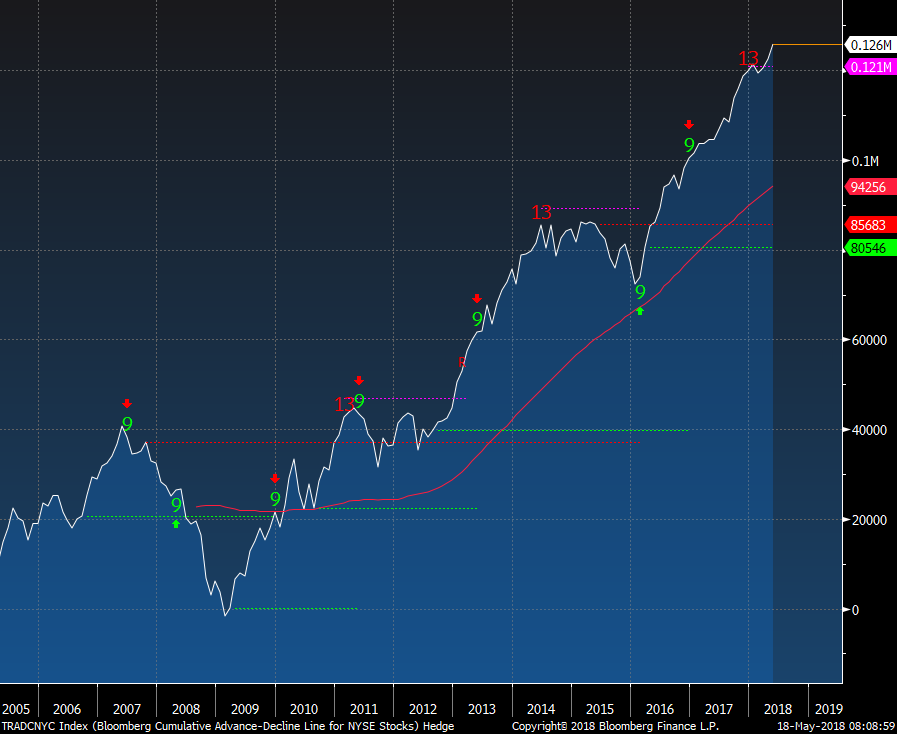
People are obsessed with showing the chart of cumulative breadth but it's a terrible timing tool. For example in January when it made a new high with the weekly 13 people were touting this as a reason to be bullish but the market dropped 10% right after and this indicator didn't give any warning. Some people are saying that there has to be a negative divergence of less stocks going up while the market indexes goes higher. That did happen in 2007 but didn't
happen in 2011 or 2014-2015. Buy the time this turns down the market has already given back way too much. We have better tools to determine timing. Cumulative breadth is not one to use.
|
|
|
|
|
|
|
|
|
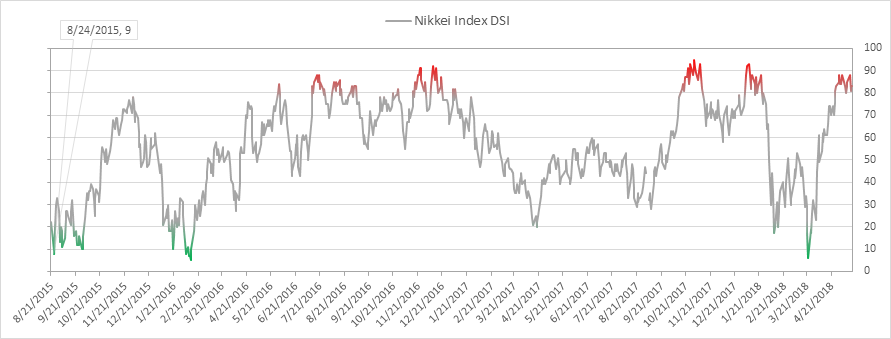
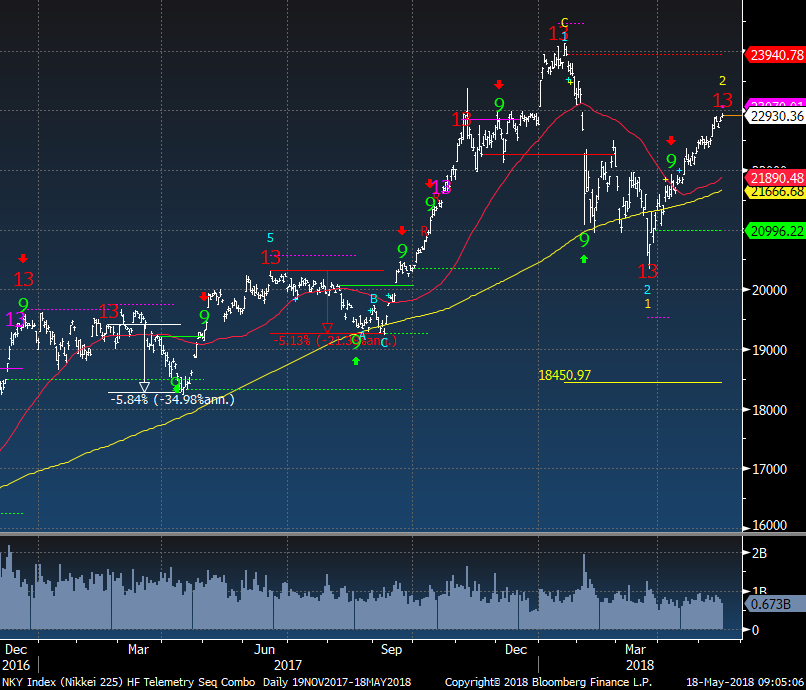
Nikkei bullish sentiment is at 83% in the extreme zone
|
|
|
|
|
Nikkei has another upside red Countdown 13 exhaustion. Expect a pullback
|
|
|
|
|
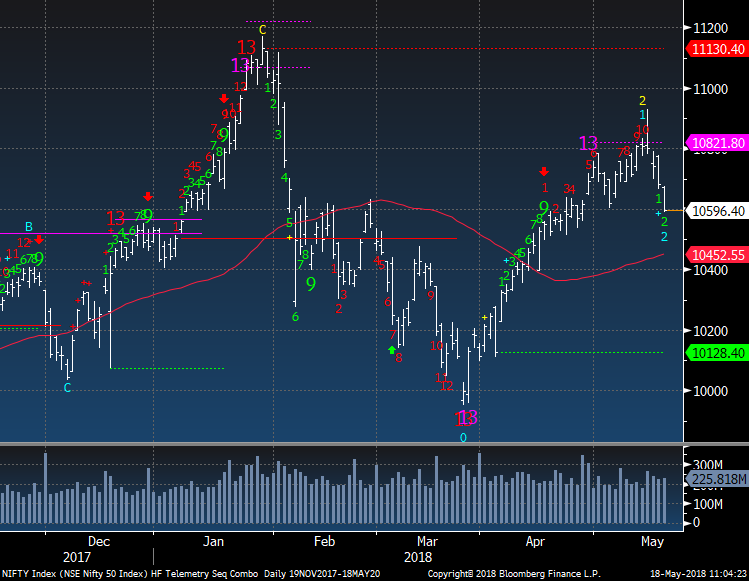
India Nifty 50 has reversed without completing the upside red Countdown.
|
|
|
|
|
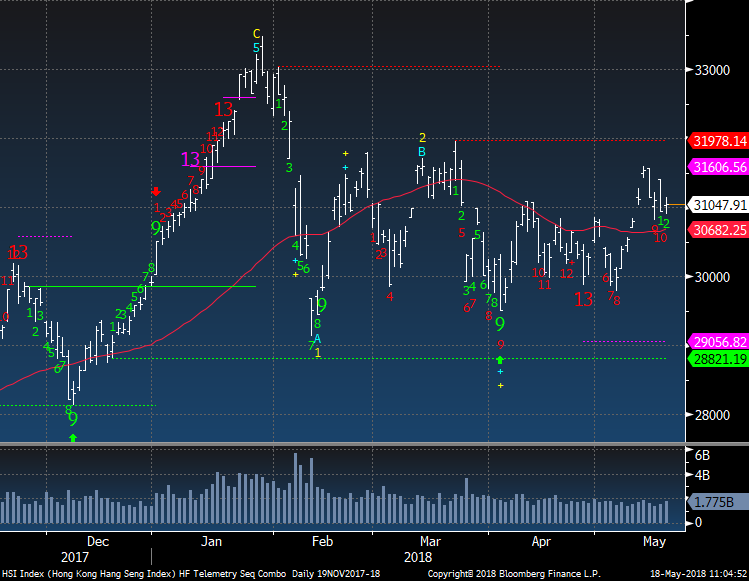
Hong Kong Hang Seng still can't get any momentum working
|
|
|
|
|
|
|
|
|
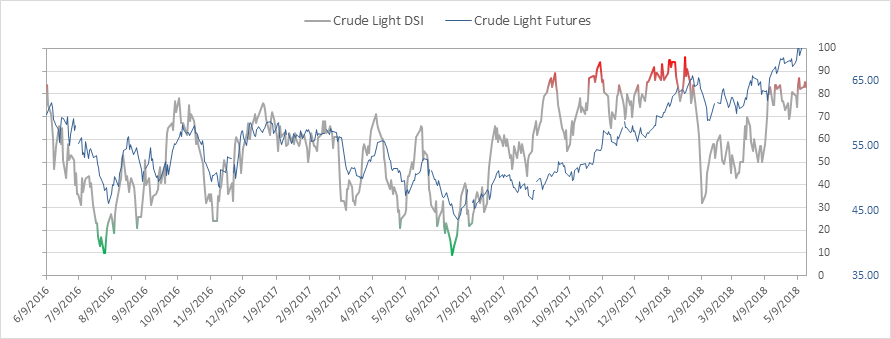
Crude bullish sentiment is at 83%, Heating Oil is at 79%, RBOB Gasoline is at 79% and Natural Gas is at 78%. Everything is very extended and overbought
|
|
|
|
|
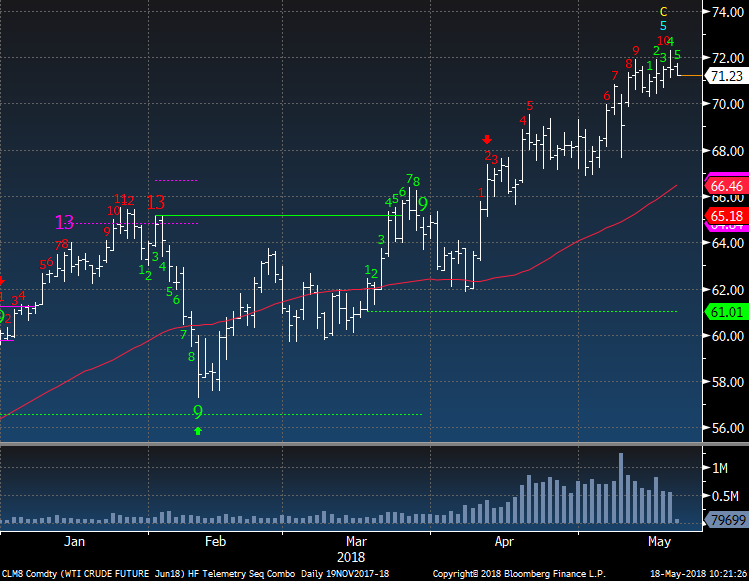
WTI Crude Futures has not completed the upside red Countdown. It's on day 10 of 13.
|
|
|
|
|
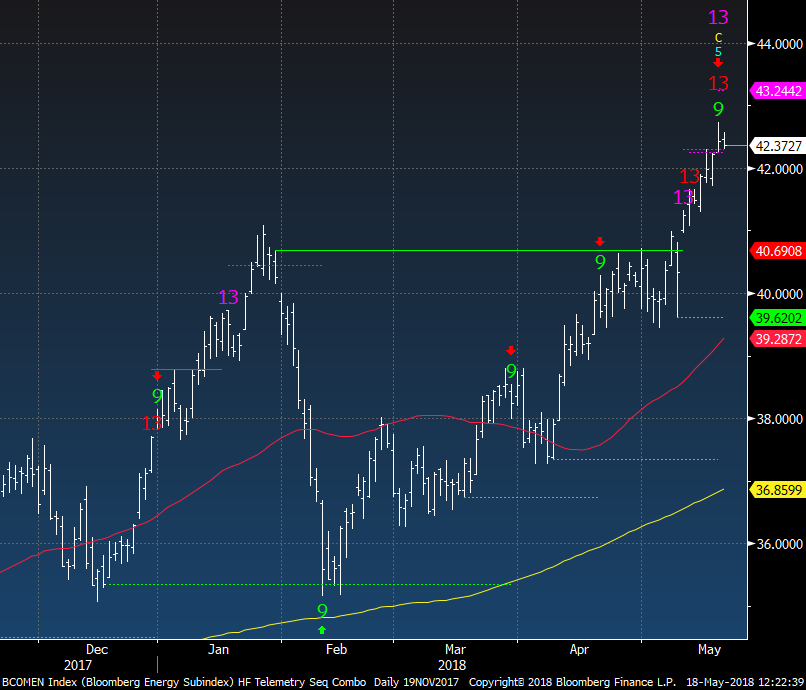
Bloomberg Energy is a mix of all the energy futures. Lot's of upside exhaustion here
|
|
|
|
|
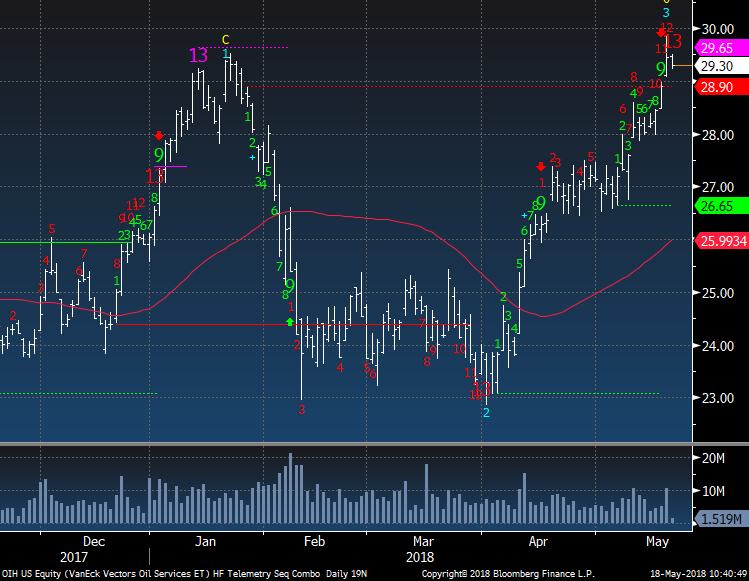
OIH Oil Service got the upside 13 today
|
|
|
|
|
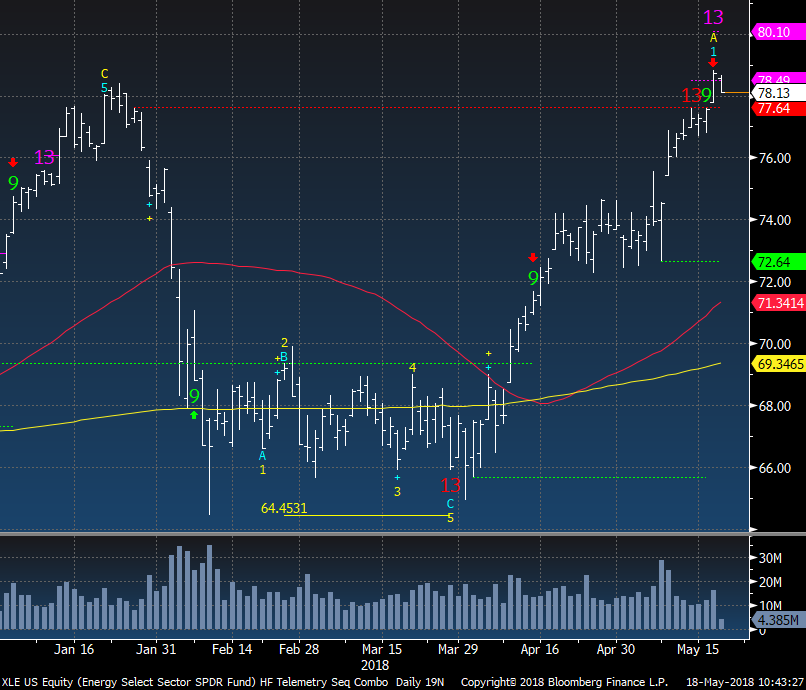
XLE had upside exhaustion in the past few days and tends to be a little early
|
|
|
|
|
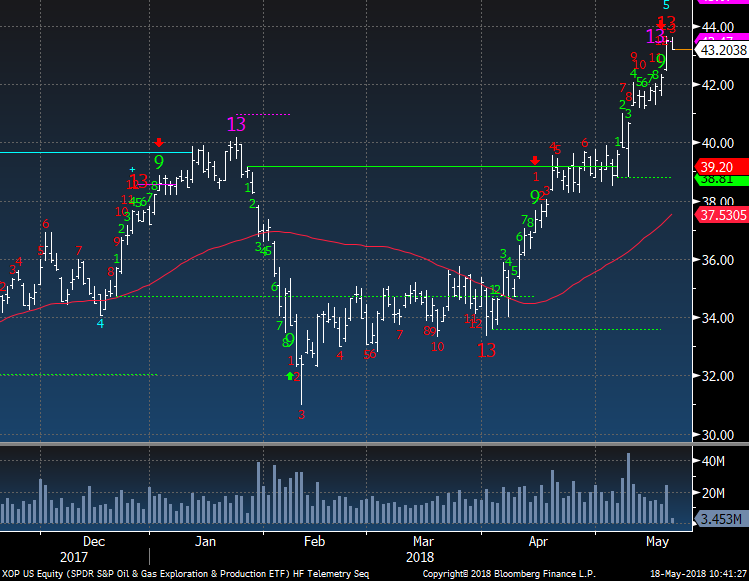
XOP upside exhaustion too in the past couple days
|
|
|
|
|
|
|
|
|
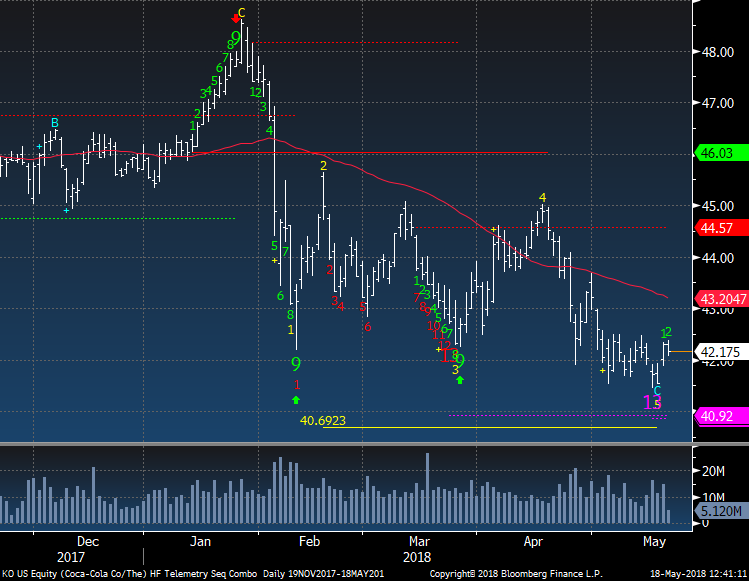
KO Coke has made 5 down waves and has downside exhaustion. I like this long
|
|
|
|
|
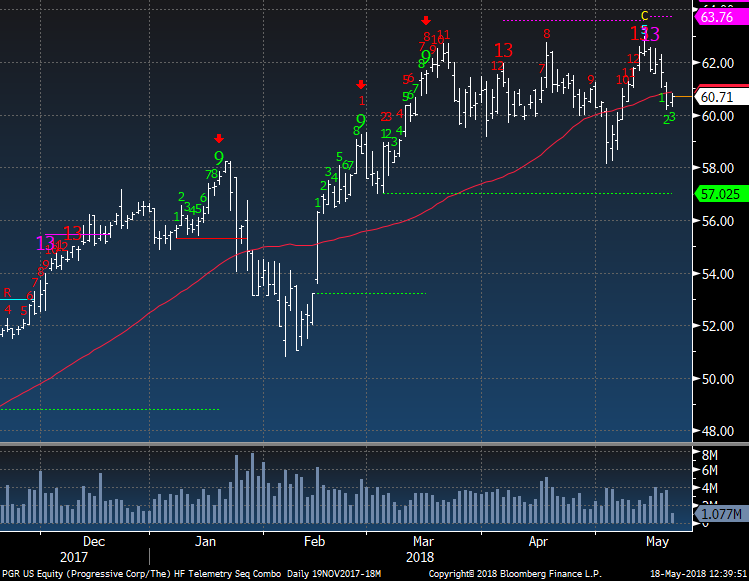
PGR Progressive has not been able to move higher with several upside exhaustion signals. It's breaking the 50 day and I like this short
|
|
|
|
|
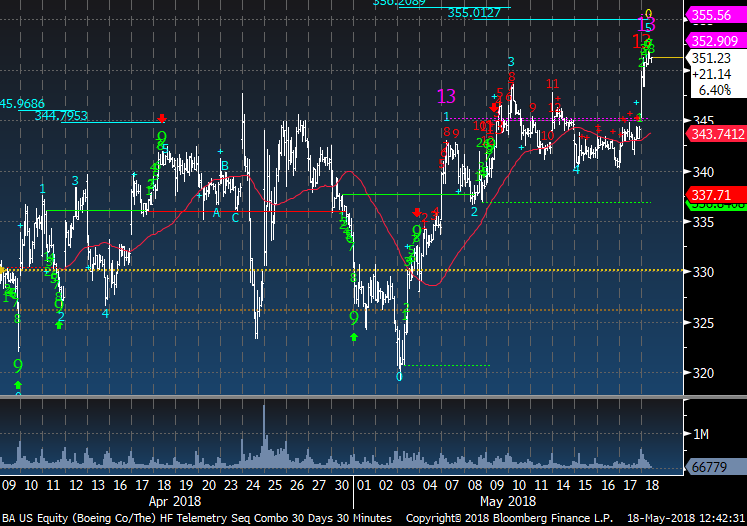
BA Boeing has an upside exhaustion signal on the 30 minute time frame. I'm doubling up my position short. Take a look at a longer term chart and you'll see this should retrace some of the spike
|
|
|
|
|
|
|
|
|
Bond bullish sentiment is at 15% and a new cycle low. This is getting oversold
|
|
|
|
|
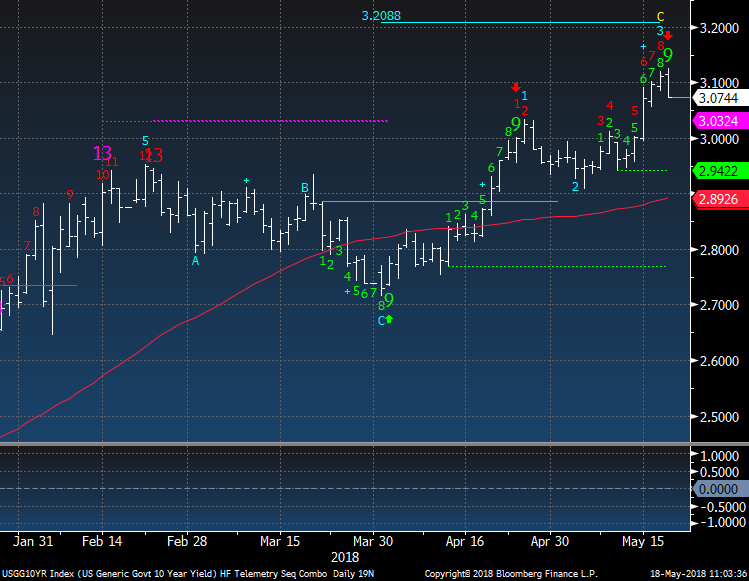
US 10 Year Yield has a green Setup 9 today and it's reversing on this signal. The red upside Countdown remains on day 8 of 13. Short term pullback then higher
|
|
|
|
|
|
|
DEMARK SCREENS - Daily, Weekly, Monthly Upside/Downside Exhaustion Signals
|
|
|
Daily/Weekly DeMark upside/downside exhaustion signals (Sequential) Weekly updated on Monday's. Price flips occur when a stock closes higher/lower than four previous closes.
The upside 13's are sell signals and downside 13's are buy signals. Price flip's are confirmation signals that increases potential for a price trend change. For example, if you are long a stock and there is an upside 13, you will want to take cautious action by selling down or out of a
position. If initiating a short sale with the upside 13's, we tend to start with a 1/2 size and add with the downside price flip. The opposite is true for when there are downside 13's. Take a 1/2 size position and add with the upside price flip. The DeMark Indicators are designed to assist the user with buying into weakness and selling into strength to anticipate trend exhaustion. Selling into a rally and buying into a decline often afford the opportunity to exit a trade without too serious a loss if wrong.
S&P 1500 Universe:
DAILY UPSIDE 13: APA, CATO, CCMP, COP, CROX, CRR, CTS, F, GGG, GNTX, IPHS, MRO, NCI, SLCA,
VRTS, CMO, ESV, M, MNRO, MTRX, MTSC, NE, OMI, PES, QEP, QSII, RRC, SM, VDSI
DAILY DOWNSIDE 13: BCO, CELG, MMM, WM, CERN, EBAY, RRTS
DAILY UPSIDE WITH PRICE FLIP REVERSAL DOWN: MRK, AES, AXP, BR, COHU, FCN, FISV, FTNT, IDXX, MCO, NJR, PGR, PSX, SJI, VDSI
DAILY DOWNSIDE WITH PRICE FLIP REVERSAL UP: EBAY, PPG, TECD, ANDE, VECO
Updated: 5/14/18
WEEKLY UPSIDE 13: ABBV, APTV, CTXS, SPGI
WEEKLY DOWNSIDE 13: NONE
Updated: 5/1/18
MONTHLY UPSIDE 13: CTXS, HSII, SYK, UFCS, WBS
MONTHLY DOWNSIDE 13: AKRX, HLX, HVT, MNK
Euro Stoxx 600 Universe:
DAILY UPSIDE 13: CAP FP, DGE LN, ICP LN, MC FP, QQ/ LN, REN NA, RMV LN, SAN FP, TEN IM, ATCOA SS, BBY LN, HO FP, LGEN LN, PSN LN, PST IM, STERV FH
DAILY DOWNSIDE 13: AF FP, HTO GA, INVP LN, SKG ID
DAILY UPSIDE WITH PRICE FLIP REVERSAL DOWN: BBY LN, BKG LN, CAP FP, GALP PL, GFS LN, HO FP, SMDS LN, AENA SM, FGR FP, LSE LN, PST IM, RMG LN
DAILY DOWNSIDE WITH PRICE FLIP REVERSAL UP: HEI GR, RYA ID, SNH GR, NRE1V FH
Updated: 5/14/18
WEEKLY UPSIDE 13: BOL SS, BPE IM, CAST SS, CHR DC, EO FP, FDR FP, IFX GR, RDSA NA, RHM GR, SHB LN, SMDS LN, TEMN SW, TOP DC, TSCO LN
WEEKLY DOWNSIDE 13: KOMB CP
Updated: 5/1/18
MONTHLY UPSIDE 13: HNR1 GR, HWDN LN, MHG NO
MONTHLY DOWNSIDE 13: AGK LN
|
|
|
Unsubscribe me from Hedge Fund Telemetry
Hedge Fund Telemetry LLC, P.O. Box 4675, Greenwich, CT 06861, United States
CONFIDENTIALITY NOTE and DISCLAIMER: This message is for the named person's use only. It may contain confidential, proprietary or legally privileged material. No confidentiality or privilege is waived by any accidental or unintentional transmission. If you receive this message in error, please immediately delete it and all copies of it from your system, destroy any hard copies and notify the sender. You must not, directly or indirectly, use, disclose,
distribute, print or copy any part of this message if you are not the intended recipient. Hedge Fund Telemetry LLC. cannot guarantee the confidentiality of the material transmitted; therefore, information of a sensitive or confidential nature should not be transmitted. There is risk in trading markets. Hedge Fund Telemetry LLC reports are based on information gathered from various sources and believed to be reliable, but are not guaranteed as to accuracy and completeness. The information is subject to change without notice and Hedge Fund Telemetry LLC has no obligation to provide any updates or changes. Hedge Fund Telemetry LLC is providing this data for informational and educational purposes and does not believe that it is sufficient to base an investment decision on. This information should not be regarded as a solicitation or recommendation of any particular security or to engage in any trading strategy. One should always check with your licensed financial
advisor to determine suitability of any investments.
|
|
|
|
|
|
|