Share

If you are having difficulty seeing this email, you can view in your browser or click here to print.

2/6/18
Thomas Thornton
info@hedgefundtelemetry.com

Now what?

Yesterday's sharp continuation lower was not unexpected as last Friday's note was bluntly titled "More downside ahead" and I've been overly cautious for months with the backdrop of a plethora of upside DeMark exhaustion signals on daily, weekly, and monthly time frames lining up combined with extreme bullish sentiment.   Up until today there were no indicators showing oversold conditions and volatility hadn't really become a 'thing' as it is now.  Sentiment and "good news" peaked a couple weeks ago at record levels with the backdrop of one of the best earnings seasons as measured by earnings/revenue percentage beats and good economic data.  Markets top in this type of environment and bottom in the exact opposite!

Tops are a process but when indicators are skewed so far on the liability side of the technical ledger, one can prepare.  My call was to raise cash ~25% but wasn't an all in push in chips short call. In mid January, I said to raise more cash.  I did get some downside alpha as I put on some SPY, QQQ, IWM April puts on 1/24 and took off half yesterday and will evaluate today what to do with the remainder.   I'm far from victory lapping as the hard work is just beginning.   So now what?  Can a bounce happen?  Yes.

S&P bullish sentiment is now 18% bulls down from a record high two weeks ago at 96%. This is one of the sharpest moves I've ever seen so a snap back to 50% is possible.  When it broke the 10 day moving average at 90% for two days straight it was a first sign of a turn.  A week ago I highlighted the massive January fund/ETF inflows of $78 billion (a record) and ran VWAP levels on the major ETF's.  It was important as it showed people generally got in late and it served a good level of where people would start to get underwater.  The levels broke and now people who bought in January are hoping to get even.  These levels now serve as resistance.  Several technicians are highlighting the severe oversold levels (% of stocks above the 10 day moving average at 1% and S&P 500 % of stocks above the 50 day is at 20% - a level I mentioned yesterday I wanted to see)

There are two parts to Elliott Wave analysis, the math/Fibonacci stuff and the psychology of what is happening during each wave.  Let's examine what I see in the psychology in the recent past and the future. In the last quarter we completed  the fifth wave where Wave five is the final leg in the direction of the dominant trend. The news is almost universally positive CHECK and everyone is bullish CHECK. Unfortunately, this is when many average investors finally buy in, right before the top CHECK. Volume is often lower in wave five than in wave three, and many momentum indicators start to show divergences (prices reach a new high but the indicators do not reach a new peak) MOSTLY RIGHT At the end of a major bull market, bears may very well be ridiculed CHECK.   Sounds about right.   The sharp down move has been a wave A corrective pattern or the first down wave.   Wave A: Corrections are typically harder to identify than impulse moves CHECK. In wave A of a bear market, the fundamental news is usually still positive CHECK. Most analysts see the drop as a correction in a still-active bull market CHECK. Some technical indicators that accompany wave A include increased volume CHECK, rising inmplied volatility CHECK.  Since many markets have now seen the the first down wave, a lower high bounce is ahead. Wave B: Prices reverse higher, which many see as a resumption of the now long-gone bull market. Those familiar with classical technical analysis may see the peak as the right shoulder of a head and shoulders reversal pattern. The volume during wave B should be lower than in wave A. By this point, fundamentals are probably no longer improving, but they most likely have not yet turned negative.  Shorting into the Wave B or second wave down is my secret sauce as I can measure a buy stop at old highs.   We have not seen the lows in 2018 as the wave pattern is just starting.  I posted a some charts that clearly shows the first wave down. This is not an "all clear" signal  - stay nimble and tight with stops.    

I'm off the desk headed to a lunch in NYC so I'll get back with emails later.   


Thank you for your patience with the new formatting.  A work in progress. 

 
US Market Index Overview


The SPX and other indexes have fallen after some clusters of DeMark upside exhaustion signals.  One of the attributes of the past year has been very few pullbacks which the DeMark signals has triggered on the daily time frame ahead of short and shallow stalling out periods.  This last move I felt was the blow off top extending wave 5 but would be more relevant with the recent monthly upside exhaustion signals - which are rare but effective. The downside wave pattern I discussed above is evident with a downside wave 1/A.  


Just a couple weeks ago I showed this chart of the SPX bullish sentiment vs the VIX bullish sentiment ratio at a record high.  It's now turned negative and the last time it did this was the day after the US election.  This could be the start of a choppy but lower period for this ratio. 


The SPX monthly chart has been my main chart that is my basis for expecting a pullback.  It's rare to see upside exhaustion signals on the monthly time frame and they have worked every time in the past 15 years for at least a 5% pullback.  Add this recent signal to the winning record. 


The Nasdaq bullish sentiment is now at 20%.  This sharp drop from all time highs two weeks ago is amazing.  Just note this can and likely will go lower over the coming months as the wave pattern develops. 


Nasdaq 100 daily had a blow off top move from December through January and the recent upside exhaustion signals worked well.  Keep in mind when they trigger they have 10-15 days to work.  The green dotted TDST support line worked well as support.  This line is automatically drawn when there is a price flip up (a close higher than 4 previous bars).  The wave pattern is evident here too


NDX monthly also had some monthly upside exhaustion signals which have worked well in the past but there isn't a perfect record like the SPX monthly. 


The Dow Jones daily had a few clusters of upside exhaustion signals too.  The down wave pattern is evident here too

 
European Indexes  - Potential for a reversal up after some downside exhaustion signals


European indexes have looked MUCH different than US indexes and Asian indexes.  Considering the positioning with the Euro is so skewed bullish and a dollar bounce is my call perhaps Europe will react positively soon.  DAX had a recent downside red Countdown 13 exhaustion and a green Setup 9 today.  


Euro Stoxx 600 has broken down and now has a downside green Setup 9 which might see a bounce develop within days


Euro Stoxx 50 had like the DAX a downside red Countdown 13 and has a green Setup 9 today.  This could be a nice time to start buying some European leaders. 


Asian Indexes


Hong Kong Hang Seng also had some upside exhaustion signals that took a little longer to work but now has rolled over and also have the first down wave after wave 5.  Bouncing off the 50 day is pretty textbook. 


Nikkei had a perfect upside red Countdown 13 exhaustion signal and is down 10% since.  There is a green Setup 9 today and the wave count is a little different due to some choppy action from Summer but the yellow 1 signifies the first wave down.  Expect a bounce

 
End of the world?  The Bloomberg World Index


The Bloomberg World index had a couple recent upside exhaustion signals that were a tad early but now has rolled over and also has the wave set up


The weekly upside exhaustion on the Bloomberg World index a couple weeks ago did more than a few sideways weeks. 


The monthly on the Bloomberg World index had a few upside exhaustion signals last quarter and one in January.  In the past it took a little time to fully turn over.  The upside wave 5 calculated target was nearly achieved.  These are just mechanical guides and do not have a perfect record

 
Advance Decline Data


Some people have cited the Advance Decline data to stay bullish.  This is the daily and it's broken down under the 50 day moving average vs when it backed off and held the 50 day in November. 


I ran the monthly of the AD and found it tagging the upside wave 5 target combined with an upside red Countdown.  The last couple signals topped ahead of some challenging times. 

 
US Dollar Thoughts
US Dollar Bullish sentiment is now 26% and up from recent low of 8%


DXY US Dollar Index had a recent downside exhaustion and has reversed up.  I like the Dollar long.  The weekly however remains on week 12/13 so it's possible some chop could be ahead

 
Credit Spreads
Credit spreads as measured by US High Yield Corporates vs the US 10 year actually have been widening.  We see the breakout levels.  Sure it's early but we have to watch this close. 
 
Risk Appetite

This is the Morgan Stanley Risk Appetite Index and it's clear people have lost their appetite. 

 
Bitcoin Update
Bitcoin is now on day 8 of 13 with it's downside Countdown.  Today is important since a downside 13 Sequential Countdown has as rule that the 13th downside bar must occur below the 8th red bar.  
 
The "Short Vol" trade is over
XIV short volatility index monthly chart had a nice upside exhaustion Countdown in January and now is halted likely forever.  Thanks for playing Volatility sellers!  It's been fun.  
 
DEMARK SCREENS
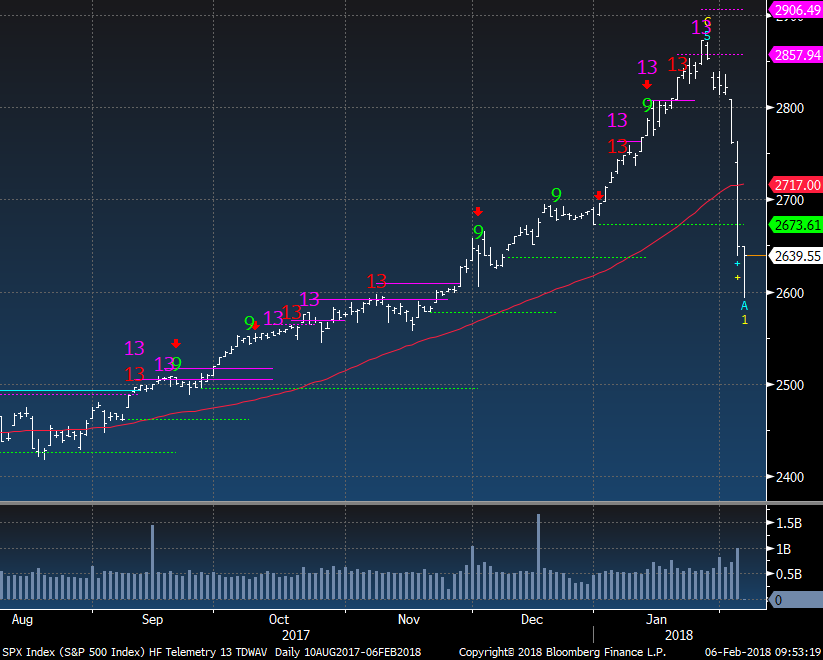
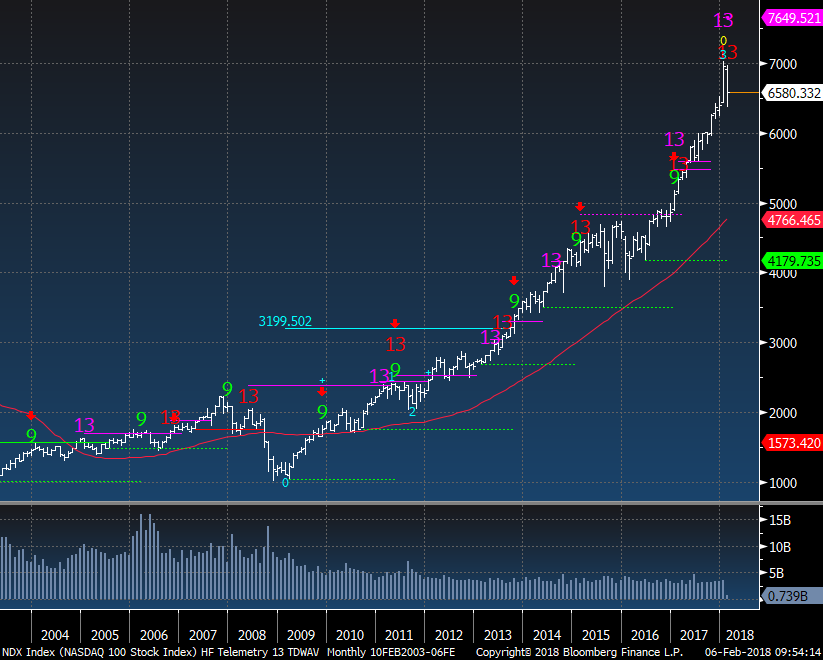
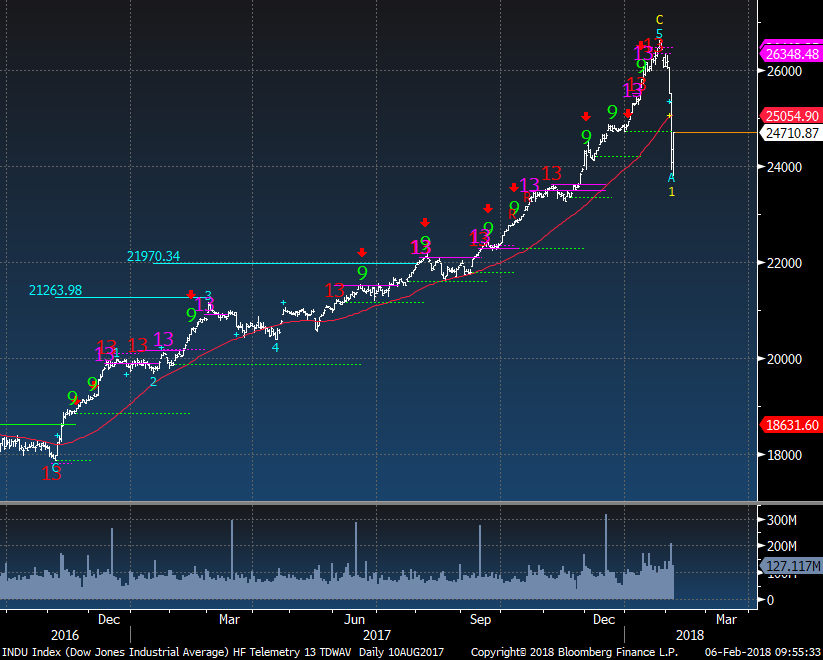
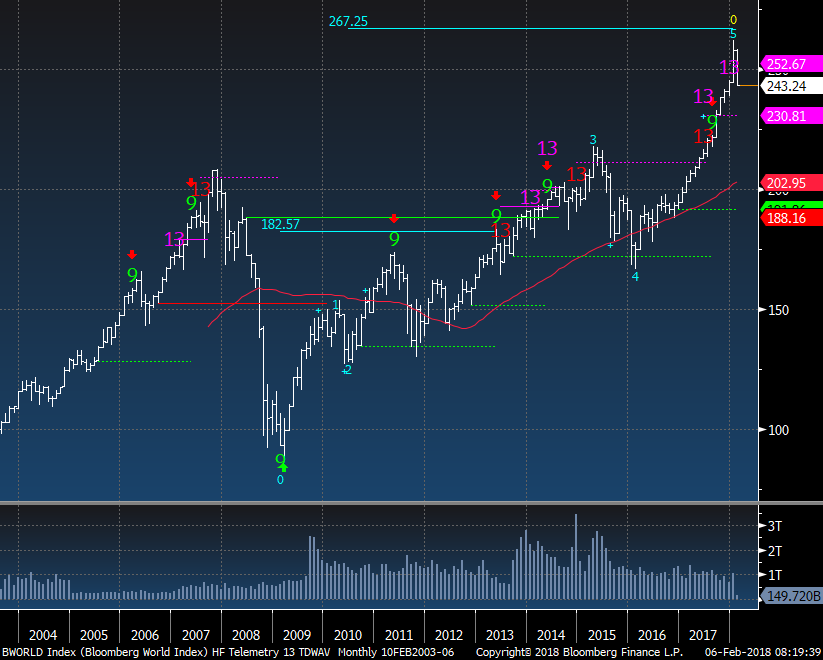
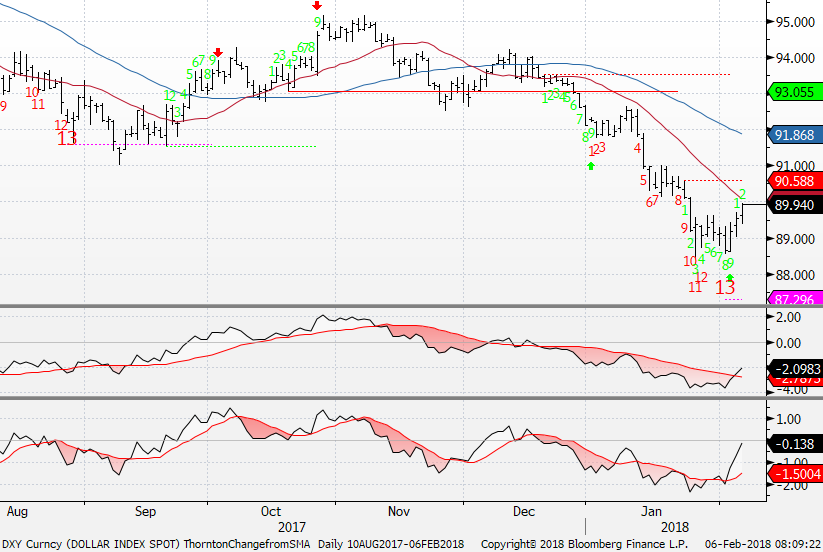
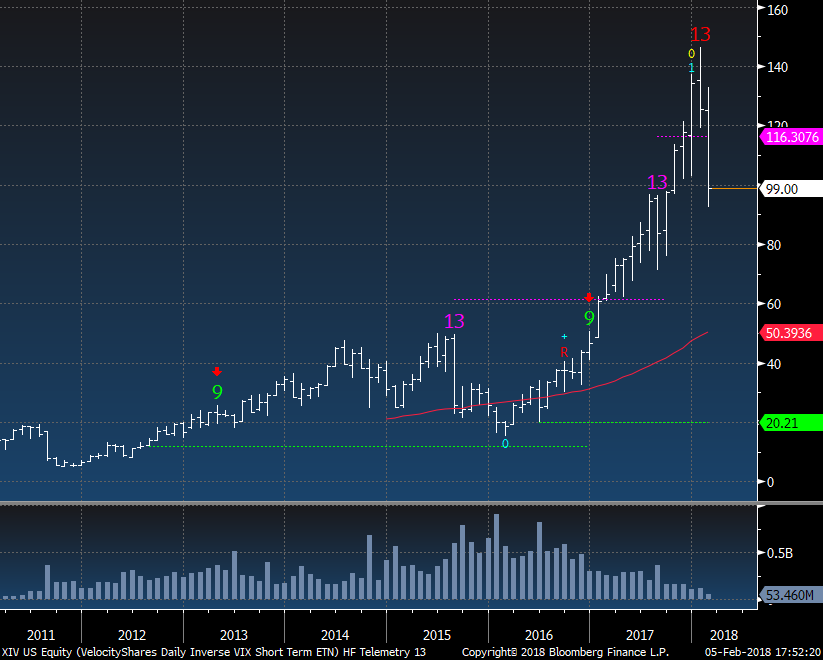
By the way notice there are more downside exhaustion 13's.  Look at them for potential long ideas.


Daily/Weekly DeMark upside/downside exhaustion signals (Sequential) Weekly updated on Monday.  Price flips are more actionable.  I would use a stop at slightly above peak/slightly below trough.  

S&P 1500 Universe:

DAILY UPSIDE 13:   DECK

DAILY DOWNSIDE 13: AEE, AEIS, AFAM, AINV, ALE, CELG, CMS, ECPG, FORR, GDOT, GEO, HAIN, HOS, IDA, KIM, LHCG, MTSC, NWN, PCG, PM, PPL, SO, SWKS, WEC, WR

DAILY UPSIDE WITH PRICE FLIP REVERSAL DOWN:    FBP, FCFS, HRS, IEX, LMT, SMP, SRCL

DAILY DOWNSIDE WITH PRICE FLIP REVERSAL UP:   NONE
Updated: 2/5/18

WEEKLY UPSIDE 13:   ABMD, AON, AXE, BF/B, BIIB, BOFI, BR, CSCO, DGX, GD, LMT, MAR, RL, ROST, SGY, SPPI, STT, SYY, UFS, WAT, WSO

WEEKLY DOWNSIDE 13:   BELFB, EGOV, FSP, INT, RRC

Updated: 2/1/18

MONTHLY UPSIDE 13:     CHD, CLGX, CLX, CNMD, DVA, FICO, IDCC, MSCI, ORLY, PAYX, TFX, VMC, XYL

MONTHLY DOWNSIDE 13:    GPOR

Euro Stoxx 600 Universe: 

DAILY UPSIDE 13:   NONE

DAILY DOWNSIDE 13: FPE3 GR, INVEB SS, ITRK LN, ITX SM, KPN NA, REL LN, SAN FP, SEBA SS, SWEDA SS, TRN IM

DAILY UPSIDE WITH PRICE FLIP REVERSAL DOWN:    NONE

DAILY DOWNSIDE WITH PRICE FLIP REVERSAL UP:   ADP FP, HEIA NA, HEIO NA, PSM GR

Updated: 2/5/18

WEEKLY UPSIDE 13:    ELM LN, JE/ LN, MC FP, TDC DC

WEEKLY DOWNSIDE 13:   AA/ LN, NG/ LN, SGC LN

Updated: 2/1/18

MONTHLY UPSIDE 13:    COFB BB, GAS SM, GKN LN, ING FP, KINVB SS, OML LN, VIS SM

MONTHLY DOWNSIDE 13:   NONE


Unsubscribe me from Hedge Fund Telemetry

Hedge Fund Telemetry LLC, P.O. Box 4675, Greenwich, CT 06861, United States

CONFIDENTIALITY NOTE and DISCLAIMER: This message is for the named person's use only. It may contain confidential, proprietary or legally privileged material. No confidentiality or privilege is waived by any accidental or unintentional transmission. If you receive this message in error, please immediately delete it and all copies of it from your system, destroy any hard copies and notify the sender. You must not, directly or indirectly, use, disclose, distribute, print or copy any part of this message if you are not the intended recipient. Hedge Fund Telemetry LLC. cannot guarantee the confidentiality of the material transmitted; therefore, information of a sensitive or confidential nature should not be transmitted. There is risk in trading markets.  Hedge Fund Telemetry LLC reports are based on information gathered from various sources and believed to be reliable, but are not guaranteed as to accuracy and completeness.  The information is subject to change without notice and Hedge Fund Telemetry LLC has no obligation to provide any updates or changes. Hedge Fund Telemetry LLC is providing this data for informational and educational purposes and does not believe that it is sufficient to base an investment decision on. This information should not be regarded as a solicitation or recommendation of any particular security or to engage in any trading strategy. One should always check with your licensed financial advisor to determine suitability of any investments.


Email Marketing by ActiveCampaign