If you are having difficulty seeing this email, you can view in your browser or click here to
print.
|
|
|
|
|
04/23/2018
Thomas Thornton
|
|
|
|
|
This week 42% of the S&P 500 market cap reports including heavy weights GOOGL, BA, FB, AMZN, MSFT, INTC, and XOM. Back when I was working at my hedge fund, I hated earnings season. Besides it being a ton of work, incredibly tense and stressful, it wasn't that profitable. Our analysts did tons of work from modeling to channel checks and our trading desk would poll sell side traders who specifically traded those names to determine the best we could how people were
set up going into the numbers. My experience taught me it was a guessing game. Sure there were many times when the probabilities gave us an edge on both the long and short side but often many times we would have analyzed the company and had a great idea on the expected numbers and it didn't matter as the stock traded the opposite of the earnings report and what we expected. Last week's earnings were a good example as there has now been 87 of 500 names from the S&P to report with 67% better (this is a little less than last quarter) on revenues and 80% better on EPS. More stocks have reacted to these numbers by selling off and the indexes have made no ground since the start of earnings. Expectations, as discussed many times in the past few months, have been exceptionally high heading into earnings and despite the indexes being well off highs from January, the bar still seems too high.
Bonds continue to sell off. Everyone in the press is acutely
focused on the US 10 year nearing 3%. Is this a relevant level as the TLT ETF is not too far from finally getting the downside exhaustion signal that has been pending for several months? I'm more concerned about the investment grade bond ETF LQD making 2 year lows and only about 2% from the February 2016 major equity market low. The S&P is 48% higher than the February 2016 low. I remain cautious and recommend to continue to hold a high level of cash.
Notable:
- US Markets - Sentiment dripping lower again. Downside Countdowns again on the major indexes
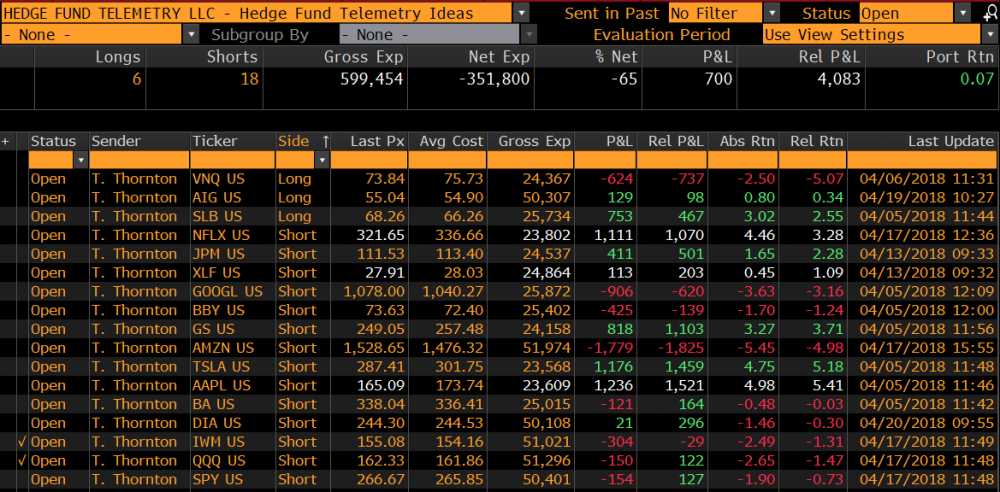
- Hedge Fund Telemetry Trade Ideas - PG sold at a loss
- European Market - Still neutral
- Currencies - USD moving but could be too late, GBP looks lower
- Asian Markets - More downside ahead in China/Hong Kong
- Crude Update - Remain
Neutral
- Big Weights Reporting This Week
- A Couple More Big Weights
- Bond Update - Detailed look at the daily, weekly, and monthly 10 year yield
- DeMark Screens - Daily, Weekly, Monthly upside/downside exhaustion signals within the S&P 1500 and Euro Stoxx 600
|
|
|
|
|
Here's a link to the Hedge Fund Telemetry market sentiment page with 40 charts of sentiment including equities, bonds, currencies, and commodities updated each day.
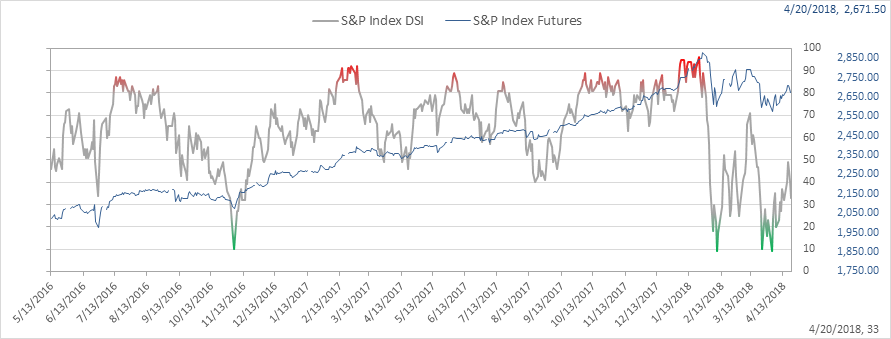
SPX bullish sentiment is at 33% and couldn't get above 50%
|
|
|
|
|
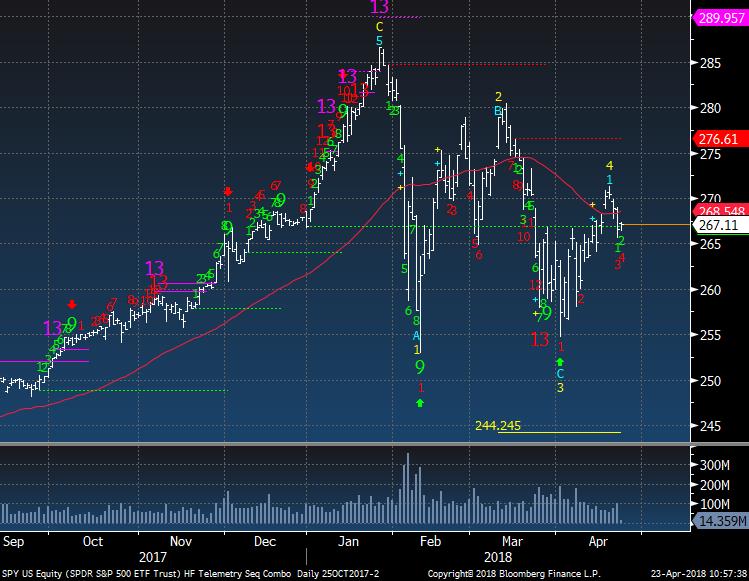
SPY is on day 4 of 13 with a downside red Countdown. There is a Wave 5 downside price objective of 244.24.
|
|
|
|
|
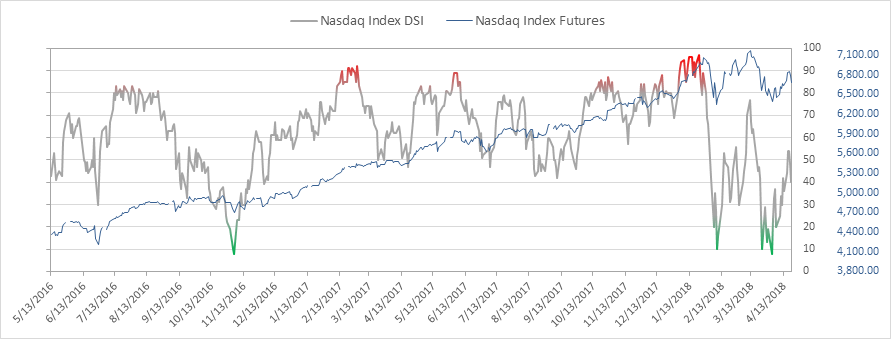
Nasdaq bullish sentiment is at 40% and also faded from last week's high of 54%
|
|
|
|
|
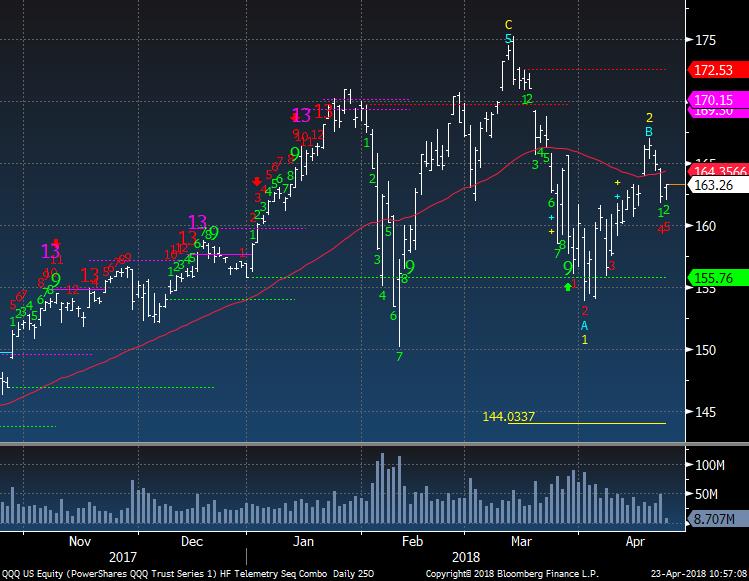
QQQ is on day 4 of 13 with a downside red Countdown. There is a Wave 3 downside price objective of 144.03. 155.76 is important support
|
|
|
|
|
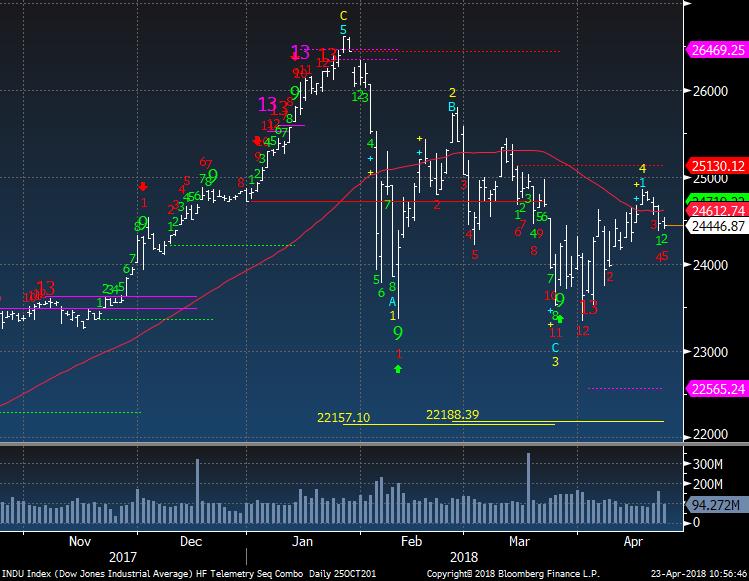
Dow Jones Industrial Average is on day 5 of 13 with a downside Countdown. There is a downside Wave 5 price objective of 22,188
|
|
|
|
|
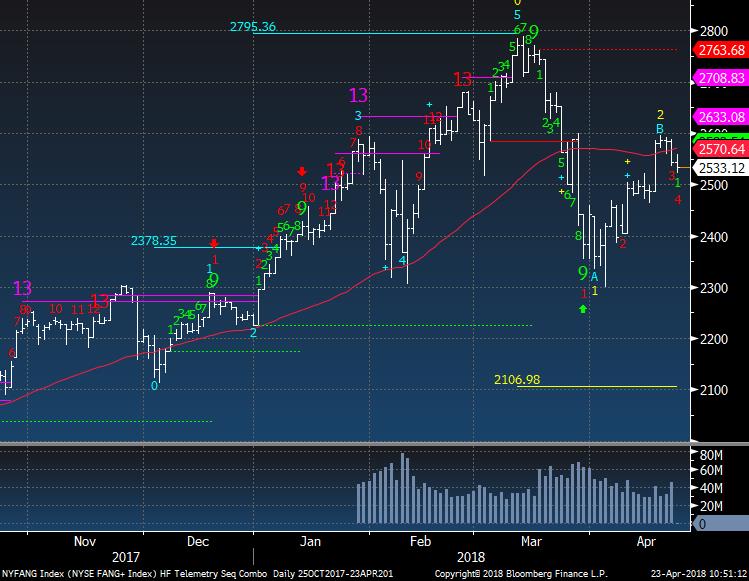
FANG + Index failed at the 50 day moving average. There is a downside red Countdown on day 4 of 13 and a downside Wave 3 price objective of 2106
|
|
|
|
|
|
|
Hedge Fund Telemetry Trade Ideas
|
|
|
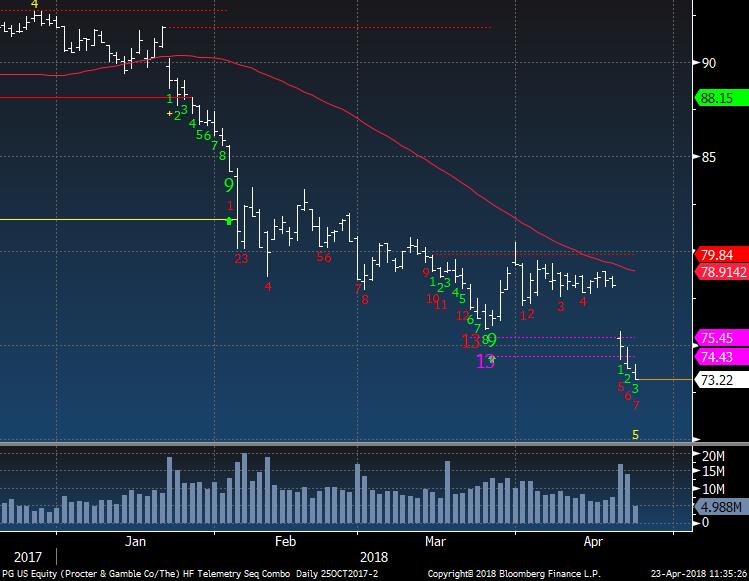
Trade Ideas. PG was voted off Alpha Island with a 6% loss. I wanted some defensive positioning in staples yet the group has very little support. I would have sold it earlier on the day of earnings but it held the intraday VWAP that gave me a little pause thinking it could bounce. It didn't so it's gone. When it's a 2.5% sized position, it's manageable. Current performance since 4/5 +7bps.
|
|
|
|
|
PG - Downside exhaustion did not do much other than work sideways. Never like taking losses but always like taking smaller losses than taking larger losses. CLX was one I sold right on the PG earnings (5% loss then vs if I held it 10%)
|
|
|
|
|
|
|
|
|
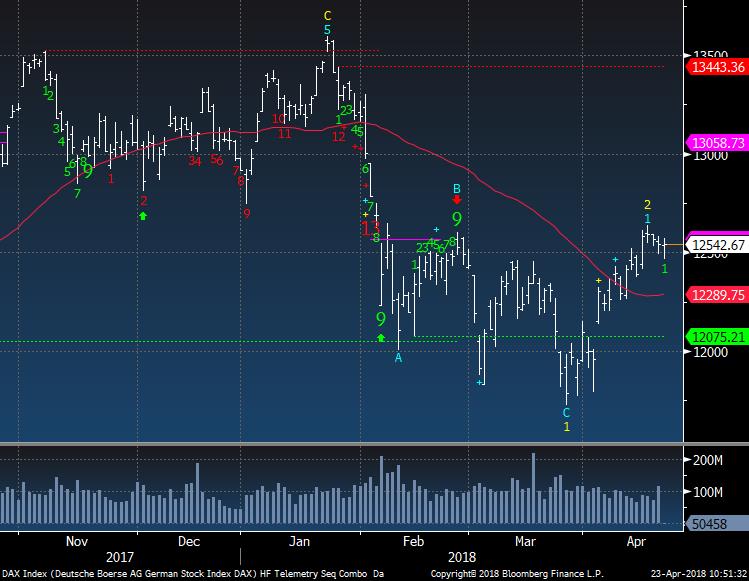
DAX pausing. Neutral here
|
|
|
|
|
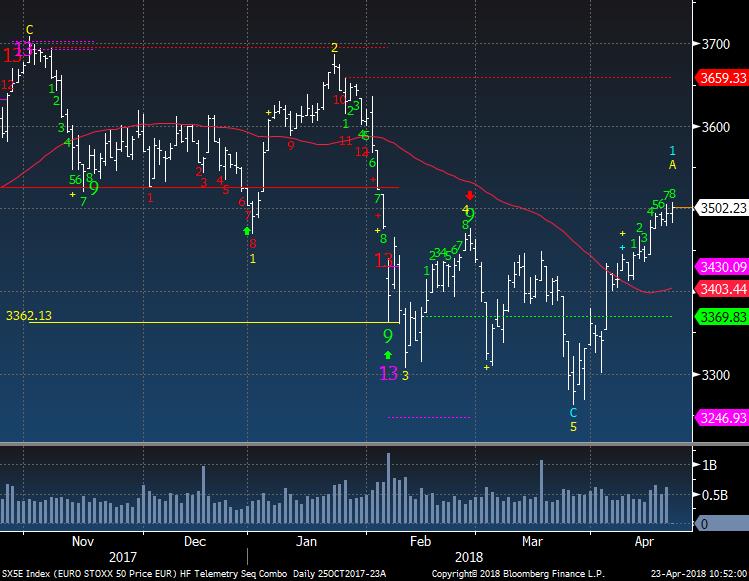
Euro Stoxx 50 has had a nice bounce off the lows and should have an upside green Setup 9 tomorrow. That should see some pullback and consolidation
|
|
|
|
|
|
|
|
|
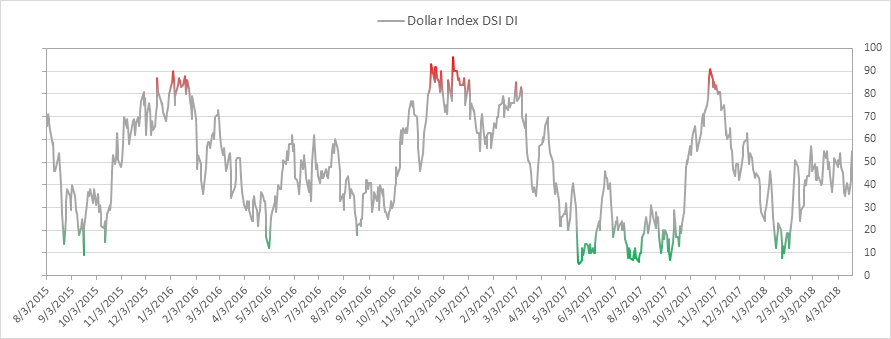
US Dollar bullish sentiment is at 55% and finally over 50%. Should be up more later today
|
|
|
|
|
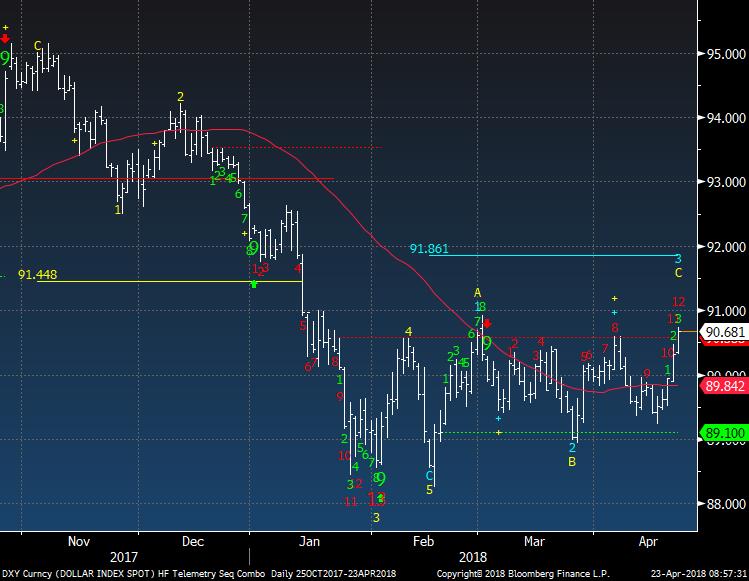
The DXY US Dollar Index is on day 12 of 13 and I fade "breakouts" when there is exhaustion signals lurking. I remain neutral
|
|
|
|
|
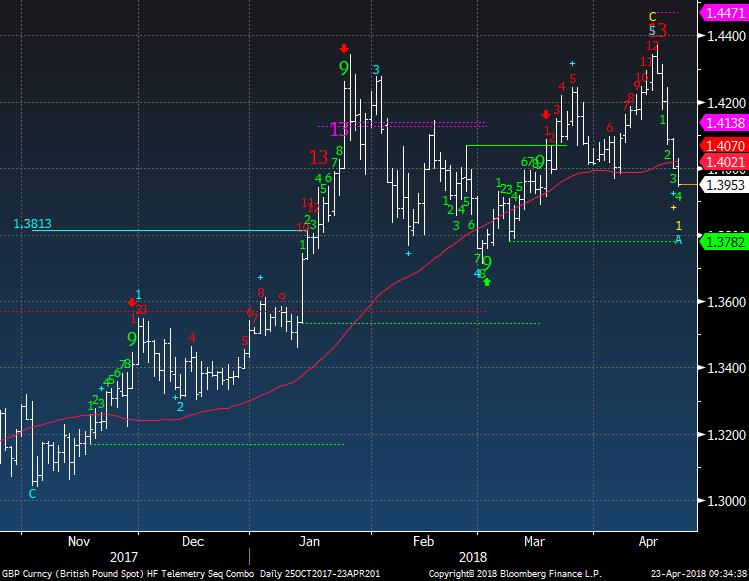
British Pound Sterling had a nice upside exhaustion signal last week and its now broken the 50 day. 1.3782 is next support
|
|
|
|
|
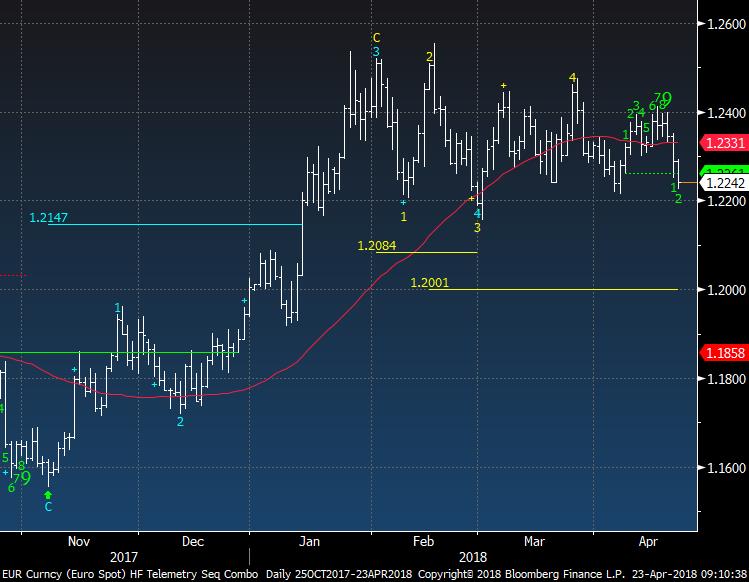
Euro has support at 1.22 then 1.20.
|
|
|
|
|
|
|
|
|
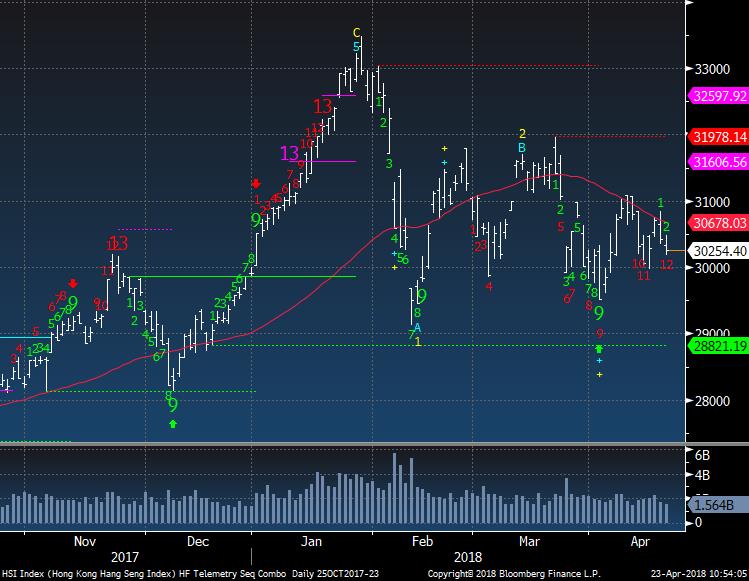
Hong Kong Hang Seng is on day 12 of 13 with a downside red Countdown.
|
|
|
|
|
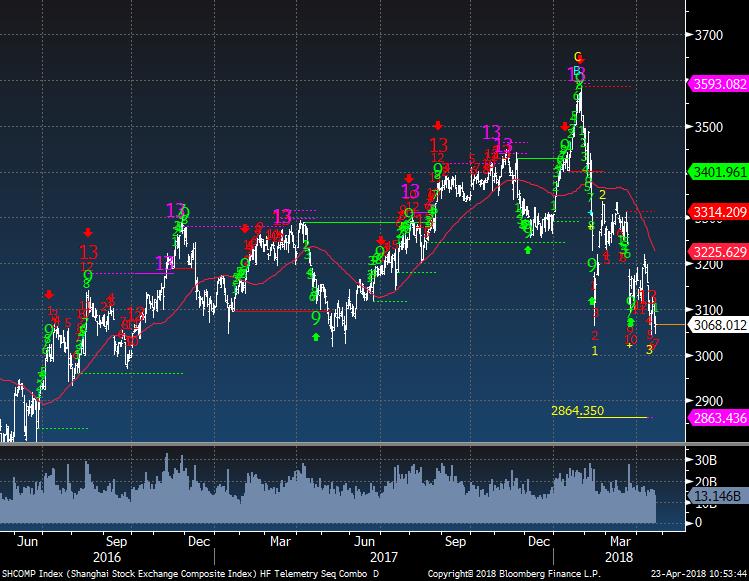
Shanghai over the past 3 year has seen good reactions after exhaustion signals. It's now on day 7 of 13 with a secondary downside Countdown and has a 2864 downside Wave 3 price objective
|
|
|
|
|
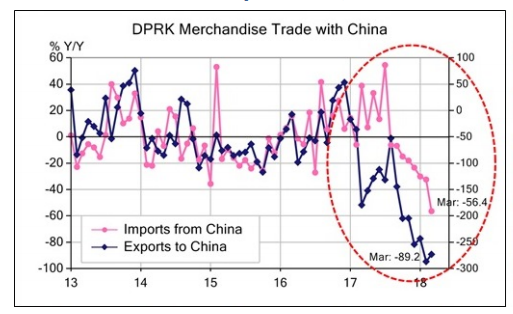
This is North Korea's trade with China since the sanctions were placed on them. The sanctions worked as the country is in very bad shape economically.
|
|
|
|
|
|
|
|
|
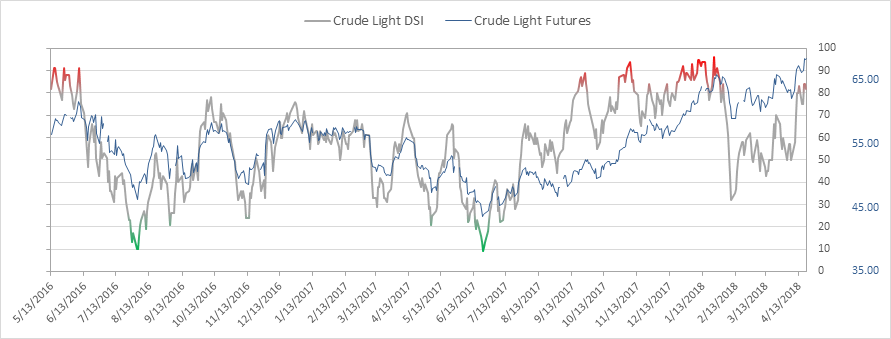
Crude bullish sentiment is at 82% down slightly from 84%. It's in the extreme zone
|
|
|
|
|
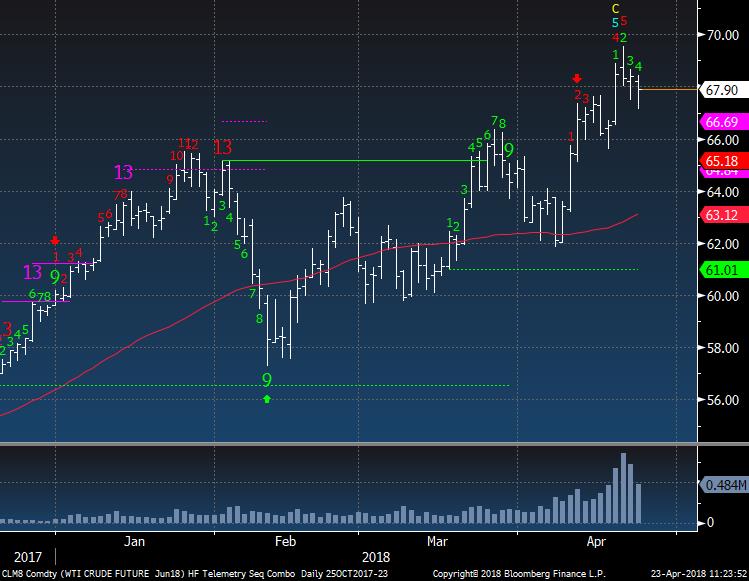
WTI Crude still has an upside red Countdown on day 5 of 13. Brent did have an exhaustion and has been a little better with the DeMark indicators. I'm neutral on Crude
|
|
|
|
|
|
|
Big Weights Reporting This Week
|
|
|
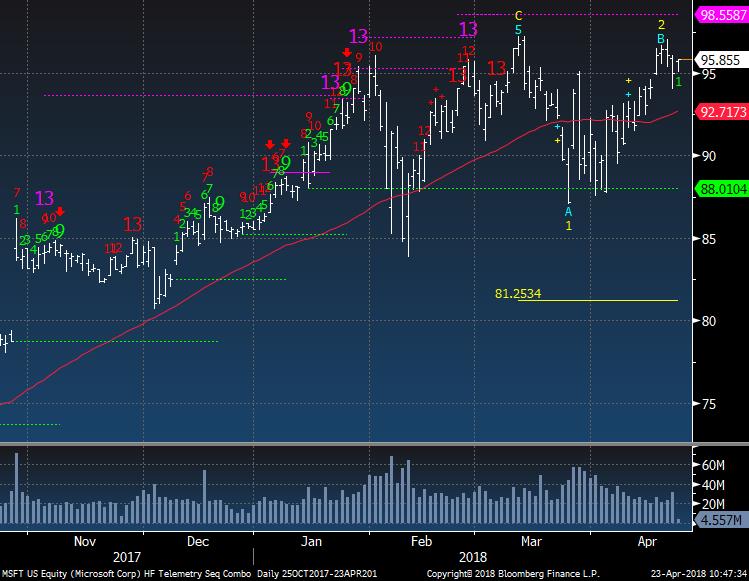
MSFT is close to making a new high and probably looks best of the best in tech. If a new closing high is made then the wave count will revert back to the upside Wave 5 (blue 5). If this falls after earnings I will evaluate as a new short.
|
|
|
|
|
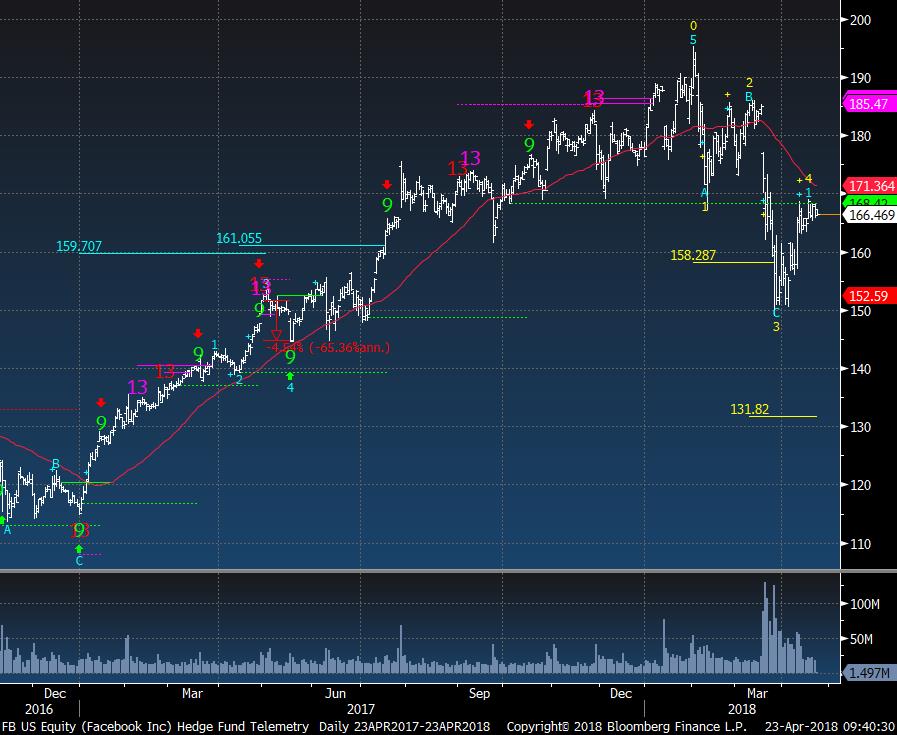
FB looks to have made a big top and is now under resistance. There is a Wave 5 downside price objective of 131.82. Most people expect the recent Cambridge news to hit this quarter's performance. The stock could trade up right after earnings and then down on guidance on the conference call.
|
|
|
|
|
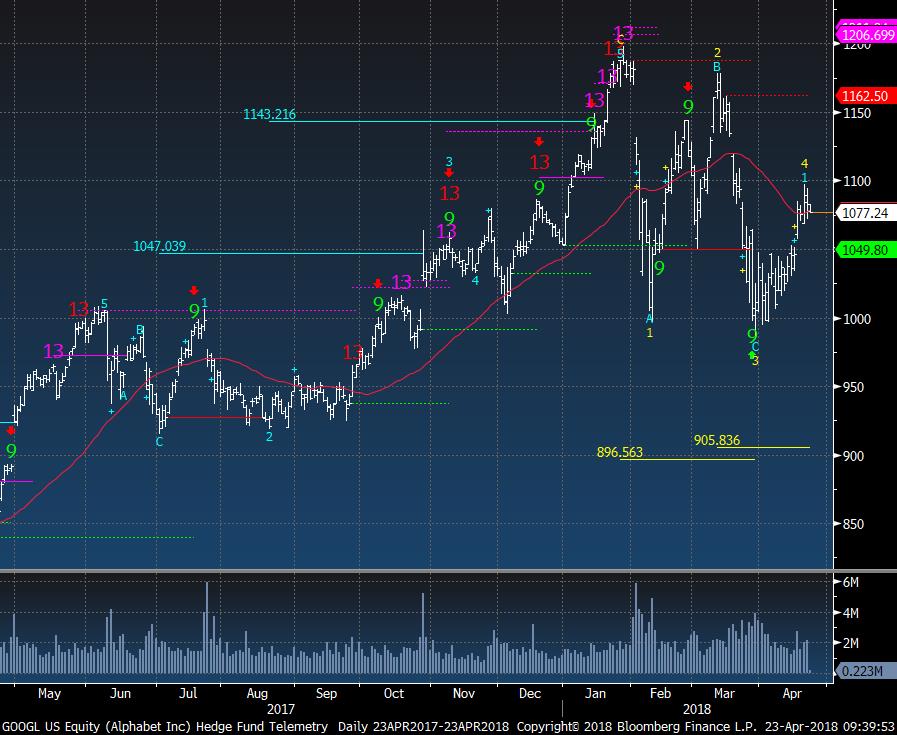
GOOGL has made several lower high and lower lows. There is a downside Wave 5 price objective of 905.83.
|
|
|
|
|
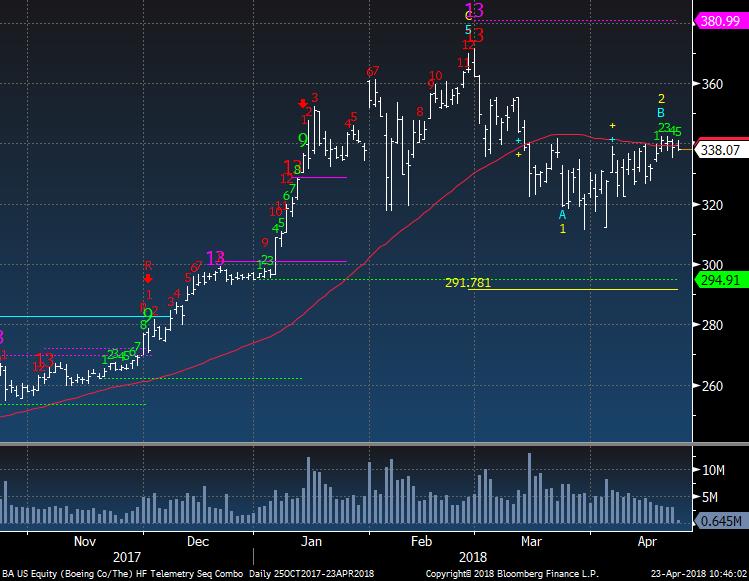
BA the largest weight in the Dow has been going sideways and has a downside Wave 3 price objective of 291.78
|
|
|
|
|
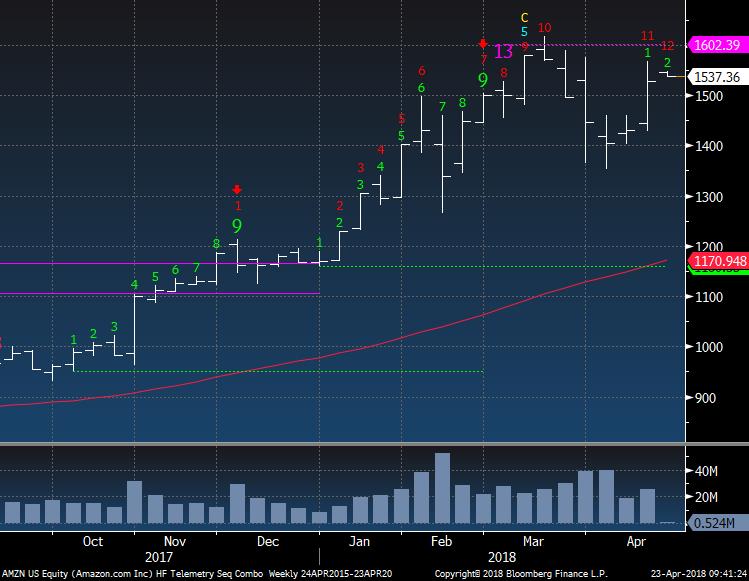
AMZN weekly is on week 12 of 13. This could see an up week next week to trigger the upside exhaustion.
|
|
|
|
|
|
|
A Couple More Big Weights To Watch
|
|
|
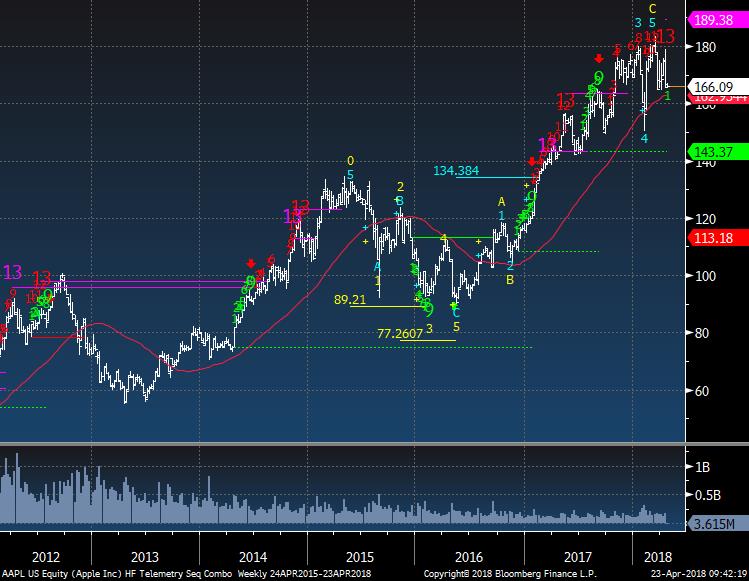
AAPL weekly has an upside red 13 from last week. Previous weekly exhaustion signals happened a little ahead of some large pullbacks. But this one happened with a long sideways period as now it's right at the 50 week moving average. Apple reports next week and I remains short.
|
|
|
|
|
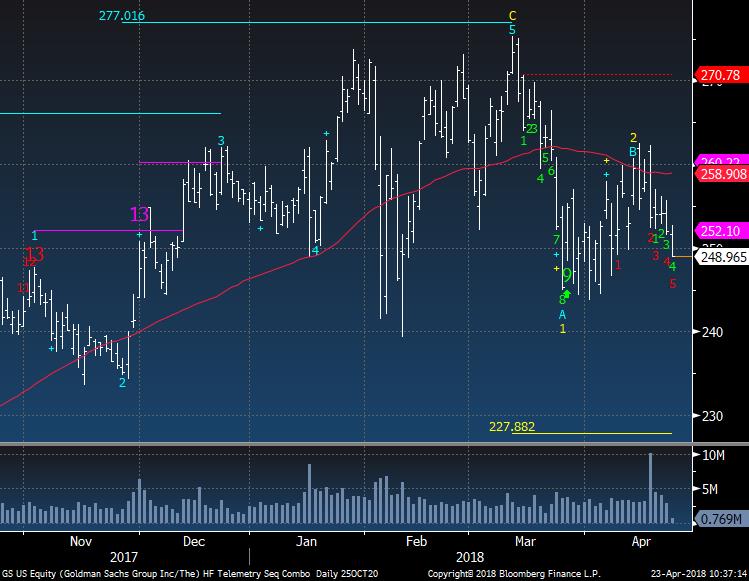
Goldman Sachs reported earnings early last week and has sold off to make a new 2 week low. It's on day 5 of 13 with a downside red Countdown too.
|
|
|
|
|
|
|
|
|
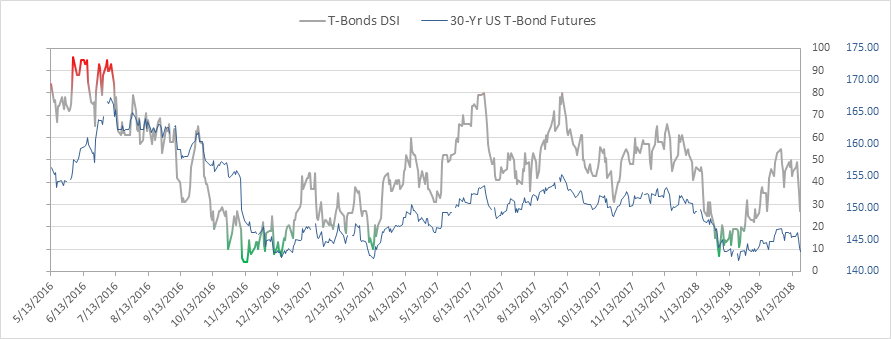
Bond bullish sentiment is at 27% and continues to drop. It it 11% on 2/19 and could be back there in a few days with this action!
|
|
|
|
|
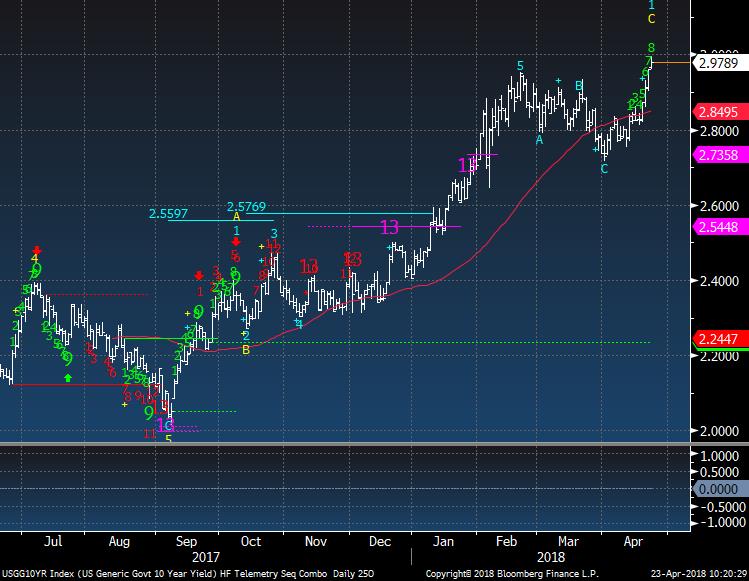
US 10 Year Yield is on daily is on day 8 of 9 with an upside green Setup. Tomorrow it should trigger and some consolidation will be expected.
|
|
|
|
|
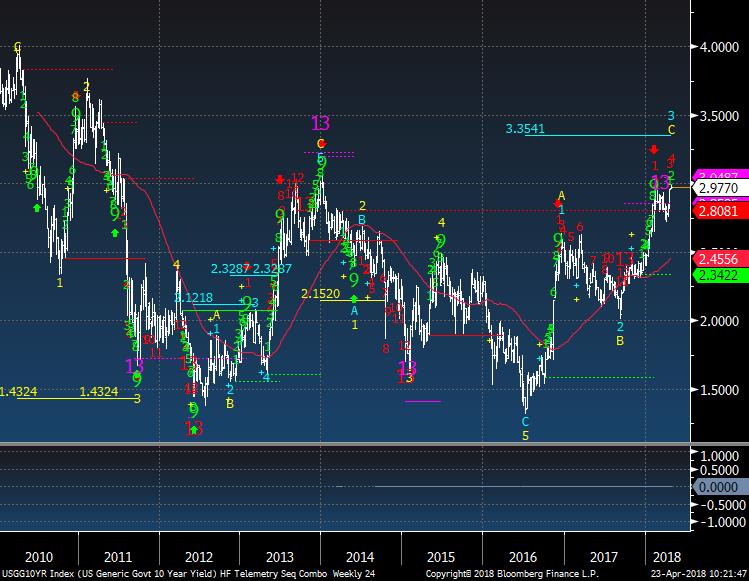
The weekly still has an upside red Countdown on week 4 of 13 with a Wave 3 upside price objective of 3.35. This upside price objective has been discussed many times in the past year
|
|
|
|
|
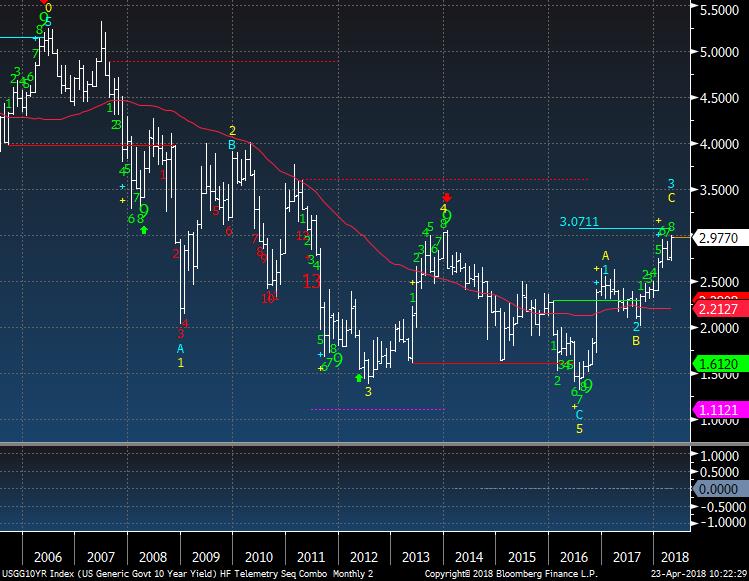
The monthly only has an upside price objective of 3.07%. It's on month 8 of 9 with a green Setup and the Setups have been pretty good in the past.
|
|
|
|
|
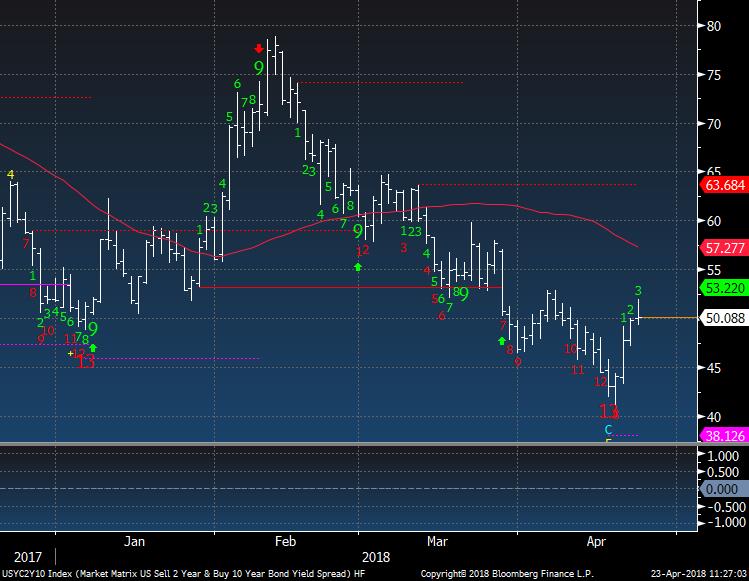
2/10 Yield Curve continues to steepen after the exhaustion signal
|
|
|
|
|
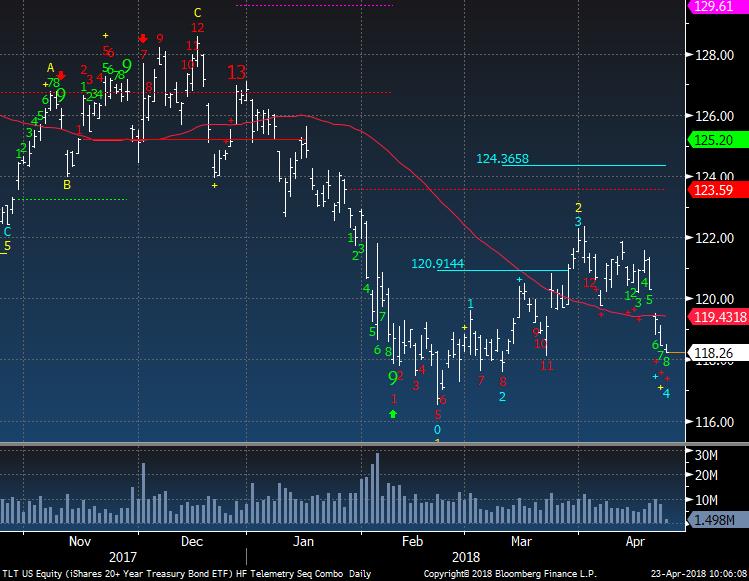
TLT Bond ETF needs to trade under 117.91 to trigger the downside exhaustion red 13
|
|
|
|
|
|
|
DEMARK SCREENS - Daily, Weekly, Monthly Upside/Downside Exhaustion Signals
|
|
|
Daily/Weekly DeMark upside/downside exhaustion signals (Sequential) Weekly updated on Monday's. Price flips occur when a stock closes higher/lower than four previous closes.
S&P 1500 Universe:
DAILY UPSIDE 13: ITG
DAILY DOWNSIDE 13: CBS, DE, EV, FSP, GIS, MAC, NN, OHI, PLCE, RL, SNH, SPG, SWN, TR, WWW
DAILY UPSIDE WITH PRICE FLIP REVERSAL DOWN: AAWW, ASGN, BHE, CTS, ENS, FE, KEX, MTSC, NAVG, PWR, RHT, SMRT, WDFC,WEN
DAILY DOWNSIDE WITH PRICE FLIP REVERSAL
UP: FII
Updated: 4/23/18
WEEKLY UPSIDE 13: AAPL, ALGN, AVAV, BCOR, CBSH, CCMP, COP, CY, EMN, FCFS, IEX, KFY, LRCX, NSP, PLT, PSX, RYN, STMP, STX, ZION
WEEKLY DOWNSIDE 13: KMB, SKT
Updated: 4/2/18
MONTHLY UPSIDE 13:
MONTHLY DOWNSIDE 13:
Euro Stoxx 600 Universe:
DAILY UPSIDE 13: AM FP, BOL FP, INVEB SS
DAILY DOWNSIDE 13: DUE GR, OSR GR
DAILY UPSIDE WITH
PRICE FLIP REVERSAL DOWN: BOL FP, SRT3 GR
DAILY DOWNSIDE WITH PRICE FLIP REVERSAL UP: NONE
Updated: 4/23/18
WEEKLY UPSIDE 13: BN FP, HL/ LN, PHNX LN, PSN LN,
VNA GR, WKL NA, WTB LN
WEEKLY DOWNSIDE 13: NRE1V FH
Updated: 4/2/18
MONTHLY UPSIDE 13: ASSAB SS, BEZ LN
MONTHLY DOWNSIDE 13: CPI LN
|
|
|
Unsubscribe me from Hedge Fund Telemetry
Hedge Fund Telemetry LLC, P.O. Box 4675, Greenwich, CT 06861, United States
CONFIDENTIALITY NOTE and DISCLAIMER: This message is for the named person's use only. It may contain confidential, proprietary or legally privileged material. No confidentiality or privilege is waived by any accidental or unintentional transmission. If you receive this message in error, please immediately delete it and all copies of it from your system, destroy any hard copies and notify the sender. You must not, directly or indirectly, use, disclose,
distribute, print or copy any part of this message if you are not the intended recipient. Hedge Fund Telemetry LLC. cannot guarantee the confidentiality of the material transmitted; therefore, information of a sensitive or confidential nature should not be transmitted. There is risk in trading markets. Hedge Fund Telemetry LLC reports are based on information gathered from various sources and believed to be reliable, but are not guaranteed as to accuracy and completeness. The information is subject to change without notice and Hedge Fund Telemetry LLC has no obligation to provide any updates or changes. Hedge Fund Telemetry LLC is providing this data for informational and educational purposes and does not believe that it is sufficient to base an investment decision on. This information should not be regarded as a solicitation or recommendation of any particular security or to engage in any trading strategy. One should always check with your licensed financial
advisor to determine suitability of any investments.
|
|
|
|
|