If you are having difficulty seeing this email, you can view in your browser or click here to
print.
|
|
|
|
|
04/18/2018
Thomas Thornton
|
|
|
A look at the S&P Sectors
|
|
|
There's been a lot of excitement with the recent bounce off the recent low as the bottom. The bounce was timed well with sentiment at 8% bulls with the S&P and a plethora of downside daily DeMark exhaustion signals on indexes, sectors, and stocks. The set up was similar at the February lows albeit volatility then was much higher and volume higher too. The recent bounce has seen some of the lowest volume days of the year. (typical of a Wave 4 corrective bounce)
This doesn't matter for many people who are bullish. It matters for me since an increase in volume on the way up is bullish demand whereas this has been a lack of sellers. On a positive note, cumulative breadth indexes on a few indexes has improved to make nominal new highs but no indexes, sectors, or few stocks have made highs above January's high. Today I'm am doing a look at the top US sectors. I still believe a series of lower highs and lower lows is ahead and selling into the strength isn't easy but it's likely what needs to be done. Earnings expectations are very high and the reaction to upside beats and downside misses is pronounced. Financials continue to be sold even after reporting better top and bottom line results too.
The best performing sector recently has been the energy sector with the recent strength in crude and natural gas. Energy has good seasonality in this period through May and having some mideast tensions adds to the
upside potential.
I've been running late today after several calls with clients so I'll leave it here.
Notable:
- US Markets - Sentiment improving more yet not one sector has made a new 4 week high
- Hedge Fund Telemetry Trade Ideas - Added to AMZN short
- European Market - Still improving, Banks could stall out on this bounce
- Currencies - USD nothing to do, Sterling short it, Bitcoin laugh at it
- Asian Markets - Hong Kong still looks vulnerable, Nifty should consolidate and Nikkei looks OK
- US Sector Focus
- Copper, Gold, and Silver Update - I like Silver over Copper and Gold
- Bond Update - High Yield should consolidate, 2/10 Yield Curve - Day, Week, Month look
- DeMark Screens - Daily, Weekly, Monthly upside/downside exhaustion signals within the S&P 1500 and Euro Stoxx 600
|
|
|
|
|
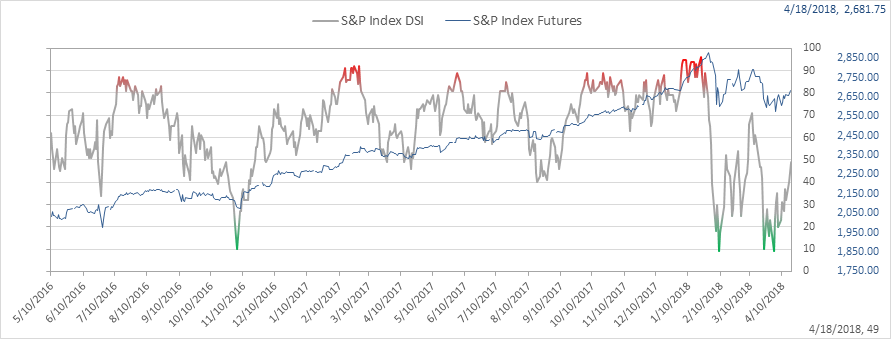
SPX bullish sentiment is at 49%. After the February low sentiment rose from 9% to 71% and right back down. I would bet a lower high in sentiment is probable
Here's a link to the Hedge Fund Telemetry market sentiment page with 40 charts of sentiment including equities, bonds, currencies, and commodities updated each day.
|
|
|
|
|
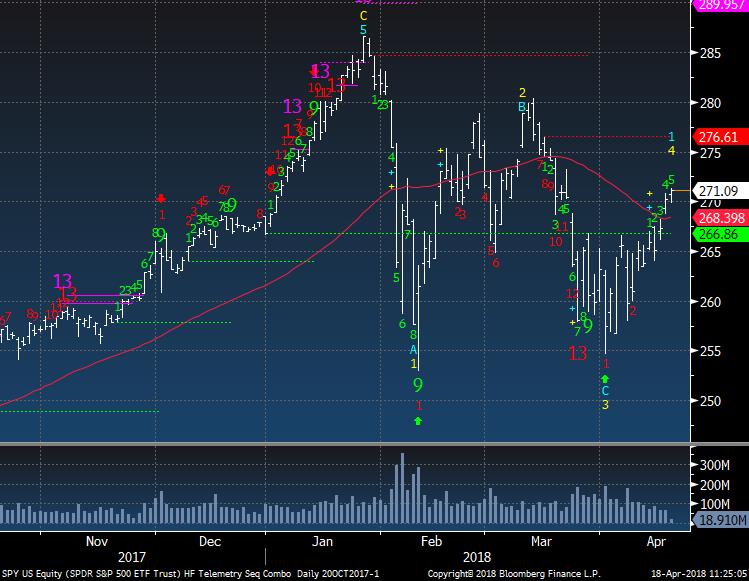
SPY continues to trade over the 50 day moving average yet look back at the chop around in February and March above and below and know it's for the most part just an average that people watch for trend. As you'll see below with all the sectors lower highs have been prevalent
|
|
|
|
|
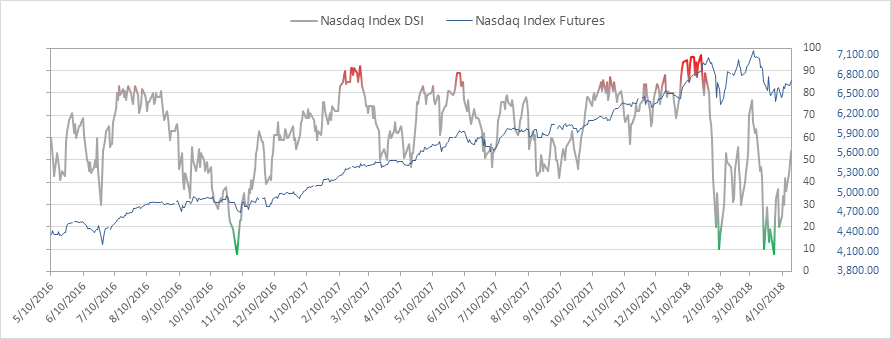
Nasdaq bullish sentiment is at 54%. It reached 77% at the top in March and then fell to 8%
|
|
|
|
|
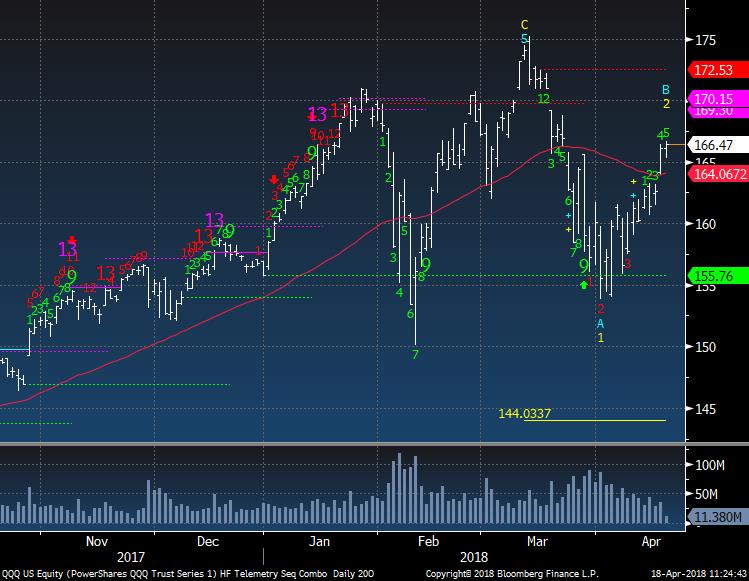
QQQ has bounced and is nearing the January highs. I'm not a big "pattern" guy but this looks like it's forming a head and shoulders top.
|
|
|
|
|
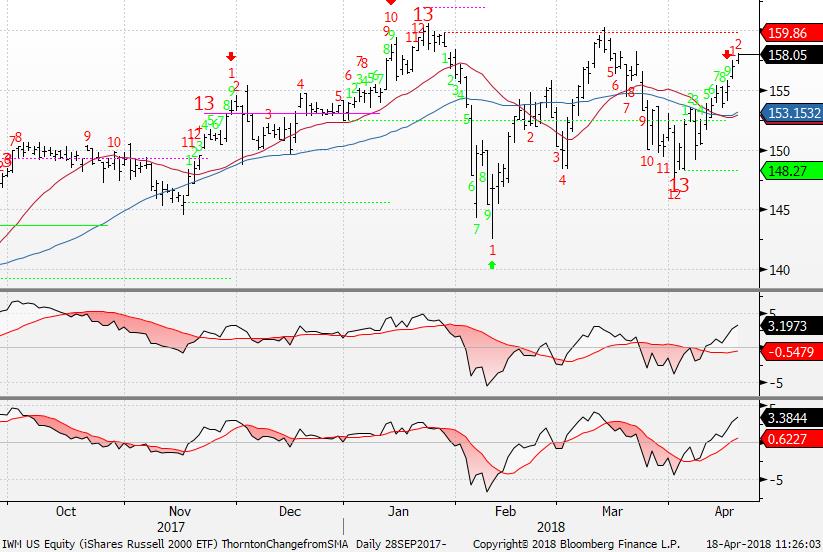
IWM Russell 2000 has traded in a distinct sideways chop. It's on day 2 of 13 with an upside Countdown but as you see Countdowns in the past have been rather choppy and scattered
|
|
|
|
|
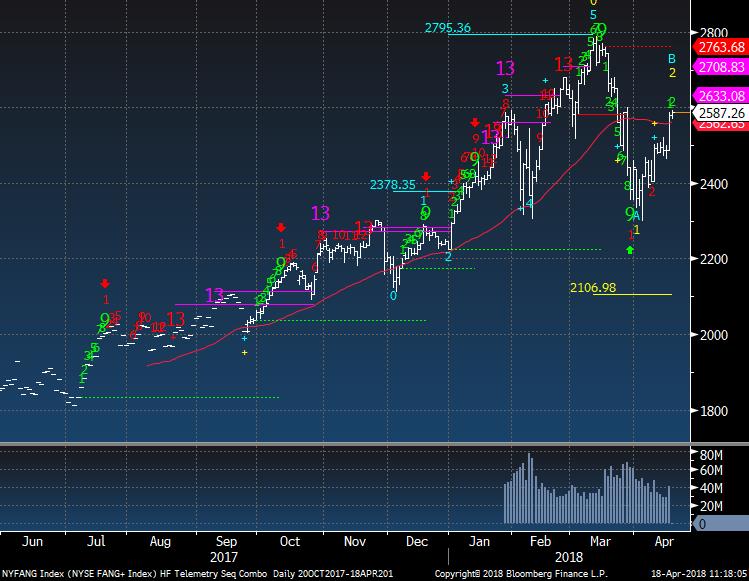
FANG + had a huge day yesterday and hasn't been able to keep it going. The downside Wave 3 price objective is 2106.
|
|
|
|
|
|
|
Hedge Fund Telemetry Trade Ideas
|
|
|
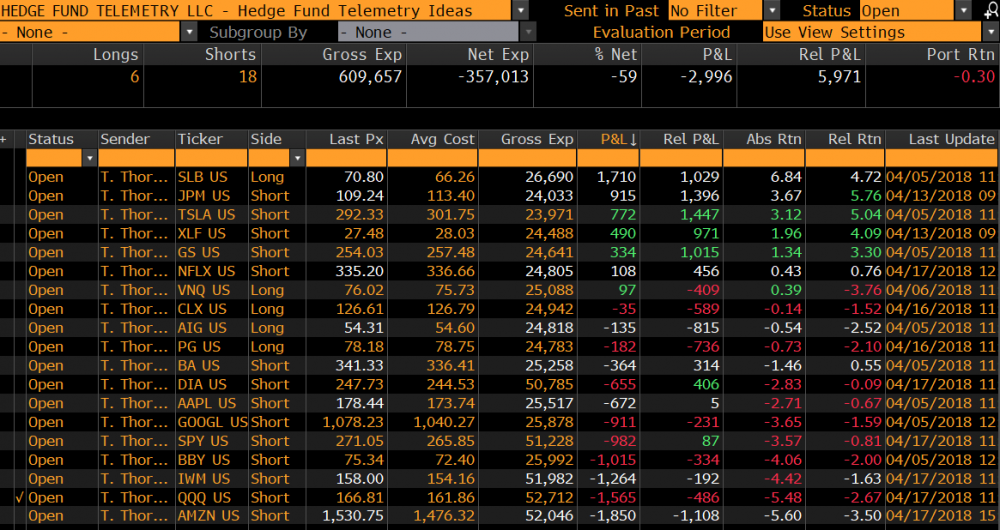
Trade Ideas: Down 30bp since 4/5 and still carrying a lot of cash. Shorts are mixed with Fins, Tesla, and NFLX working. I added yesterday to AMZN short to take it to max size 5%
|
|
|
|
|
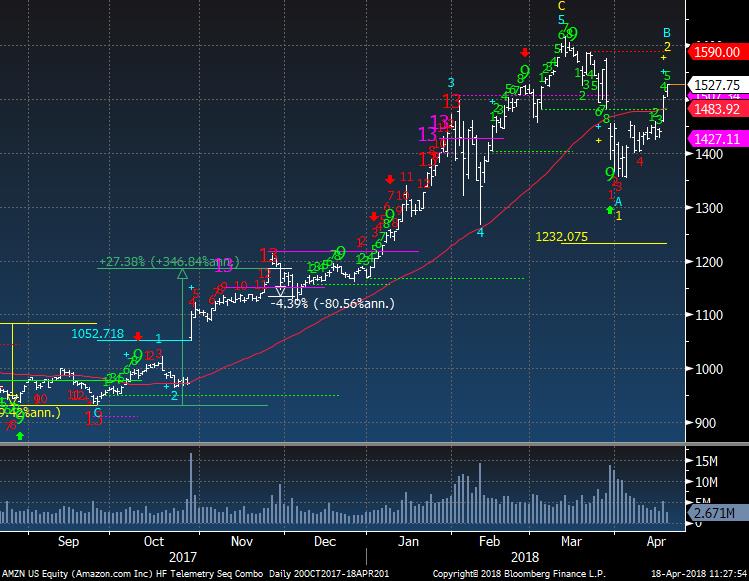
AMZN is once again ripping higher and considering it has 1% of its float short, it can't be a short squeeze. This is pure FOMO. I doubled up my position short yesterday late by adding another 2.5% sized short. 5% is my max size at trade inception. My average is 1476 and I'm down 5.5%. No it doesn't feel good but I have faith this Wave 2 will soon fail and reverse
|
|
|
|
|
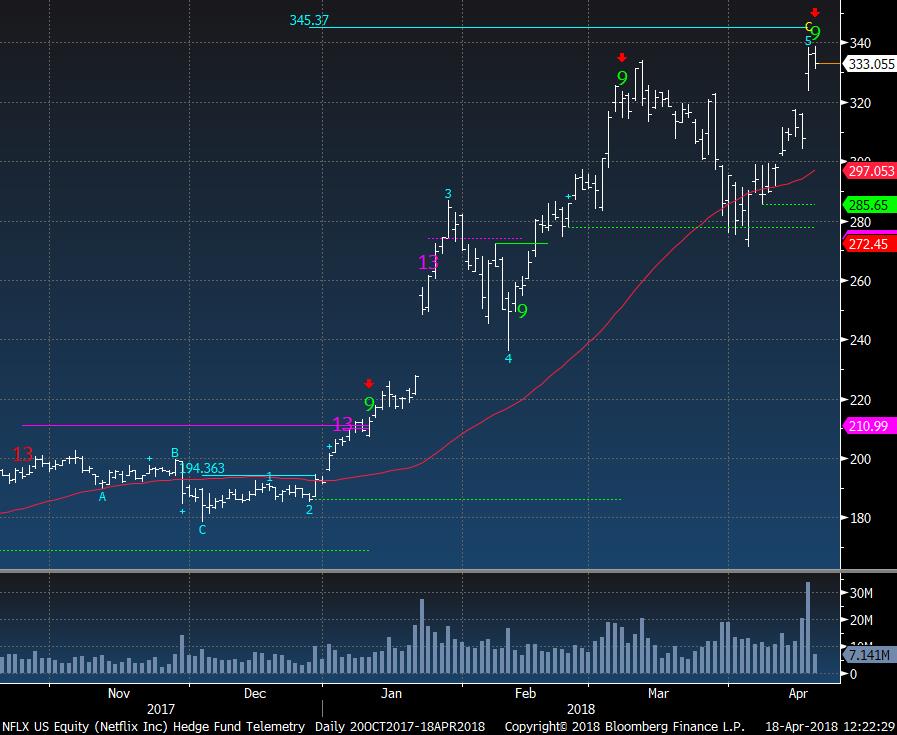
NFLX had a strong day yesterday and has faded off the highs. I added 2.5% size short in this yesterday
|
|
|
|
|
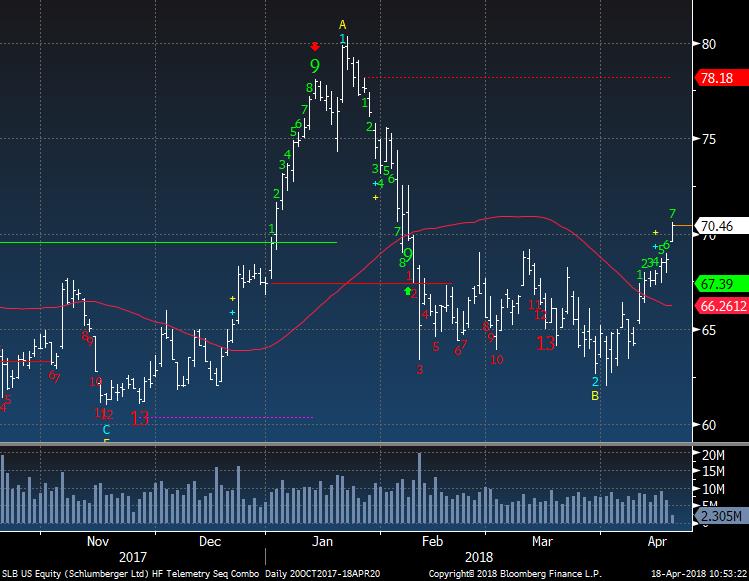
SLB has been a long idea since March. I have traded this in the past with the downside DeMark exhaustion when it triggered in the 5th down wave in November. This time is made a higher low Wave 2 on an upside wave sequence. Wave 3 on the upside will trigger near 80.
|
|
|
|
|
|
|
|
|
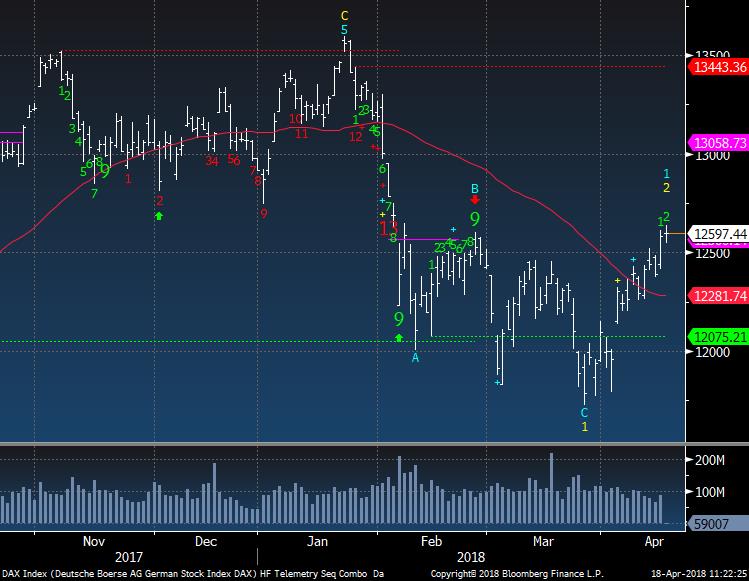
DAX has stalled today yet did make a new high above the February high. This is improving and some sideways action to build a base would be welcome
|
|
|
|
|
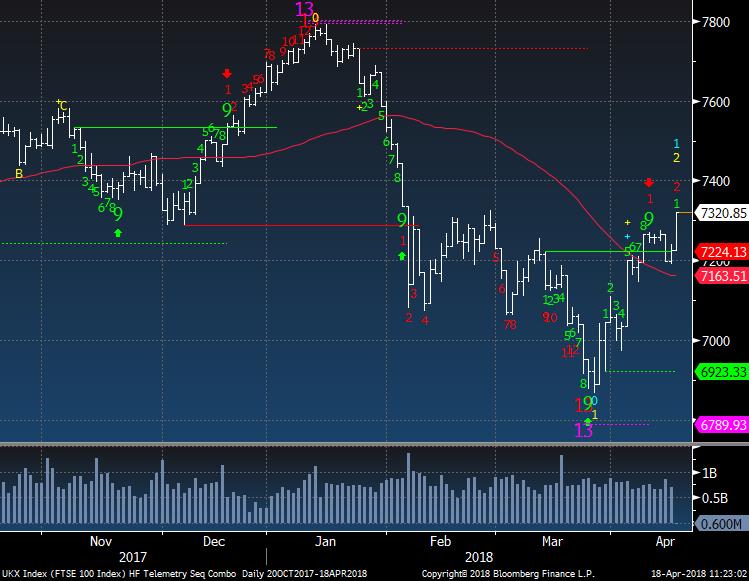
UK FTSE 100 reacted with the Pound Sterling decline today. There is an upside red Countdown on day 2 of 13.
|
|
|
|
|
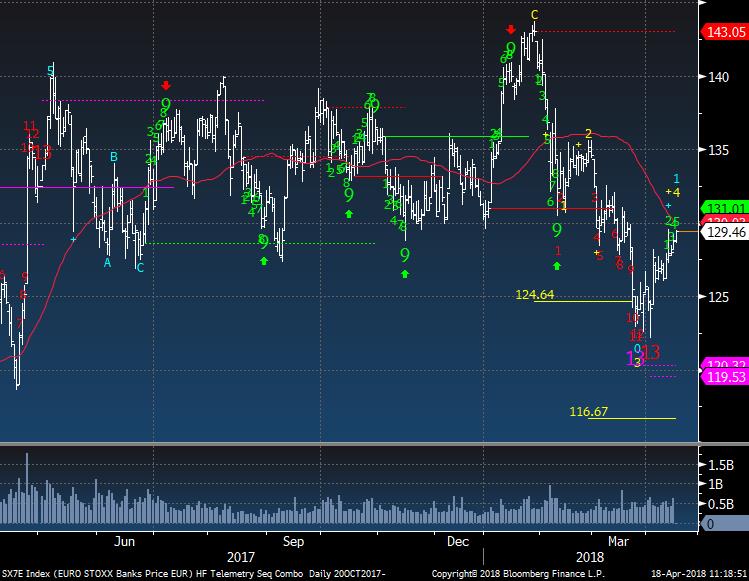
Euro Banks reacted well off the recent downside exhaustion signals and meeting the downside Wave 3 price objective. There is a downside Wave 5 price objective of 116.67 in play but this wave count would change if this moves above 135 (Wave 2)
|
|
|
|
|
|
|
|
|
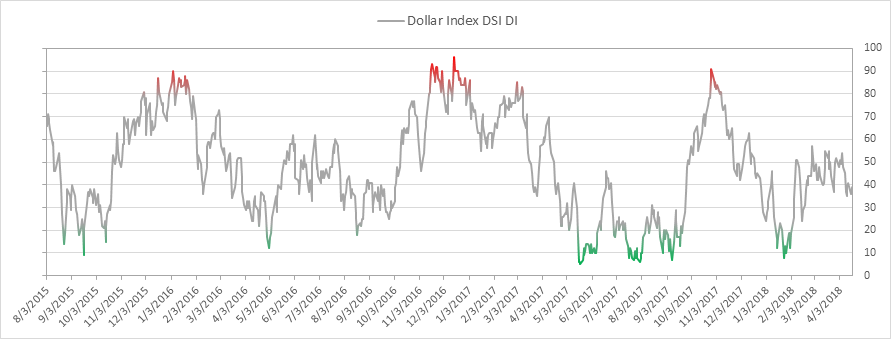
US Dollar bullish sentiment is at 39% and holding the low end of the recent range
|
|
|
|
|
DXY US Dollar Index could have a downside green Setup 9 tomorrow and that would negate the unfinished red Countdown on the top. At this point, I remain neutral
|
|
|
|
|
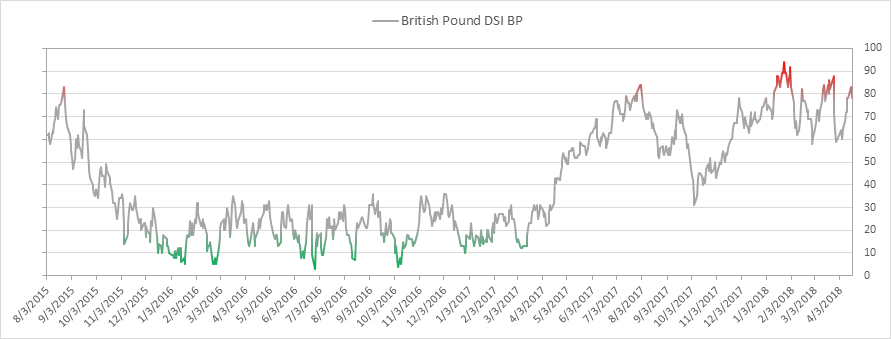
British Pound Sterling bullish sentiment dropped to 78% from a recent high of 83%
|
|
|
|
|
Yesterday Sterling had an upside red Countdown 13 just barely in topping Wave 5. The big support is at 1.40
|
|
|
|
|
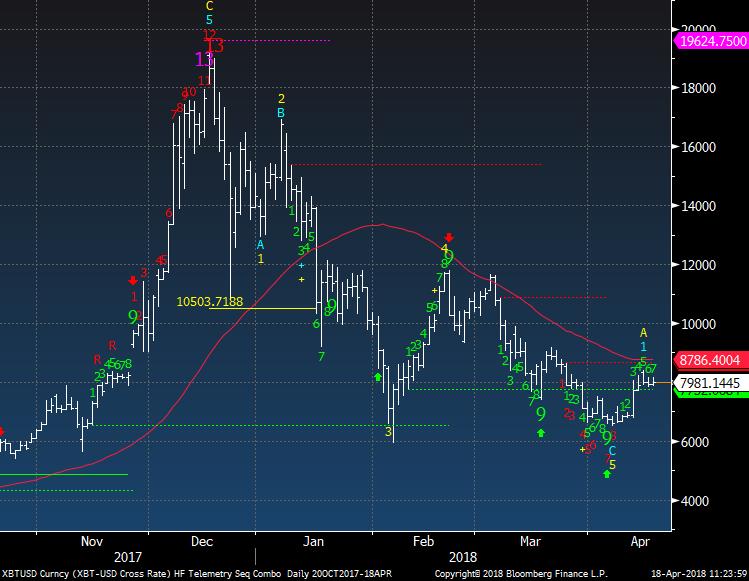
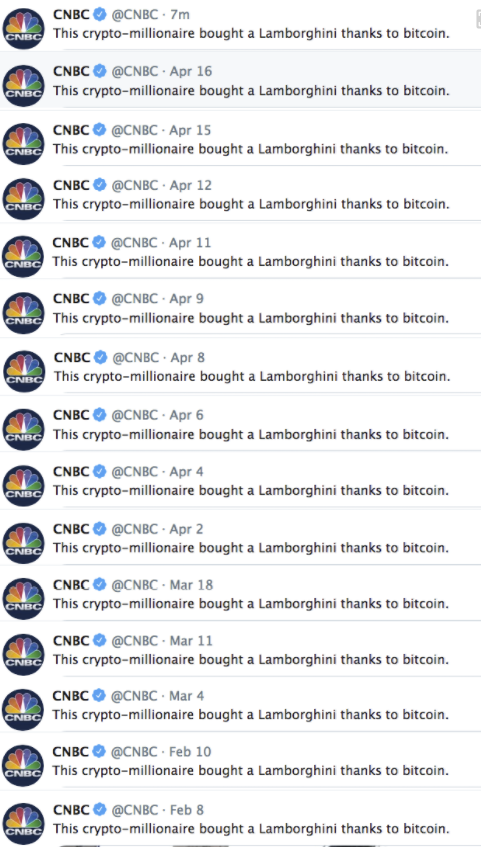
Bitcoin bounced and couldn't seem to continue the "surge" I was told by CNBC happened.
|
|
|
|
|
CNBC has been running the same story all the way down. How many Lamborghini's does one man need? I am curious why CNBC has been so blatantly hyping crypto currencies when they have done nothing but go down for the past 5 months? I have a few CNBC people who read this and I'd like to get an email with your thoughts. You will remain anonymous
|
|
|
|
|
|
|
|
|
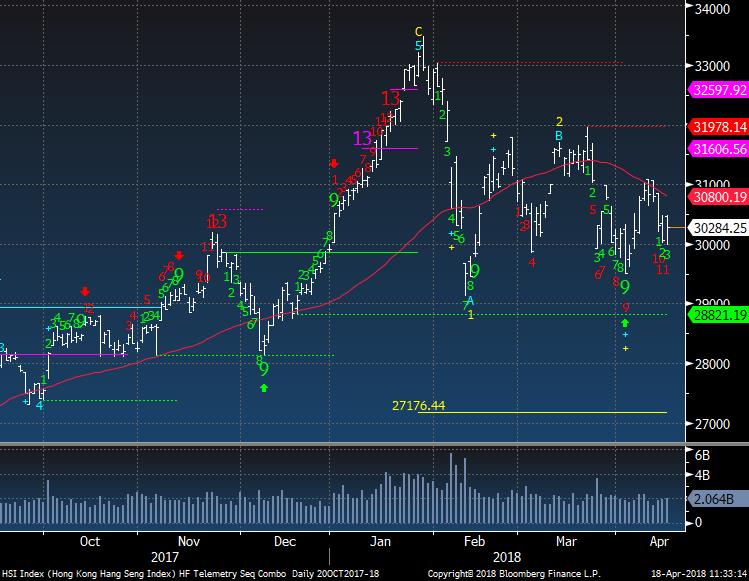
Hang Seng is on day 11 of 13 with a downside Countdown
|
|
|
|
|
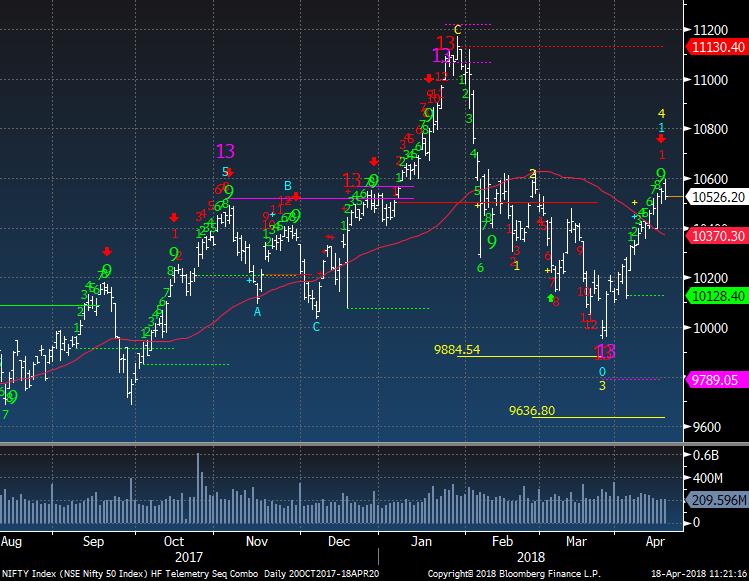
India Nifty 50 Index reversed today after a green Setup 9. Some consolidation is due. But this could break and go to the downside Wave 5 price objective of 9636.
|
|
|
|
|
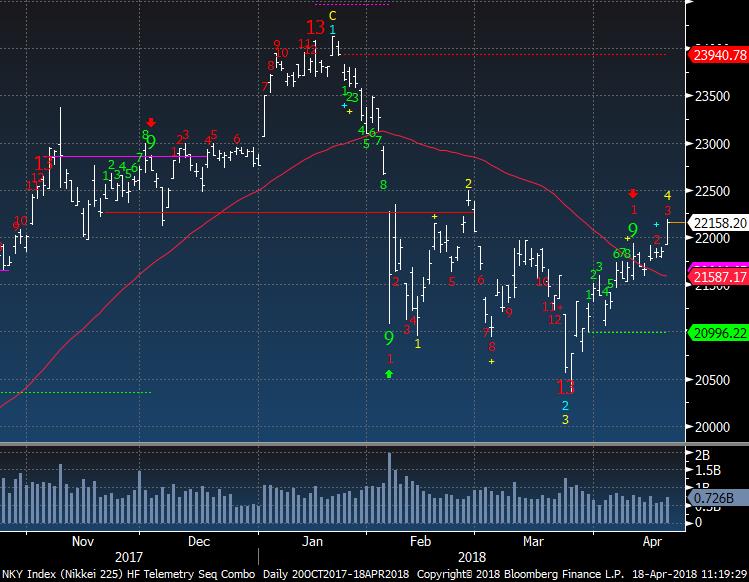
Nikkei Index looks a little constructive on day 3 of 13. It's in Wave 4 and that's corrective but some further gains is possible
|
|
|
|
|
|
|
|
|
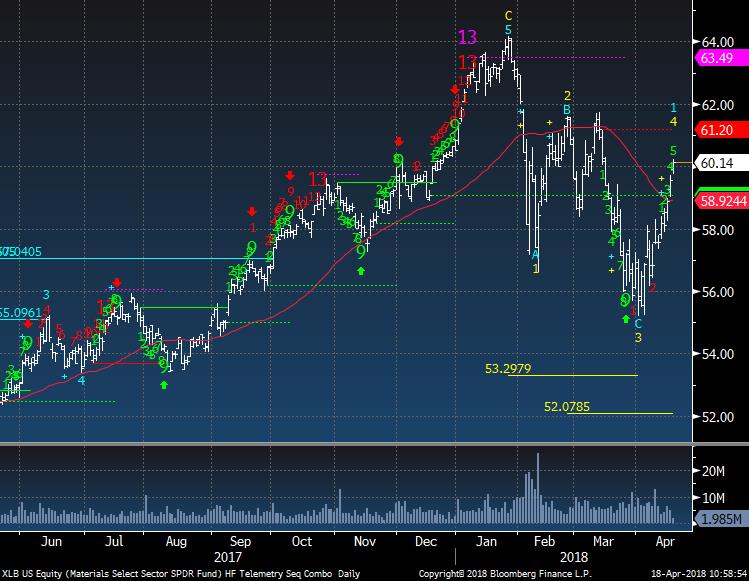
Materials did make a lower low vs February low and locked in Wave 3 and now this is Wave 4 and it should fail below the February high
|
|
|
|
|
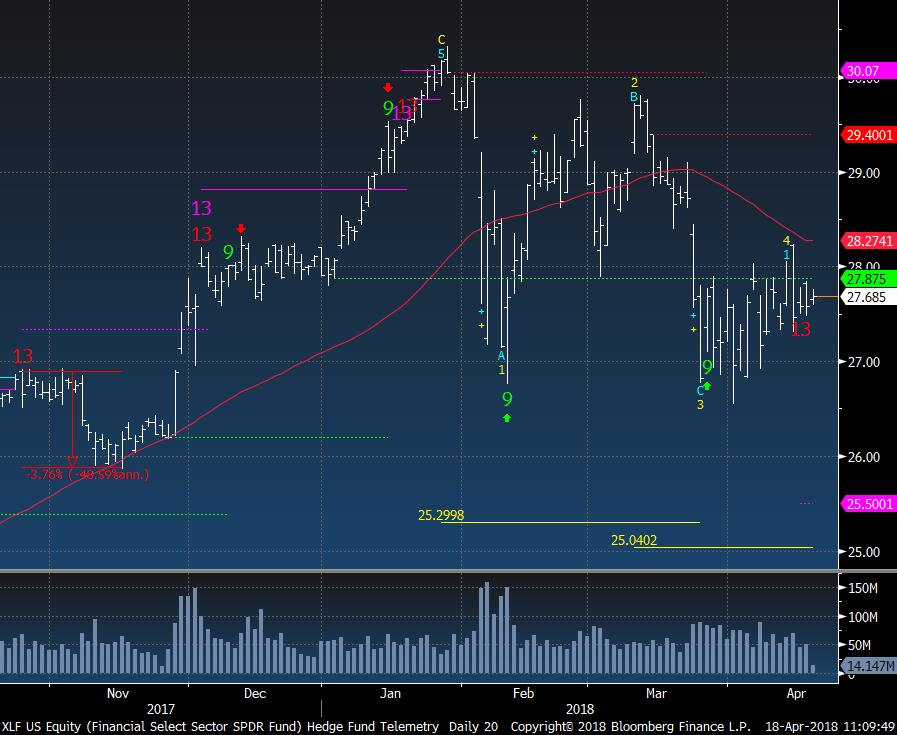
Financials had a downside red Countdown 13 a few days ago and it's a little odd since there were not downside exhaustion signals in any of the major weights. This still has a wave pattern on Wave 4 with a downside price objective of 25.04
|
|
|
|
|
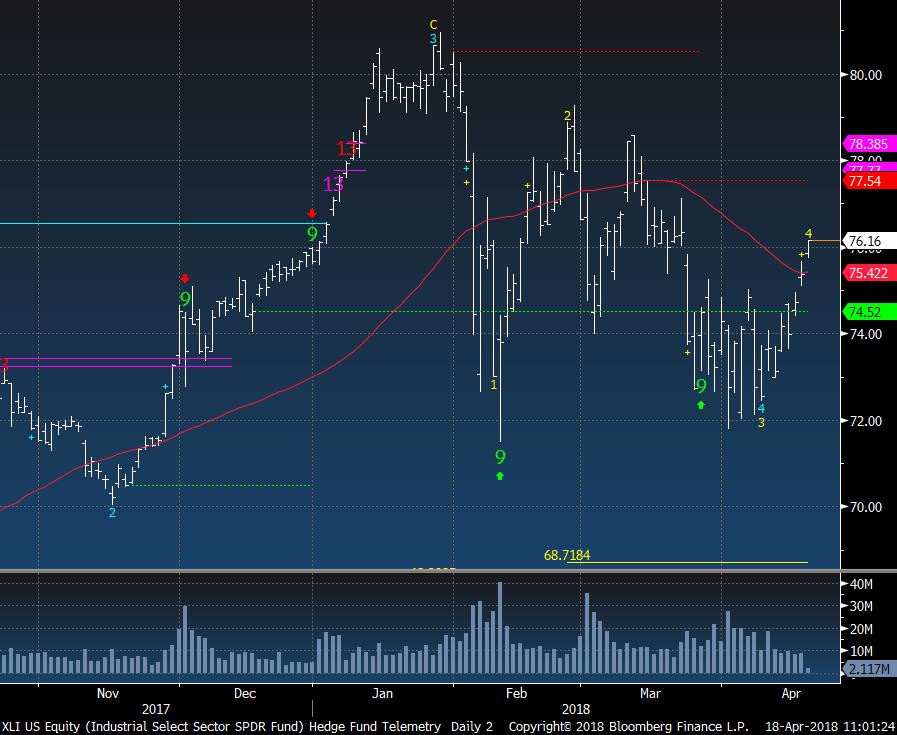
Industrials has made a series of lower highs and is on Wave 4 with a downside Wave 5 price objective of 68.71
|
|
|
|
|
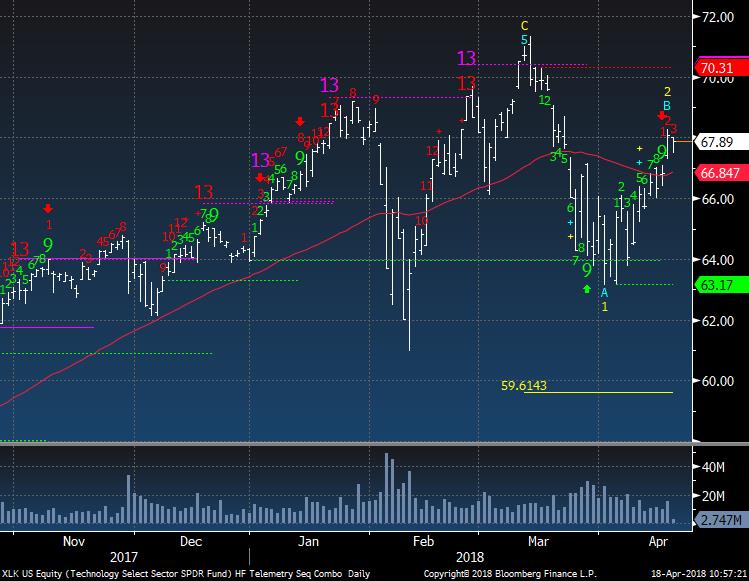
Technology like QQQ could be making a head and shoulders top. The positive here is that there is an upside Countdown on day 3 of 13 and Countdowns on the upside last year were quite strong. If you are short XLK using a new closing high is a reasonable stop
|
|
|
|
|
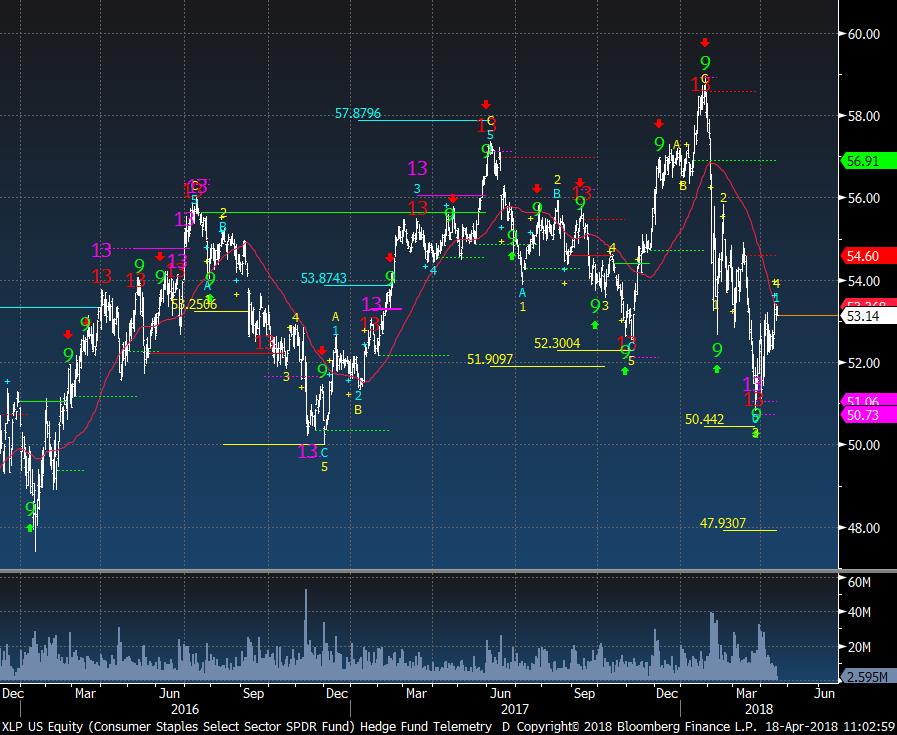
Staples has a very good record with DeMark indicators over the years. The recent downside exhaustion signals worked well although it was Wave 3 and now this is in Wave 4 with a Wave 5 downside price objective of 47.90. I remain long CLX and PG as defensive stocks. I'm not married to them and could exit at any time
|
|
|
|
|
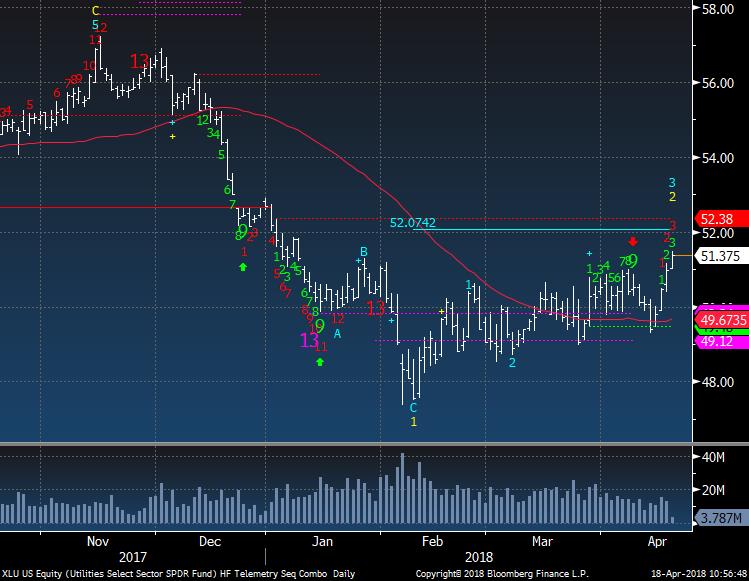
Utilities is closing in on a new 2018 high and has built a nice base. It's faded a bit today but I still like this for the breakout potential as it's only on day 3 of 13 with an upside Countdown
|
|
|
|
|
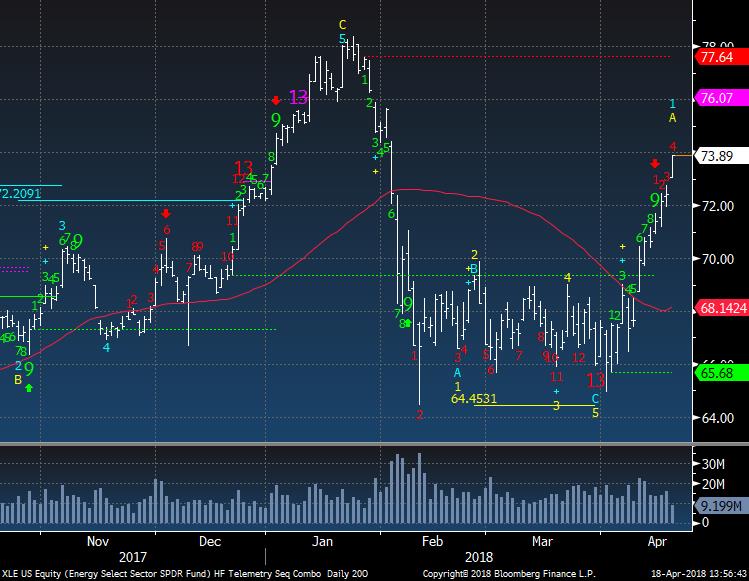
Energy had a downside red Countdown 13 a the closing low for 2018 and just getting into Wave 5 on the downside. I take Wave 5 13's much more seriously and now it has an upside Countdown on day 4 of 13. Keep in mind this is energy and energy can get cut down quickly within an uptrend. My proxy has been to be long SLB
|
|
|
|
|
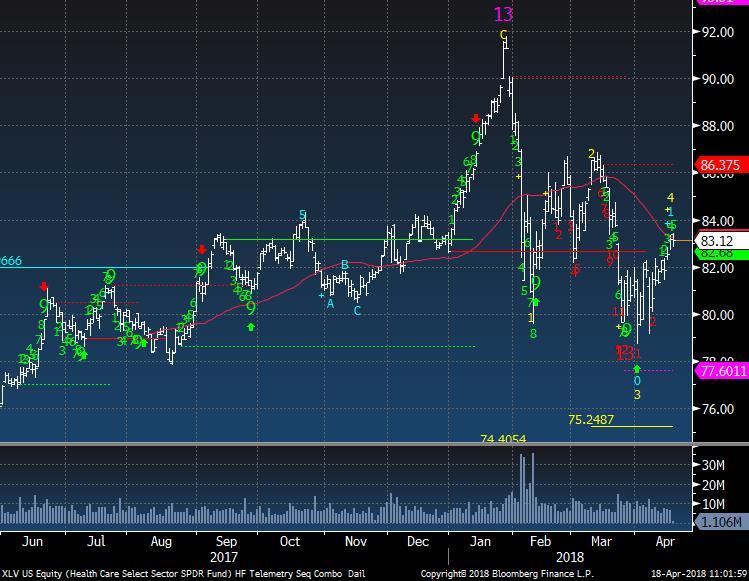
Healthcare has made a series of lower high and lower lows. This is on Wave 4 and has a downside Wave 5 price objective of 75.24
|
|
|
|
|
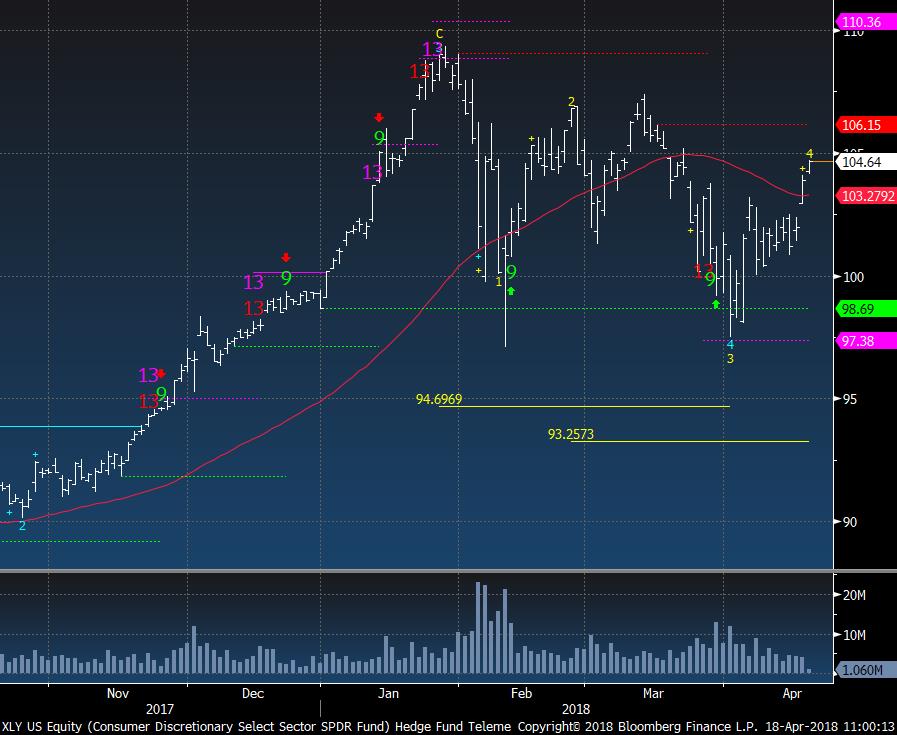
Consumer Discretionary has lifted in the past two days with NFLX and AMZN. This is in Wave 4 and has a downside price objective of 93.25
|
|
|
|
|
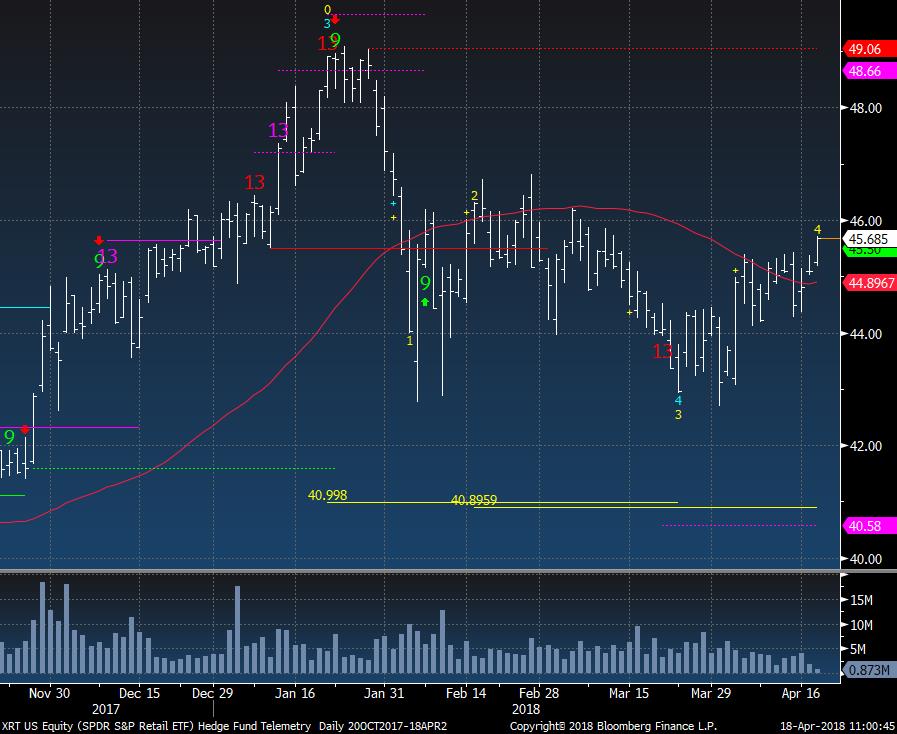
Retail has been going sideways and is up nicely today but its also on Wave 4 with a downside Wave 5 price objective of 40.89
|
|
|
|
|
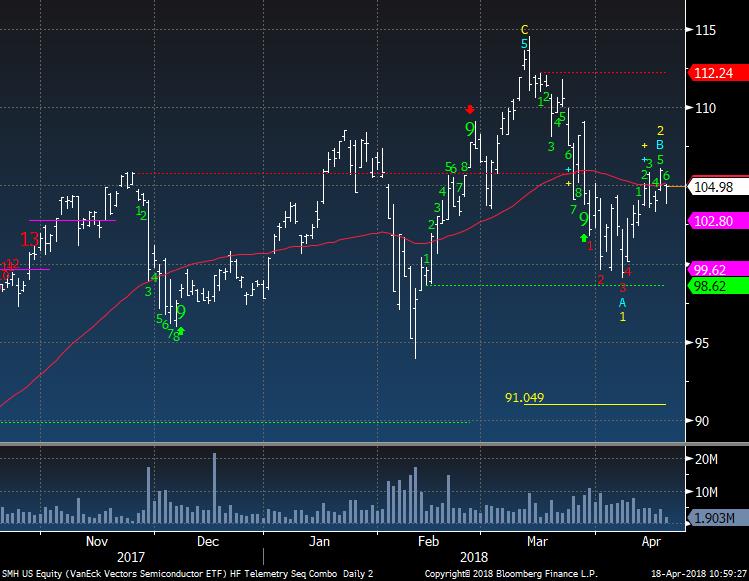
Semiconductors made a new high like the QQQ and Tech in March and now could be making a lower high. There is a Wave 3 downside price objective of 91.04
|
|
|
|
|
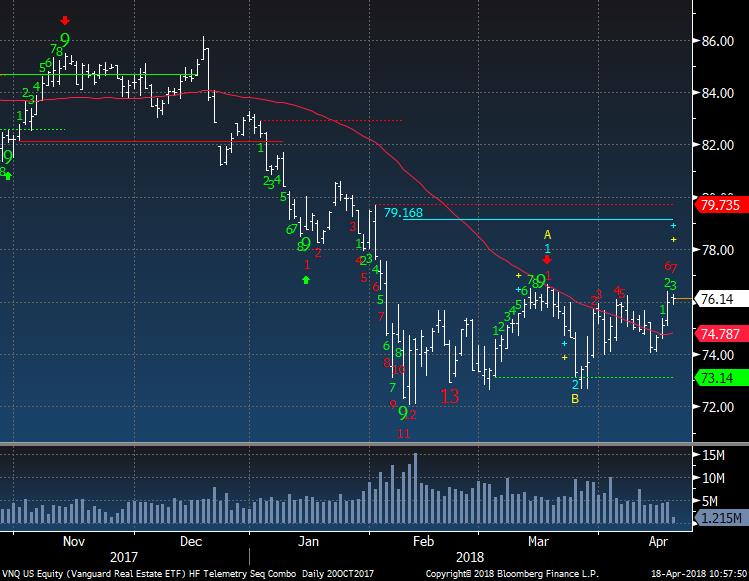
Real Estate like Utilities has built a nice base and has an upside red Countdown on day 7 of 13. There is an upside Wave 3 price objective of 79.16.
|
|
|
|
|
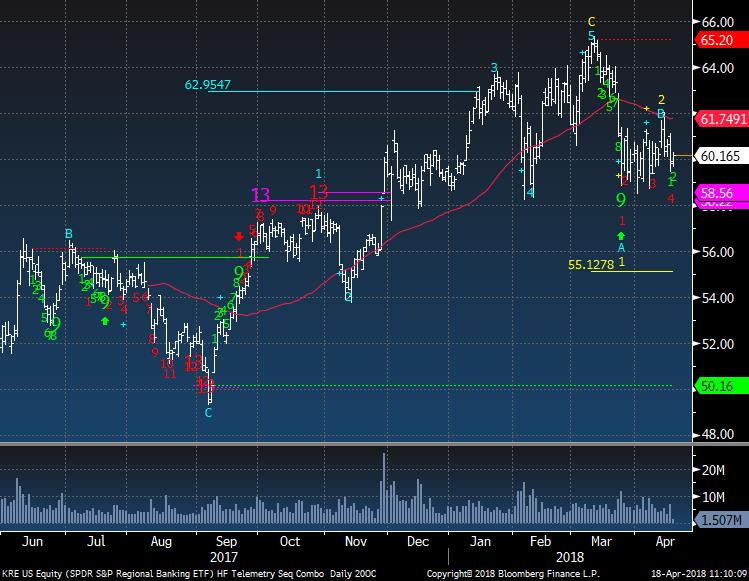
Regional Banks made a high in early March and now a new lower high. There is a downside red Countdown on day 4 of 13 with a Wave 3 downside price objective of 55.12
|
|
|
|
|
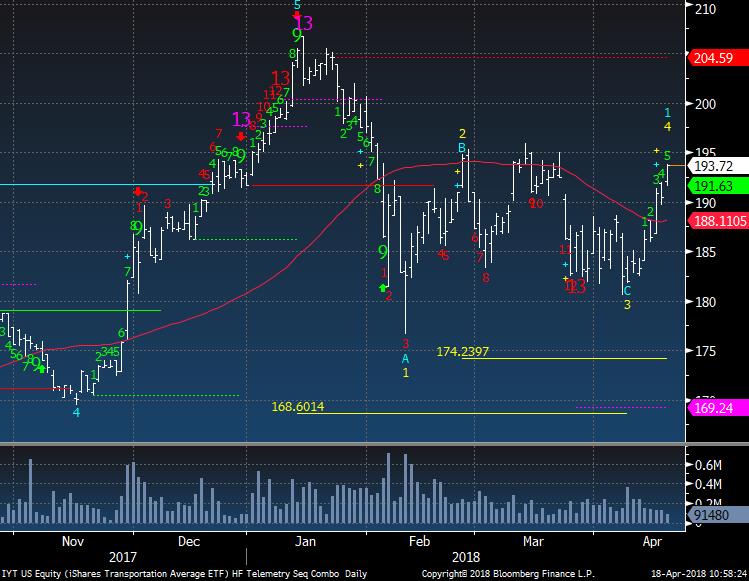
Transports made a new lower closing low in April locking in Wave 3 and now bounced into a Wave 4. Keep in mind, if this closes over the high in February (Wave 2 yellow) the count would revert to the 3rd down Wave would become Wave 1 down and the bounce would revert to Wave 2 from 4. Only a new high above the January high would negate the entire down countdown. Whew that's a lot of info...
|
|
|
|
|
|
|
Copper, Gold, Silver Updates
|
|
|
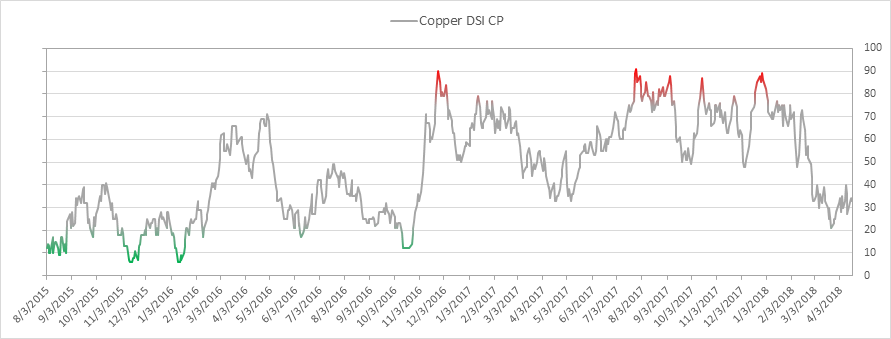
Copper bullish sentiment is at 33%. I'd like to see it get back above 50%
|
|
|
|
|
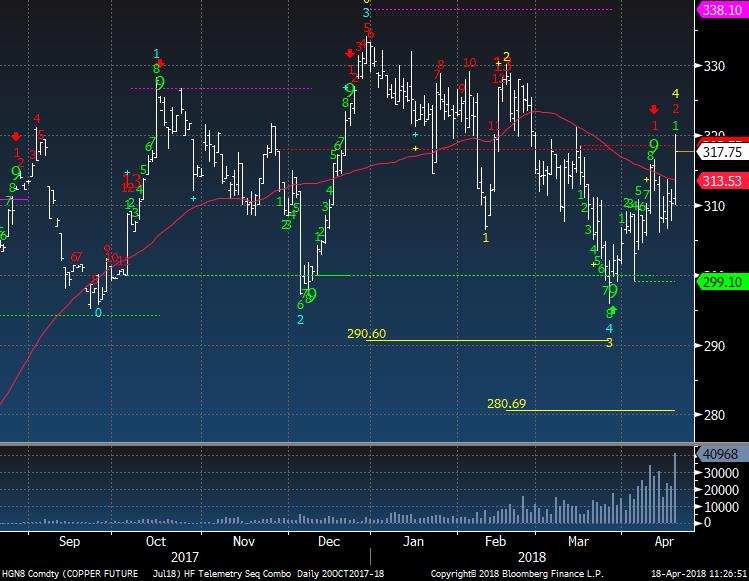
Copper Futures made a low recently after patiently letting it come down after the upside exhaustion signal. I went long near 300 and stopped myself out on that quick dip down under 299.10. I had the right idea but was too tight with my stop. Currently there is an upside Countdown on day 2 of 13. I'm not getting back in the trade at this point.
|
|
|
|
|
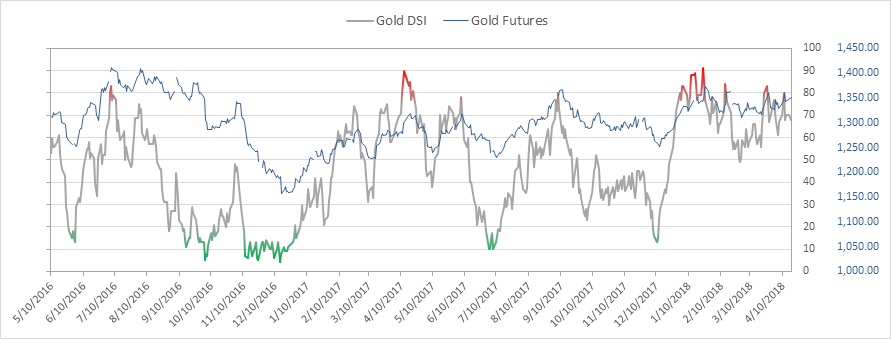
Gold bullish sentiment is at 68% and remains bid
|
|
|
|
|
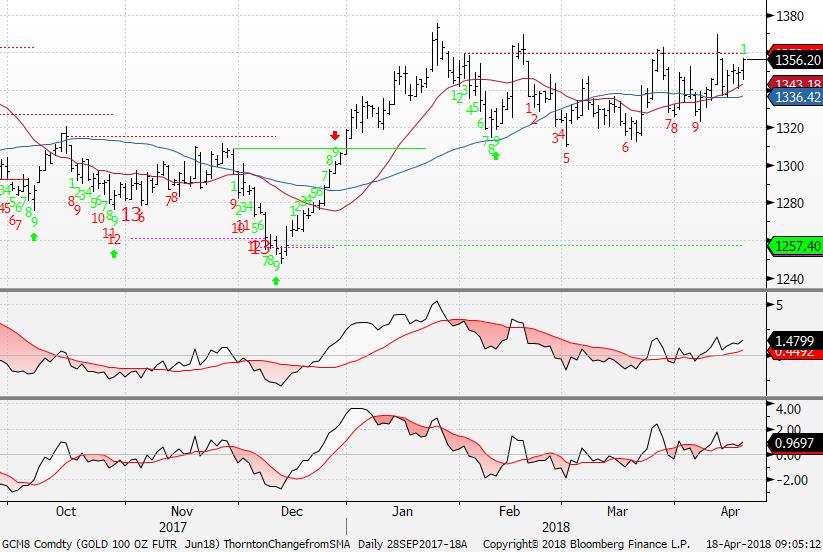
Gold Futures is knocking on a breakout yet has an finished downside red Countdown on day 9 of 13.
|
|
|
|
|
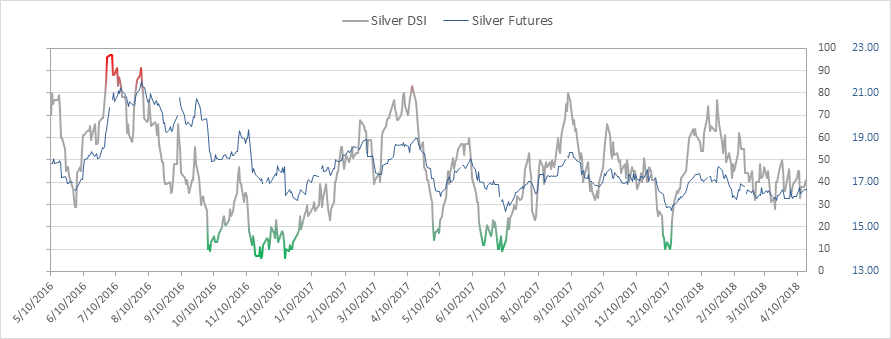
Silver bullish sentiment is at 41% and has had a hard time getting above 50%. Let's see after today's performance where it is
|
|
|
|
|
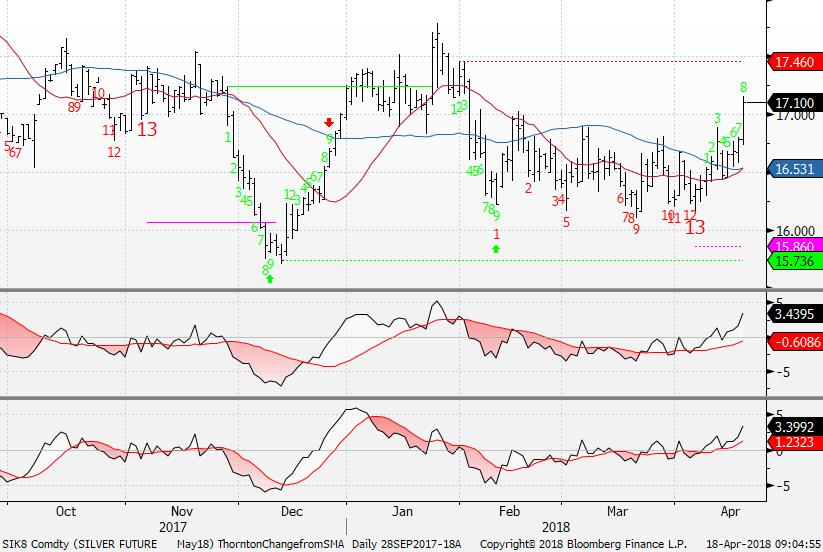
Last week I said I would buy Silver Futures (or SLV) due to the recent downside red Countdown 13. I liked Silver more than Gold at this point. A move over 17 today is powerful and now a target of 17.46 above remains. If you're buying today, buy small as tomorrow will have a green Setup 9.
|
|
|
|
|
|
|
|
|
Bond bullish sentiment is at 49%
|
|
|
|
|
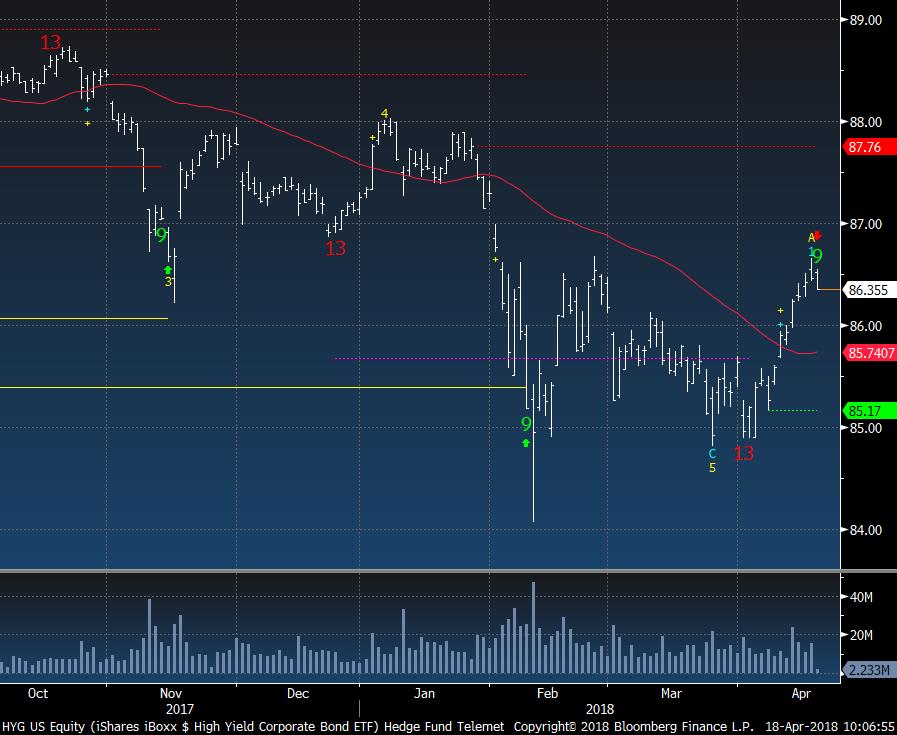
High Yield HYG has a green Setup 9 today and some consolidation is probable
|
|
|
|
|
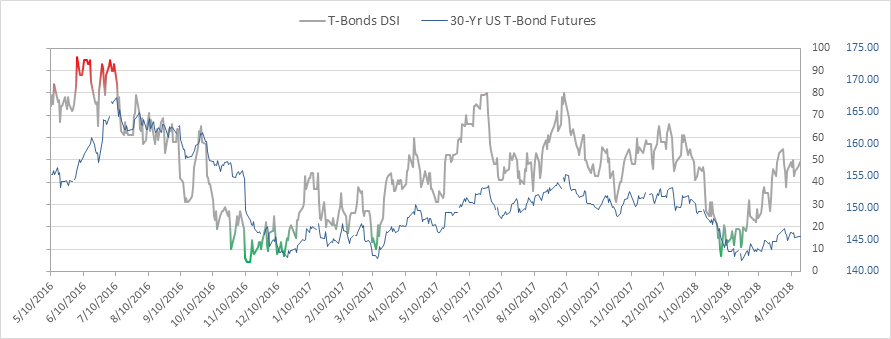
Here's the weekly of the 2/10 yield curve. It's on week 8 of 9 with a green Setup and week 8 of 13 with the red Countdown
|
|
|
|
|
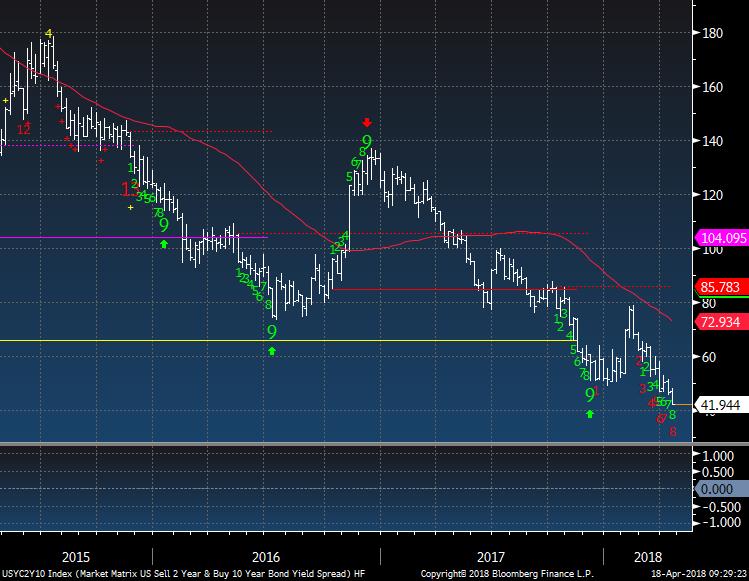
The daily has now both a red Sequential and pink Combo exhaustion - thus a steepening move could start soon - lets think within the next two weeks
|
|
|
|
|
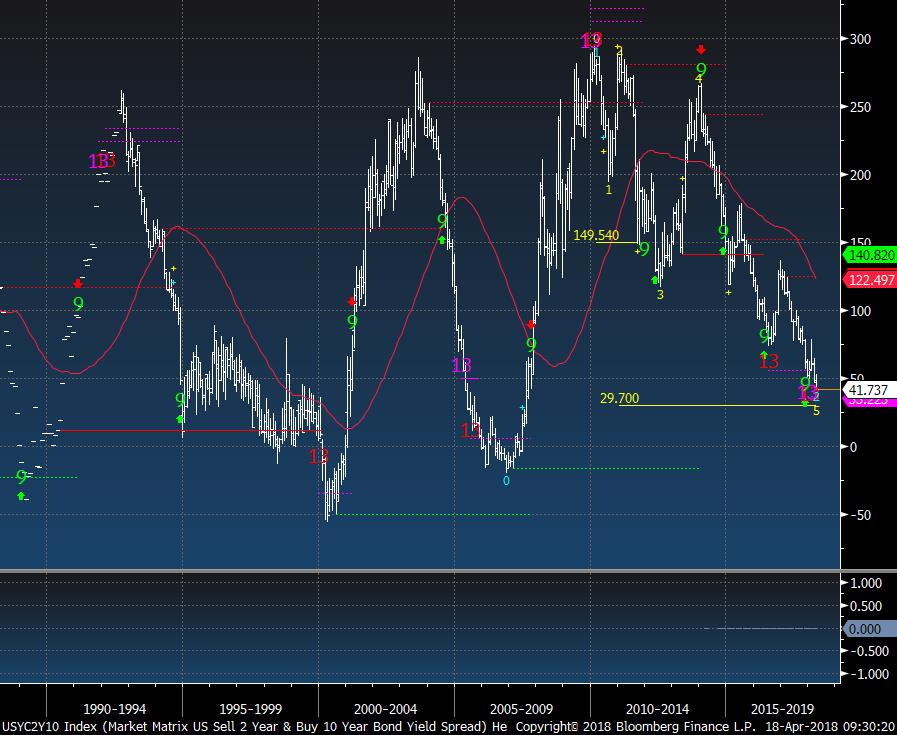
This is the monthly of the 2/10 yield curve. When this inverts it doesn't last that long and then it massively steepens and recessions are in full bloom.
|
|
|
|
|
|
|
DEMARK SCREENS - Daily, Weekly, Monthly Upside/Downside Exhaustion Signals
|
|
|
Daily/Weekly DeMark upside/downside exhaustion signals (Sequential) Weekly updated on Monday's. Price flips occur when a stock closes higher/lower than four previous closes.
S&P 1500 Universe:
DAILY UPSIDE 13: ABMD, AIR, AMAT, BABY, BC, CALM, ENS, HSII, SCL, WDFC, XYL
DAILY DOWNSIDE 13: CHK, HBHC, TRMK
DAILY UPSIDE WITH PRICE FLIP REVERSAL DOWN: FLS
DAILY DOWNSIDE WITH PRICE FLIP REVERSAL UP: CLGX, CNP, DFS, GGP, HIW, LN, OHI, PRGO, PSEC, SBRA, SE, SNH, TWI, UNT
Updated: 4/16/18
WEEKLY UPSIDE 13: ANF, CHRW, DECK, ELY, IO, KORS, LLL, STE, TYL
WEEKLY DOWNSIDE 13: APOG, BBOX, GGP, WAGE
Updated: 4/2/18
MONTHLY UPSIDE 13:
MONTHLY DOWNSIDE 13:
Euro
Stoxx 600 Universe:
DAILY UPSIDE 13: AKE FP, ASML NA, DRX LN, FABG SS, MRL SM, NCCB SS, UBI IM
DAILY DOWNSIDE 13: SMWH LN
DAILY UPSIDE WITH PRICE FLIP REVERSAL
DOWN: AMEAS FH, MHG NO, STL NO, TEN IM
DAILY DOWNSIDE WITH PRICE FLIP REVERSAL UP: CRH ID, DAI GR, EZJ LN, HEI GR, KN FP, RBI AV, SHBA
SS
Updated: 4/16/18
WEEKLY UPSIDE 13: KGX GR, SWMA SS, UBI FP
WEEKLY DOWNSIDE 13: HUSQB SS
Updated: 4/2/18
MONTHLY UPSIDE 13: ASSAB SS, BEZ LN
MONTHLY DOWNSIDE
13: CPI LN
|
|
|
Unsubscribe me from Hedge Fund Telemetry
Hedge Fund Telemetry LLC, P.O. Box 4675, Greenwich, CT 06861, United States
CONFIDENTIALITY NOTE and DISCLAIMER: This message is for the named person's use only. It may contain confidential, proprietary or legally privileged material. No confidentiality or privilege is waived by any accidental or unintentional transmission. If you receive this message in error, please immediately delete it and all copies of it from your system, destroy any hard copies and notify the sender. You must not, directly or indirectly, use, disclose,
distribute, print or copy any part of this message if you are not the intended recipient. Hedge Fund Telemetry LLC. cannot guarantee the confidentiality of the material transmitted; therefore, information of a sensitive or confidential nature should not be transmitted. There is risk in trading markets. Hedge Fund Telemetry LLC reports are based on information gathered from various sources and believed to be reliable, but are not guaranteed as to accuracy and completeness. The information is subject to change without notice and Hedge Fund Telemetry LLC has no obligation to provide any updates or changes. Hedge Fund Telemetry LLC is providing this data for informational and educational purposes and does not believe that it is sufficient to base an investment decision on. This information should not be regarded as a solicitation or recommendation of any particular security or to engage in any trading strategy. One should always check with your licensed financial
advisor to determine suitability of any investments.
|
|
|
|
|