If you are having difficulty seeing this email, you can view in your browser or click here to
print.
|
|
|
|
|
04/25/2024
Thomas Thornton
|
|
|
Checking up on recent sentiment and positioning
|
|
|
There has been a lot of mixed messages with regards to current sentiment and positioning in the past couple weeks. Many people tend to do drive by analysis on sentiment and see a low number on a random sentiment poll and declare bottoms. Some polls are better than others and some should be used on at key inflection points. The sentiment I use each day is the Daily Sentiment Index and I've taken the raw data over the year and charted it to get clear levels that I
can use for account positioning. Weekly polls have limitations as they take the temperature once a week and the data is usually disseminated days after thus diluting the effectiveness. Commitment of traders data is used to see large speculators and commercial hedgers positioning. Historically it's used to fade when speculators get too far bullish or bearish. It also has flaws with a once a week reading (Tuesday's) and dissemination on late Friday. What is important is that one of these alone does not give a full picture to make quality decisions. Below I run through several of the key markets with sentiment and positioning next to each others.
Friday's US, British, French strike on Syria went about as well as it could since there was no counter strikes or even Russian response worth noting. The markets are up today yet since the market did not fear a Friday strike with a sell off, the gains today are muted from what some of the bigger bulls
hoped for. As for the other two big recent catalysts China and Mueller, these are still unresolved with the Mueller investigation being a shorter term risk. Earnings are in full swing today with Bank of America reporting a better top and bottom line yet selling off 1% like JPM and others Friday. JB Hunt reported better earnings and is up 6.5%. What this says is expectations are high with financials and low in other sectors. NFLX reports tonight and will be watched closely as a tell for 'tech' earnings. NFLX has an implied move of 9.23% and typically moves 13.34% after earnings. I have no interest in being involved in the stock with earning as there is little edge guessing the direction especially with the type of volatility seen in the past.
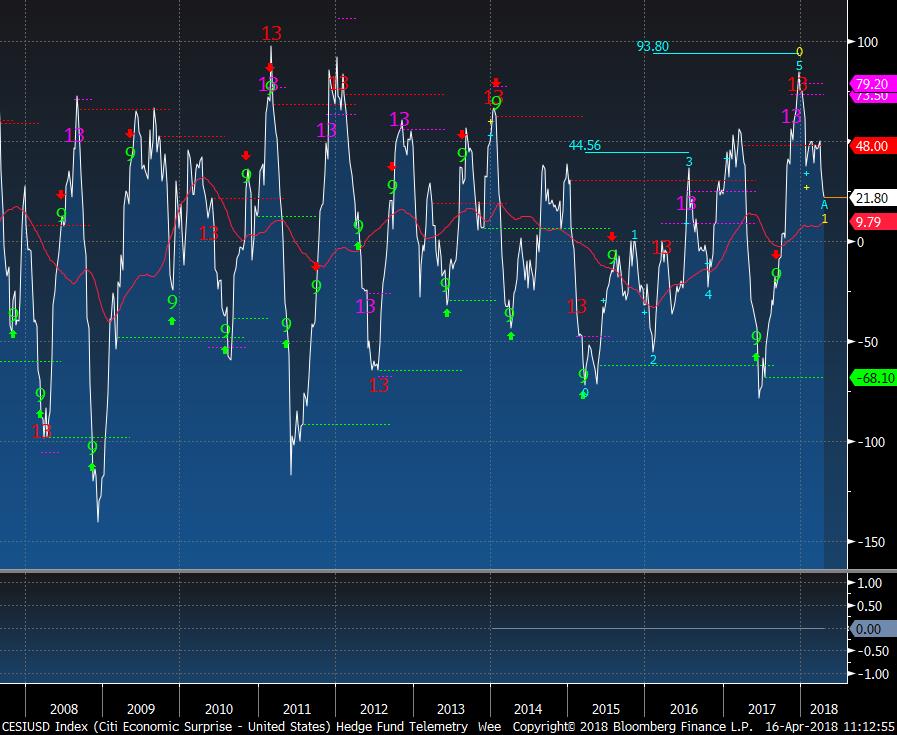
The Citi Economic Surprise Index is a measure of economic reports beating analyst expectations and I run through the recent charts with several countries and regions below. In December the consensus
was that the good economic reports would propel the equity markets and today since some of the strong economic activity has moderated it's shifted to strong earnings will propel equity markets. Could the expectations for equities be too high? Seems possible.
Notable:
- US Markets - Sentiment remains muted but not near extremes on downside while positioning with S&P futures remains setup bullish
- Hedge Fund Telemetry Trade Ideas - Adding CLX and PG on long side
- European Market - Consolidation continues
- Currencies - USD, Euro, Pound Sterling.
- Citi Economic Surprise Index - I don't believe these are at lows yet
- Gold Update
- Tesla Update
- Cannabis Index - Constructive action but two wave patterns at play
- Bond Update
- DeMark Screens - Daily, Weekly, Monthly upside/downside exhaustion signals within the S&P 1500 and Euro Stoxx 600
|
|
|
|
|
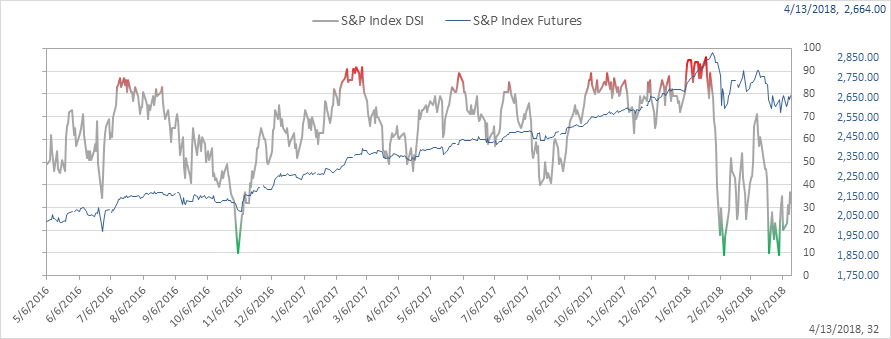
SPX bullish sentiment is at 32% down from 37% the previous day
Here's a link to the Hedge Fund Telemetry market sentiment page with 40 charts of sentiment including equities, bonds, currencies, and commodities updated each day.
|
|
|
|
|
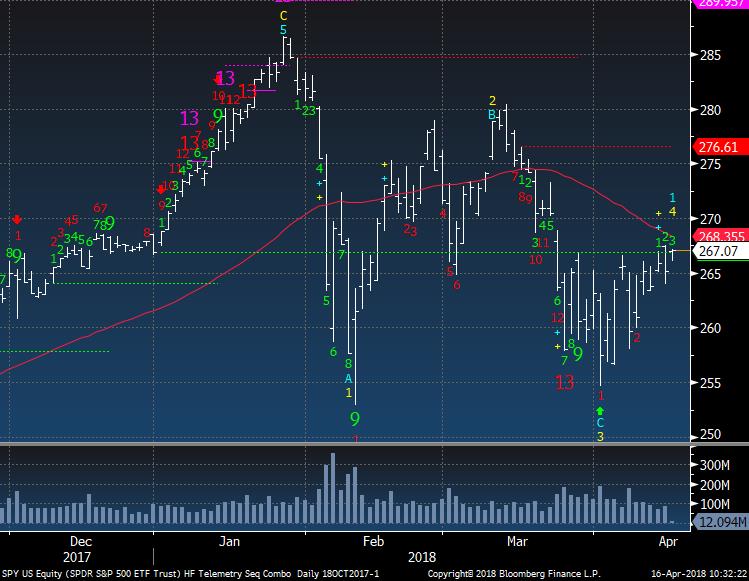
SPY is stalling at the down slopping 50 day. A break of 265 will likely get sellers involved.
|
|
|
|
|
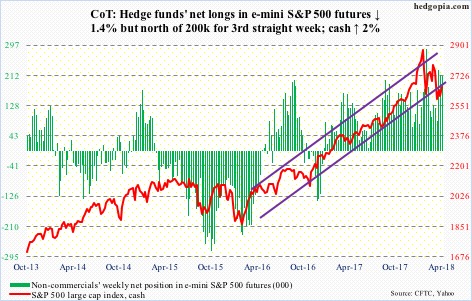
COT speculators continue to set up very bullish
|
|
|
|
|
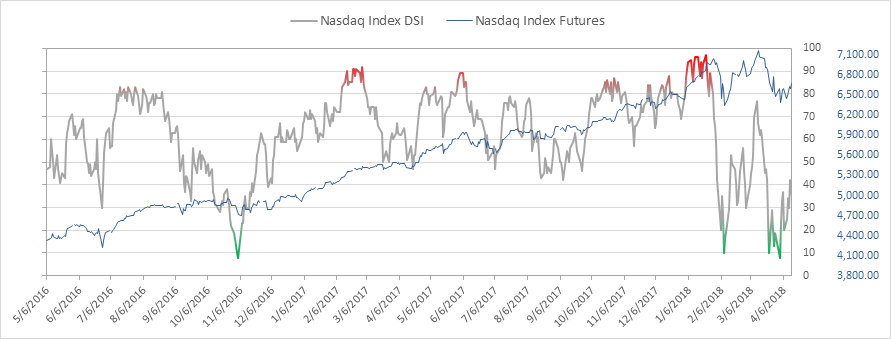
Nasdaq bullish sentiment is at 36% down from 42% the previous day
|
|
|
|
|
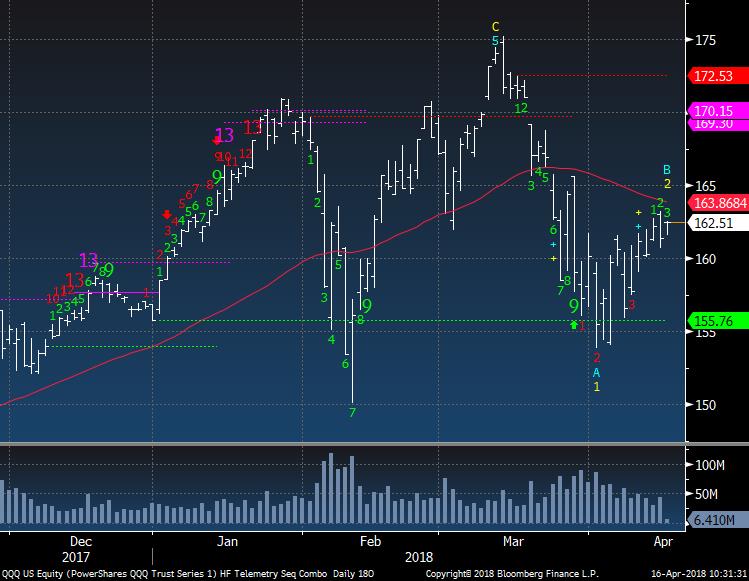
QQQ also is stuck below the 50 day. 160 is likely where sellers get active.
|
|
|
|
|
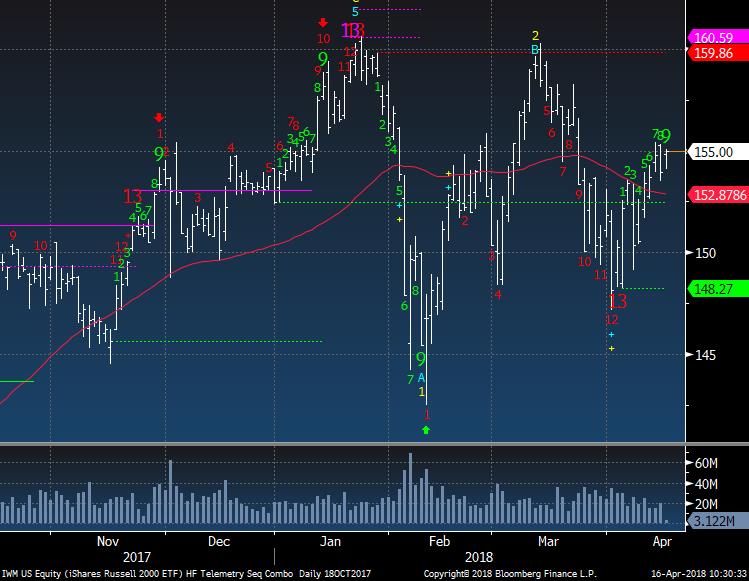
IWM Russell 2000 ETF has an upside green Setup 9 today. There should be a reaction lower or some stalling ahead.
|
|
|
|
|
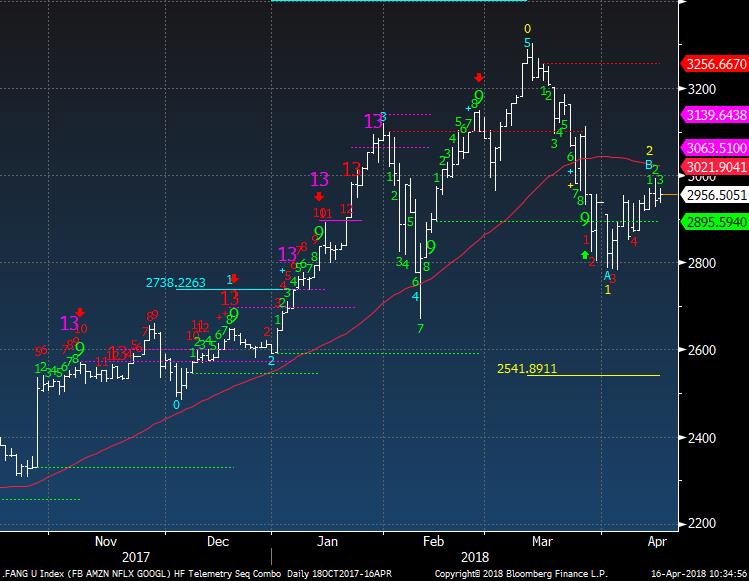
FANG - FB, AMZN, NFLX, GOOGL custom index shows a very tepid bounce below the 50 day. There is a downside Wave 3 price objective of 2541.
|
|
|
|
|
|
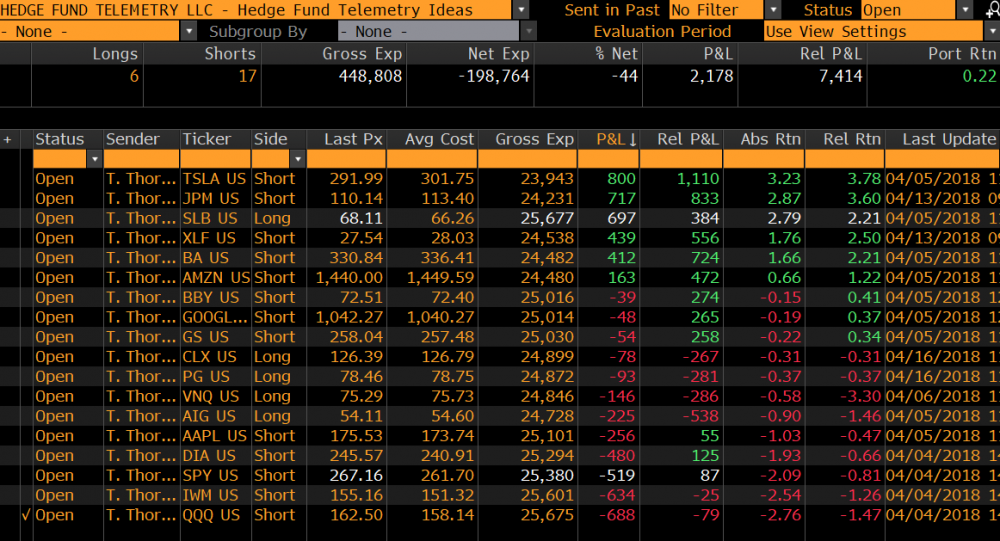
|
Hedge Fund Telemetry Trade Ideas
|
|
|
Trade Ideas - adding some defensive long exposure with CLX and PG. Thoughts below
|
|
|
|
|
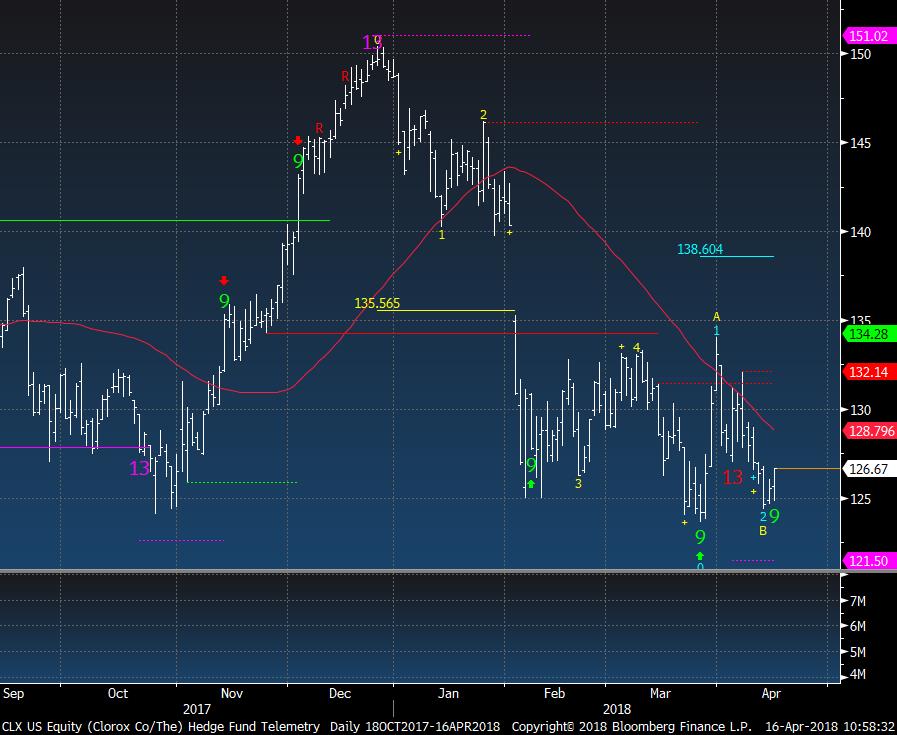
CLX Clorox is a new long idea today. It recently moved down through 5 waves lower and now potentially made a new 2/B upside wave low with an upside wave 3 price objective of 138.60. Breaking the recent lows would jeopardize the pattern and if that happens I will reevaluation this long
|
|
|
|
|
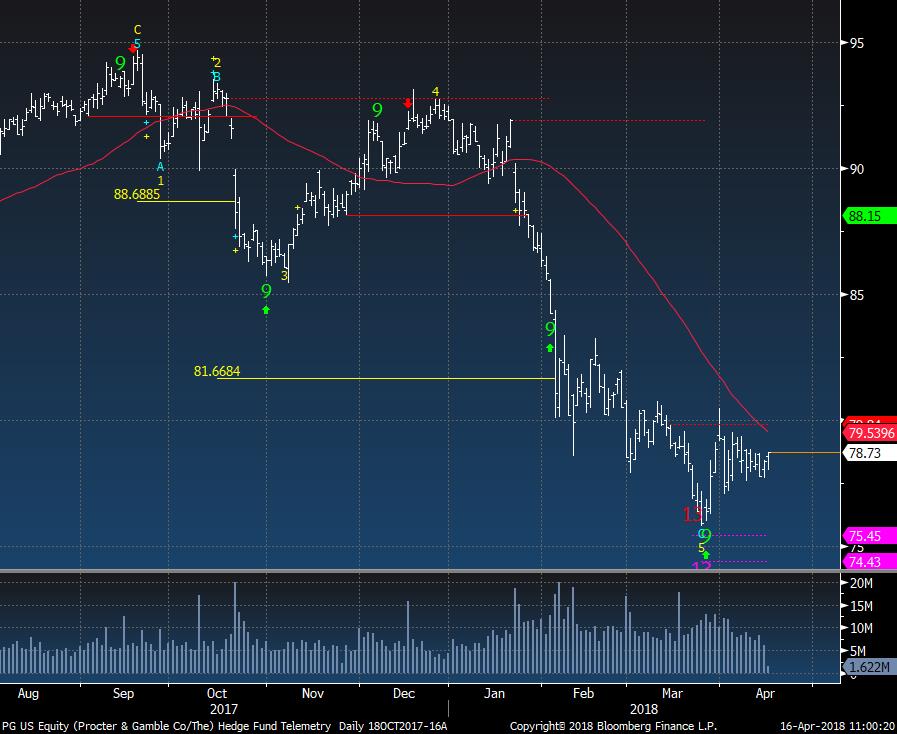
PG Procter and Gamble also made a wave 5 low with both the red Sequential and pink Combo downside exhaustions together. It's just now trying to stabilize with a downside slopping 50 day nearing. I like the company for the defensive aspect in the current market environment.
|
|
|
|
|
|
|
|
|
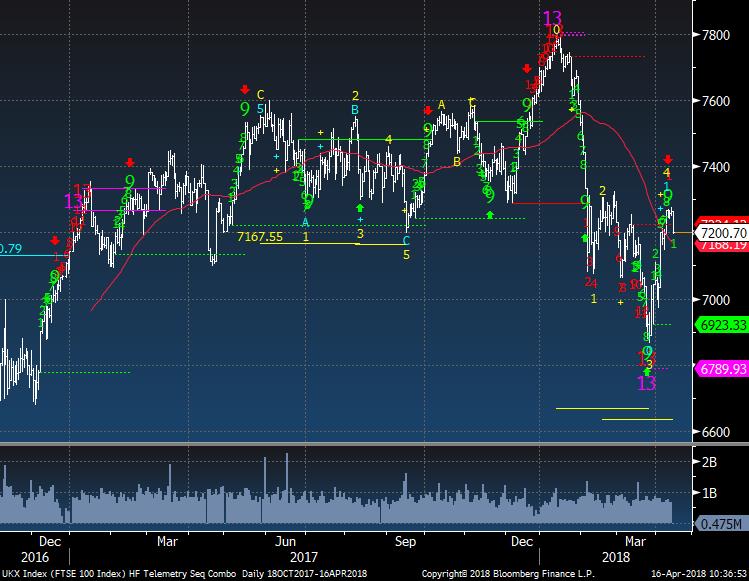
UK FTSE 100 has reversed after last week's upside green Setup 9. Some consolidation is likely or further deeper downside is possible.
|
|
|
|
|
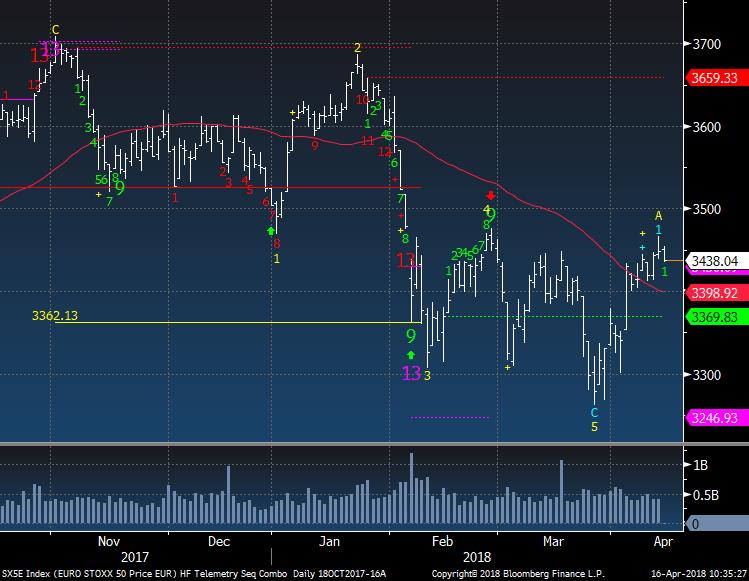
SX5E Euro Stoxx 50 is starting to consolidate too.
|
|
|
|
|
|
|
|
|
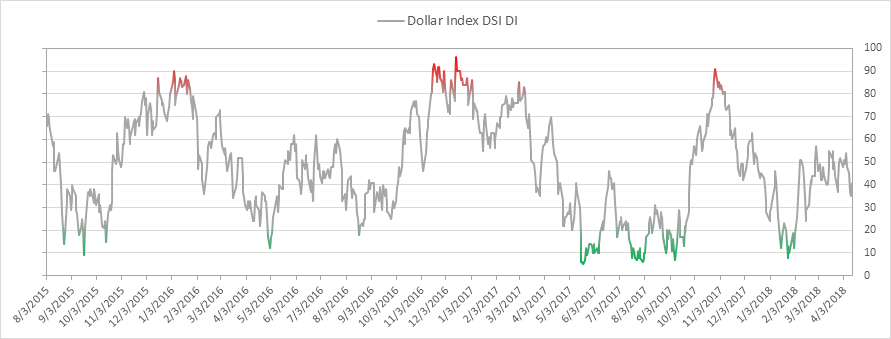
US Dollar bullish sentiment is at 41%
|
|
|
|
|
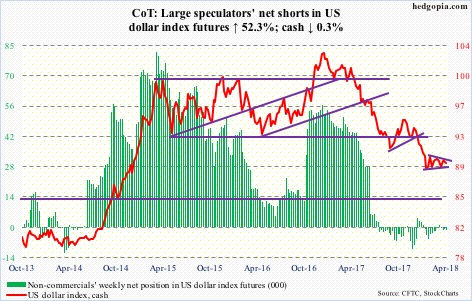
COT Speculators with the USD still shows small net short positioning or generally neutral
|
|
|
|
|
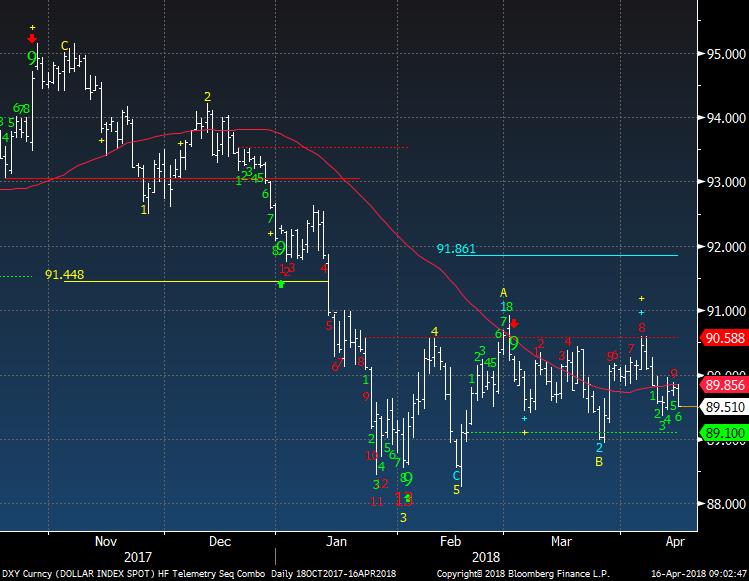
DXY US Dollar Index continues in the sideways range. There is a red upside Countdown on day 9 of 13 and a green Setup on day 6 of 9. I'll be commenting on this in the coming days.
|
|
|
|
|
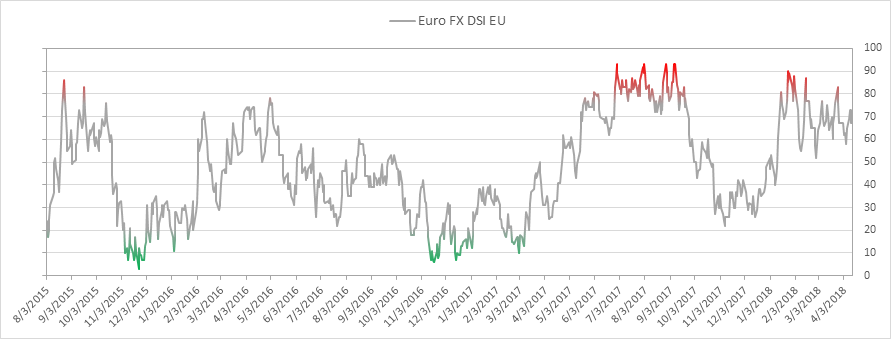
Euro bullish sentiment is at 67% and remains bid albeit in a range above 60%
|
|
|
|
|
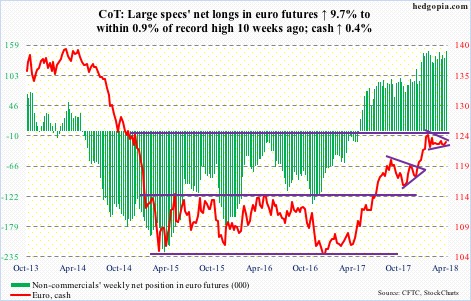
COT Speculators with the Euro remain set up very very bullish. This has been something many people have been watching but it's better to let changes in this positioning start to change rather than take a contrary position.
|
|
|
|
|
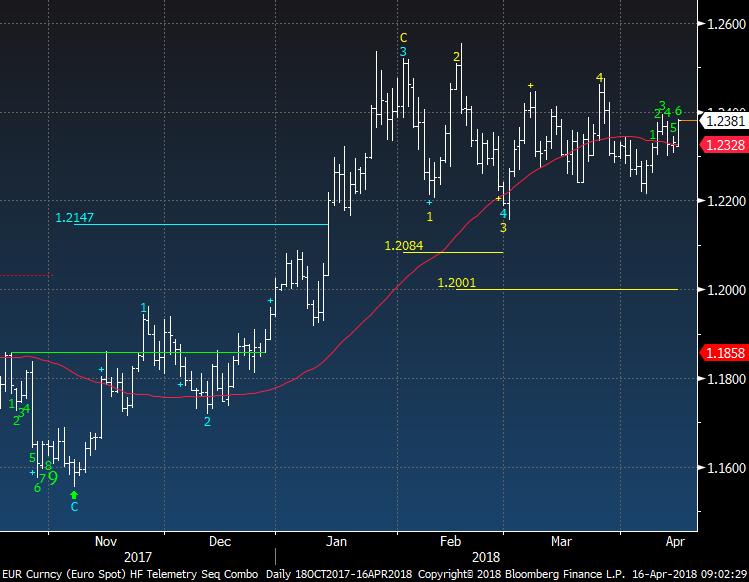
Euro like the USD has been in a tight range since January. Quite unusual considering the action seen in the equity markets.
|
|
|
|
|
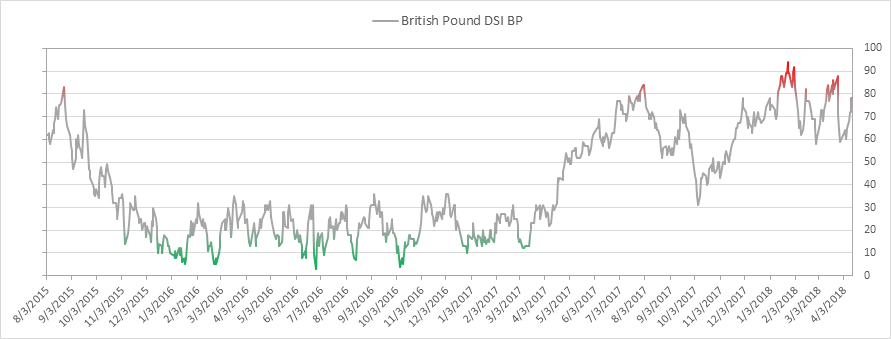
British Pound bullish sentiment is at 78% and should be into the 80% tonight and that's extreme
|
|
|
|
|
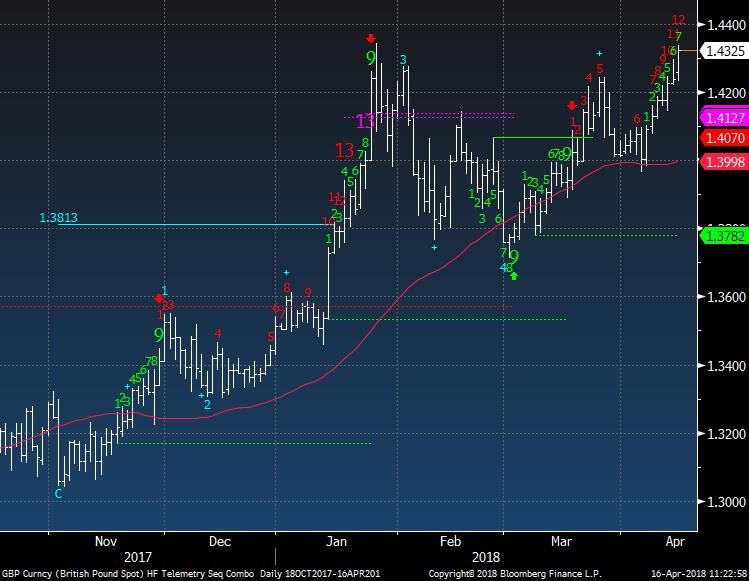
Pound Sterling is on day 12 of 13 with its upside red Countdown and 7 of 9 with its green Setup count. The key support has been the 50 day at 1.40
|
|
|
|
|
|
|
Citi Economic Surprise Indexes
|
|
|
The US index shows a top in expectations in December with the upside Countdown exhaustion signals (I use weekly for all of these charts as they seem to capture the full move)
|
|
|
|
|
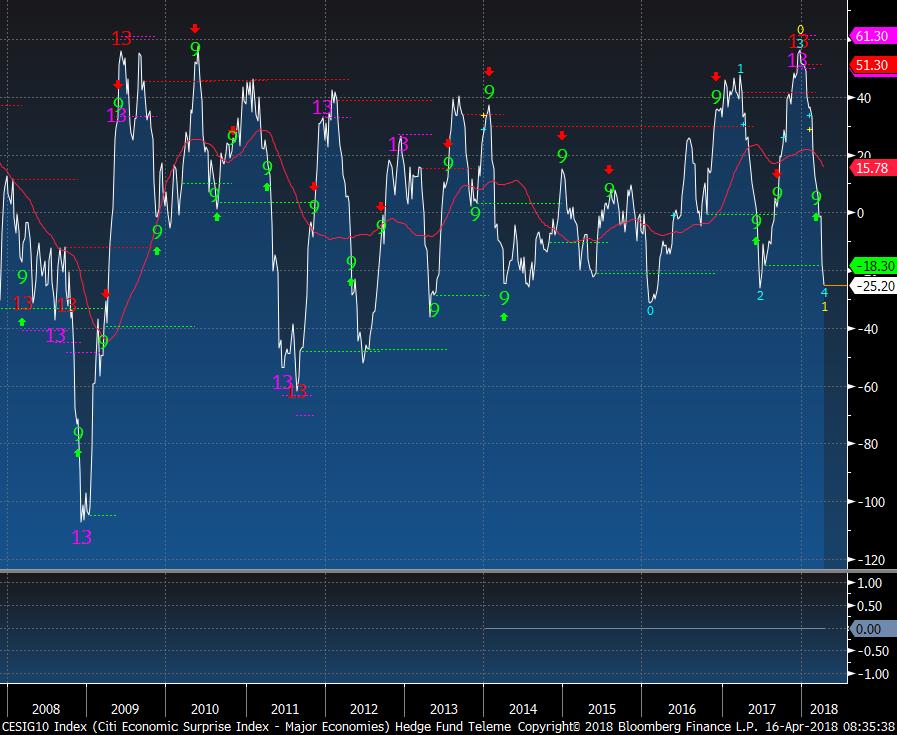
G10 also had upside exhaustion in December and now is at important support.
|
|
|
|
|
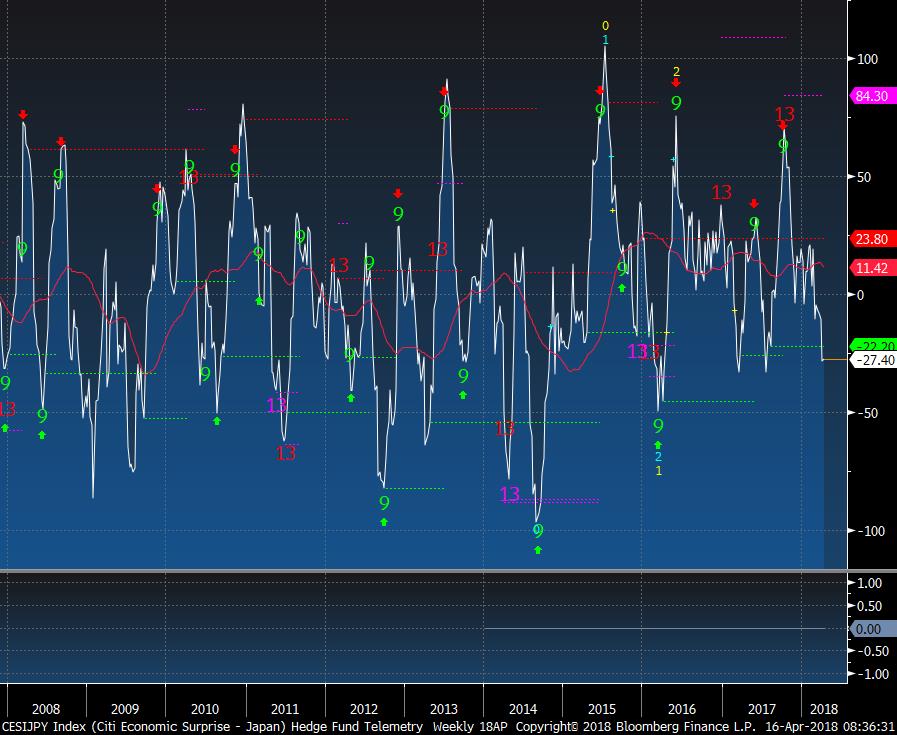
Japan also topped in December and is at the lows from the past 2 years. It's now negative and as you see can go lower
|
|
|
|
|
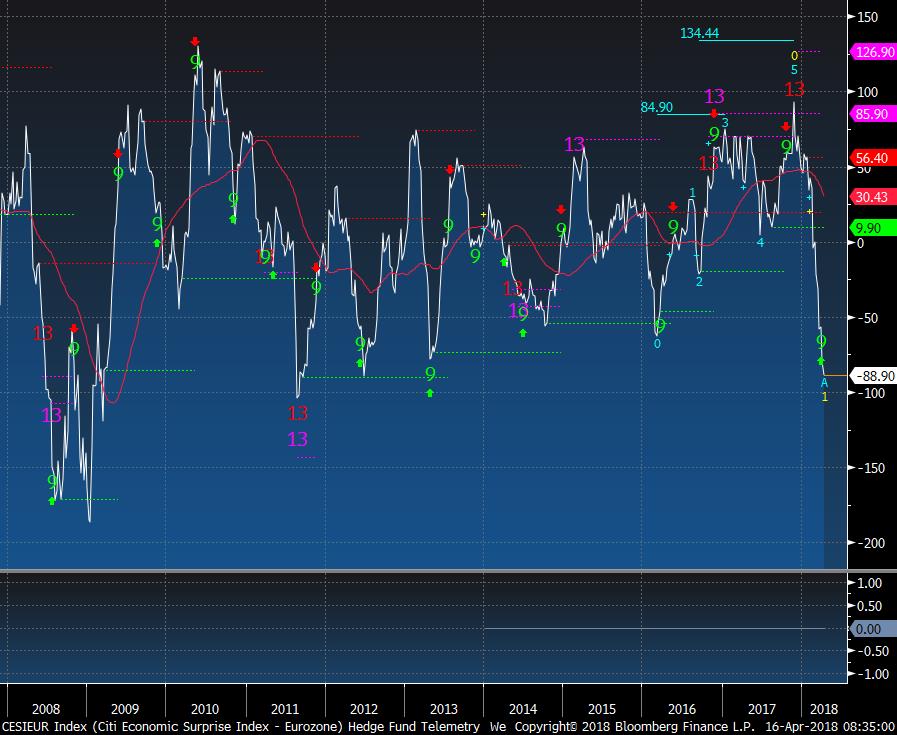
Eurozone topped in December and has moved lower in an extreme way. It's making multi year lows too.
|
|
|
|
|
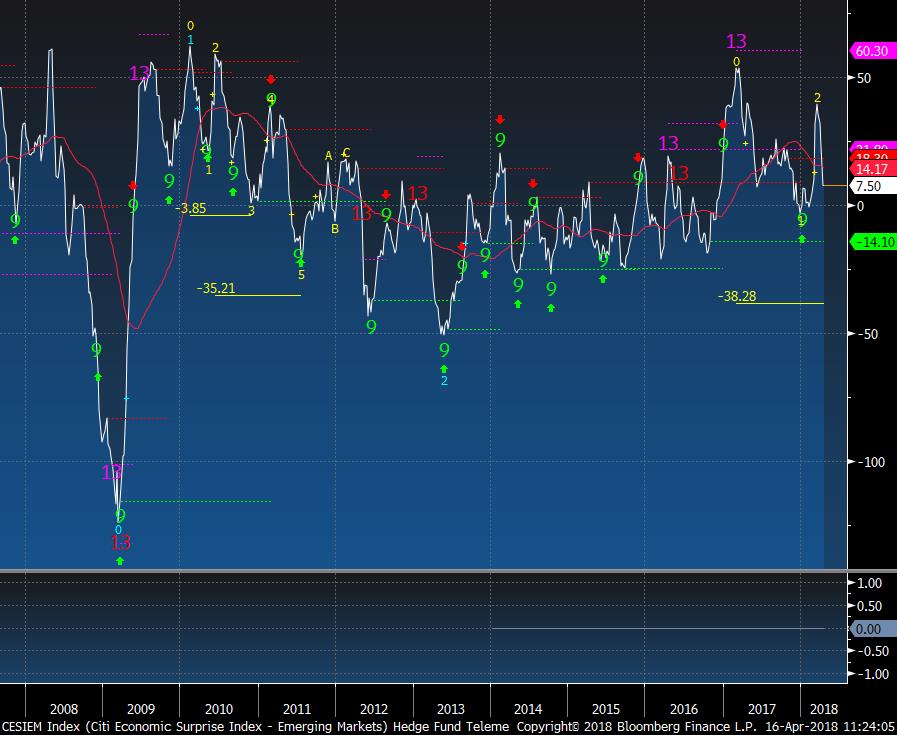
Emerging markets top in late 2016 and made a lower high in late 2017. It's at risk of moving below the 2017 levels
|
|
|
|
|
|
|
|
|
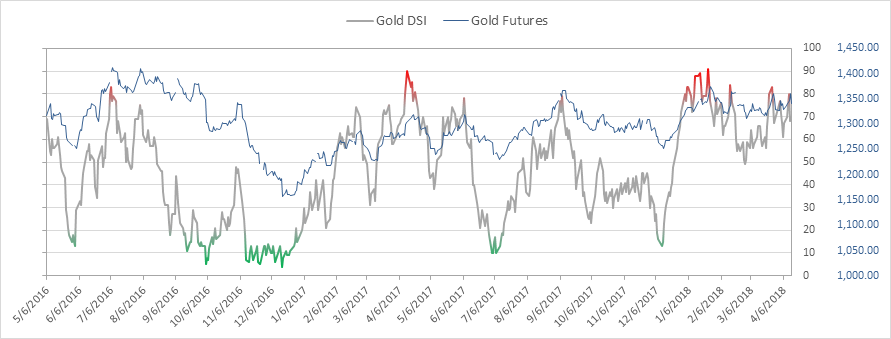
Gold bullish sentiment is at 70% and has stayed bid despite the choppy action in the futures
|
|
|
|
|
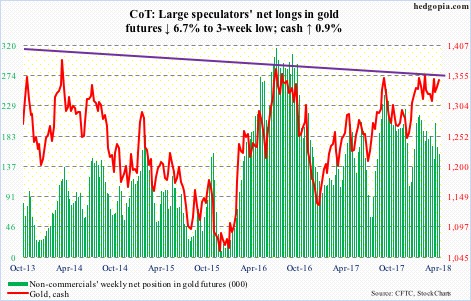
COT Gold speculators have moderated their bullish stance but still remain firmly net long
|
|
|
|
|
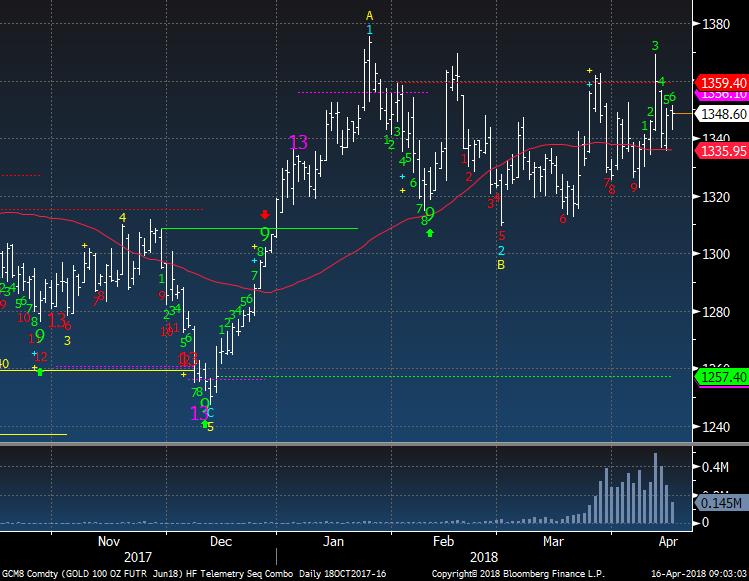
Gold Futures continue in a sideways pattern. There are some mixed DeMark signals here. I could get interested on the long side if the breakout ever occurs.
|
|
|
|
|
|
|
|
|
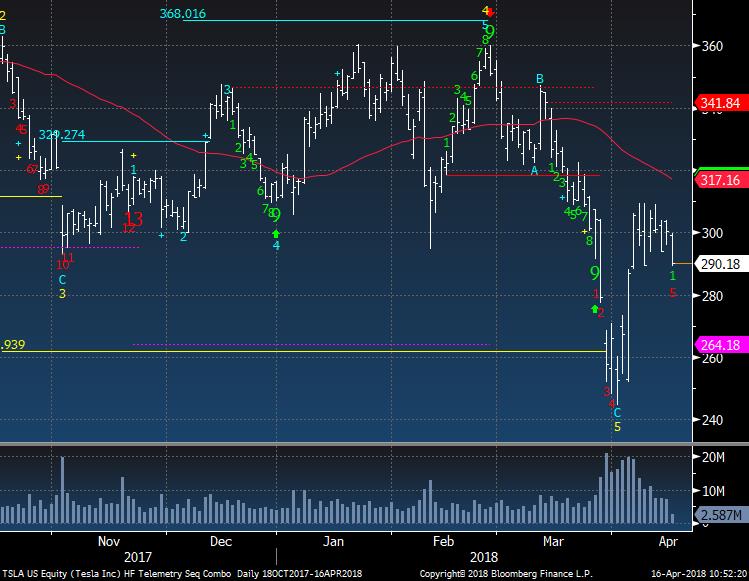
My favorite short has fallen again today and has a VWAP from the April 2nd lows of 285. Breaking that support would be trouble. The downside red Countdown is now on day 5 of 13.
|
|
|
|
|
|
|
|
|
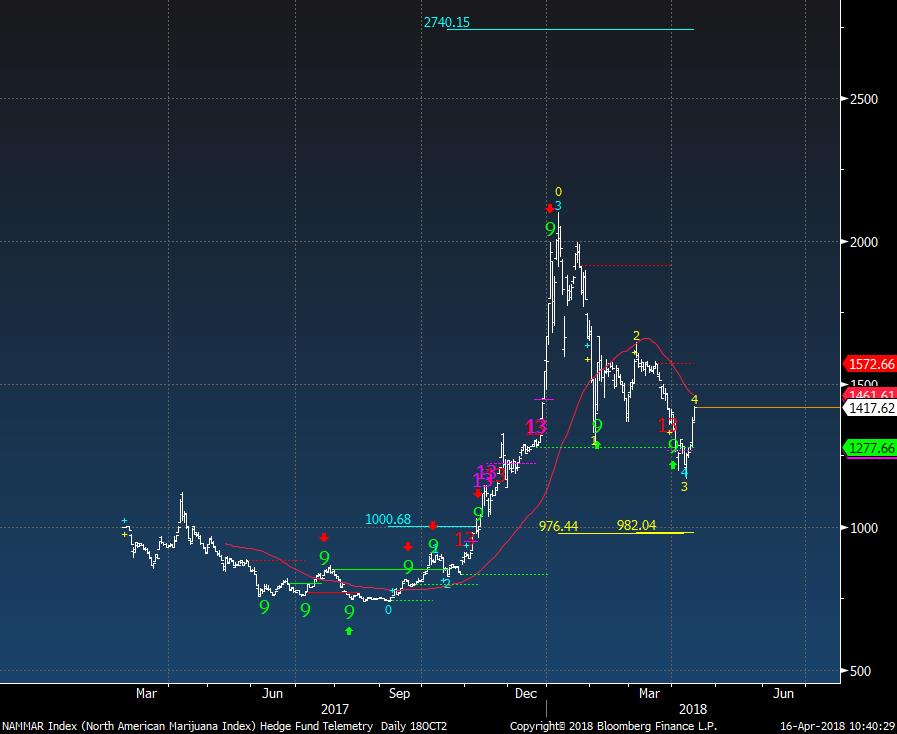
This is the North American Marijuana Index and I see two wave patterns at play currently. The upside wave just put in a wave 4 with a wave 5 upside price objective of 2740. There is a downside wave count on wave 4 of 5 with a downside wave 5 price objective of 982. If this can continue to move above the 2nd wave down (yellow 2) then the odds for the upside increase.
|
|
|
|
|
|
|
|
|
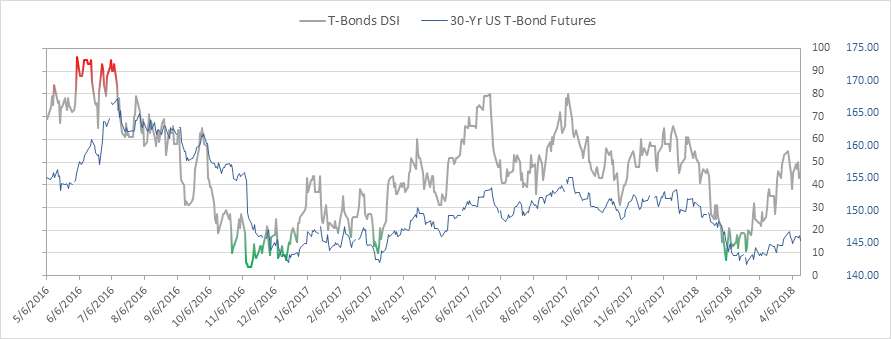
Bond bullish sentiment is at 45%. Bonds are selling off today and I will be interested to see how far it drops
|
|
|
|
|
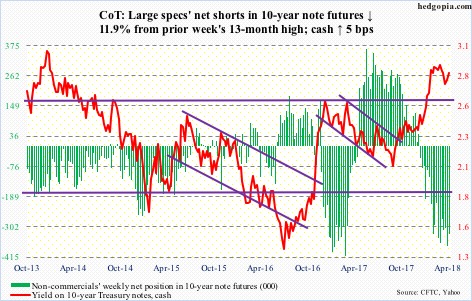
COT 10 year futures speculator positioning remains set up bearish and short.
|
|
|
|
|
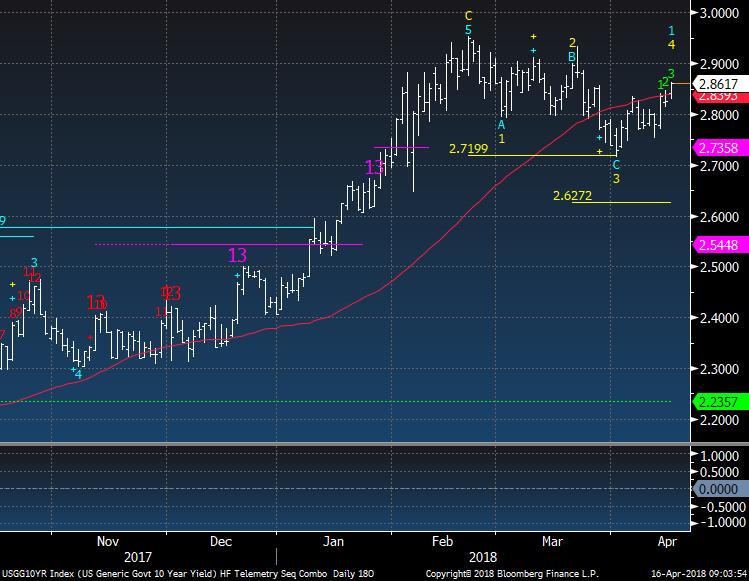
The US 10 year yield either is in a wave 4 of 5 on a downside count or this is the 1st of 5 with an upside move. I'm really neutral with this type of action however my guess is the lower level is likely with a risk off event and then higher.
|
|
|
|
|
|
|
DEMARK SCREENS - Daily, Weekly, Monthly Upside/Downside Exhaustion Signals
|
|
|
Daily/Weekly DeMark upside/downside exhaustion signals (Sequential) Weekly updated on Monday's. Price flips occur when a stock closes higher/lower than four previous closes.
S&P 1500 Universe:
DAILY UPSIDE 13: AEO, CRY, KEX, RHT
DAILY DOWNSIDE 13: CMG, CNP, IRBT, SCG, SEIC, SSP, TPX, UVV
DAILY UPSIDE WITH PRICE FLIP REVERSAL DOWN: NONE
DAILY DOWNSIDE WITH PRICE FLIP REVERSAL UP: GOV, JAKK, PRA, SIGM
Updated: 4/16/18
WEEKLY UPSIDE 13: ANF, CHRW, DECK, ELY, IO, KORS, LLL, STE, TYL
WEEKLY DOWNSIDE 13: APOG, BBOX, GGP, WAGE
Updated: 4/2/18
MONTHLY UPSIDE 13:
MONTHLY DOWNSIDE 13:
Euro Stoxx 600 Universe:
DAILY UPSIDE 13: AMEAS FH, BKG LN, HELN SW, RMS FP, RRTL GR, SRT3 GR
DAILY DOWNSIDE 13: NONE
DAILY UPSIDE WITH PRICE FLIP REVERSAL DOWN: EKTAB SS
DAILY DOWNSIDE WITH PRICE FLIP REVERSAL UP: NONE
Updated: 4/16/18
WEEKLY UPSIDE 13: KGX GR, SWMA SS, UBI FP
WEEKLY DOWNSIDE 13: HUSQB SS
Updated: 4/2/18
MONTHLY UPSIDE 13: ASSAB SS, BEZ LN
MONTHLY DOWNSIDE 13: CPI LN
|
|
|
Unsubscribe me from Hedge Fund Telemetry
Hedge Fund Telemetry LLC, P.O. Box 4675, Greenwich, CT 06861, United States
CONFIDENTIALITY NOTE and DISCLAIMER: This message is for the named person's use only. It may contain confidential, proprietary or legally privileged material. No confidentiality or privilege is waived by any accidental or unintentional transmission. If you receive this message in error, please immediately delete it and all copies of it from your system, destroy any hard copies and notify the sender. You must not, directly or indirectly, use, disclose,
distribute, print or copy any part of this message if you are not the intended recipient. Hedge Fund Telemetry LLC. cannot guarantee the confidentiality of the material transmitted; therefore, information of a sensitive or confidential nature should not be transmitted. There is risk in trading markets. Hedge Fund Telemetry LLC reports are based on information gathered from various sources and believed to be reliable, but are not guaranteed as to accuracy and completeness. The information is subject to change without notice and Hedge Fund Telemetry LLC has no obligation to provide any updates or changes. Hedge Fund Telemetry LLC is providing this data for informational and educational purposes and does not believe that it is sufficient to base an investment decision on. This information should not be regarded as a solicitation or recommendation of any particular security or to engage in any trading strategy. One should always check with your licensed financial
advisor to determine suitability of any investments.
|
|
|
|
|