|
|
|
|
|
|
|
|
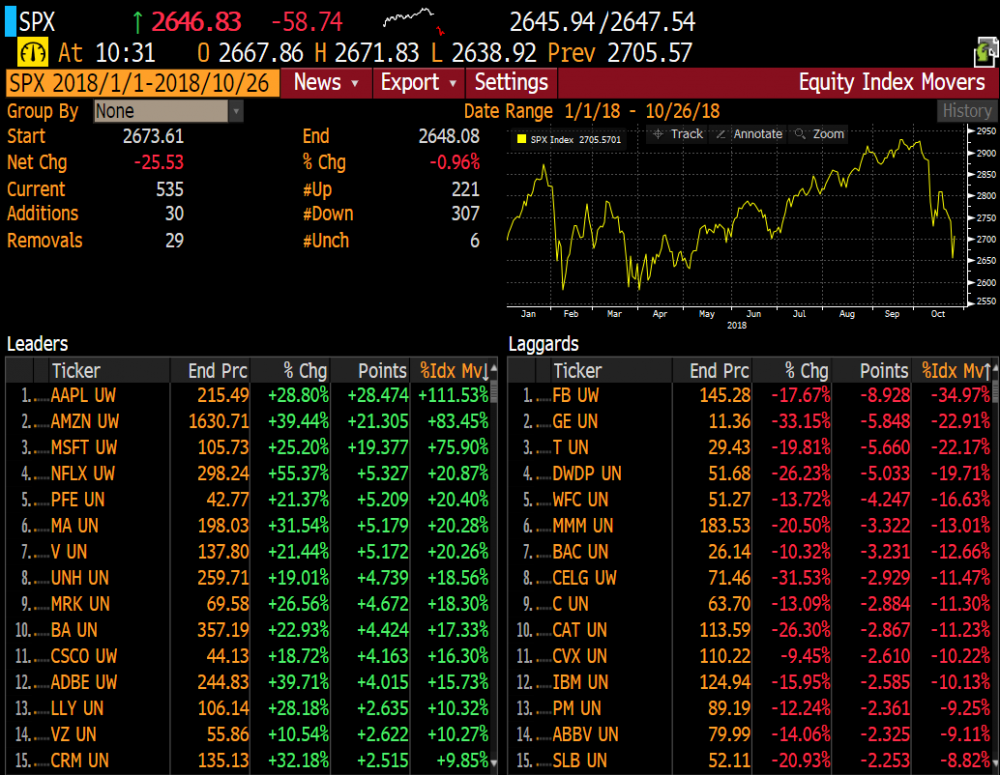
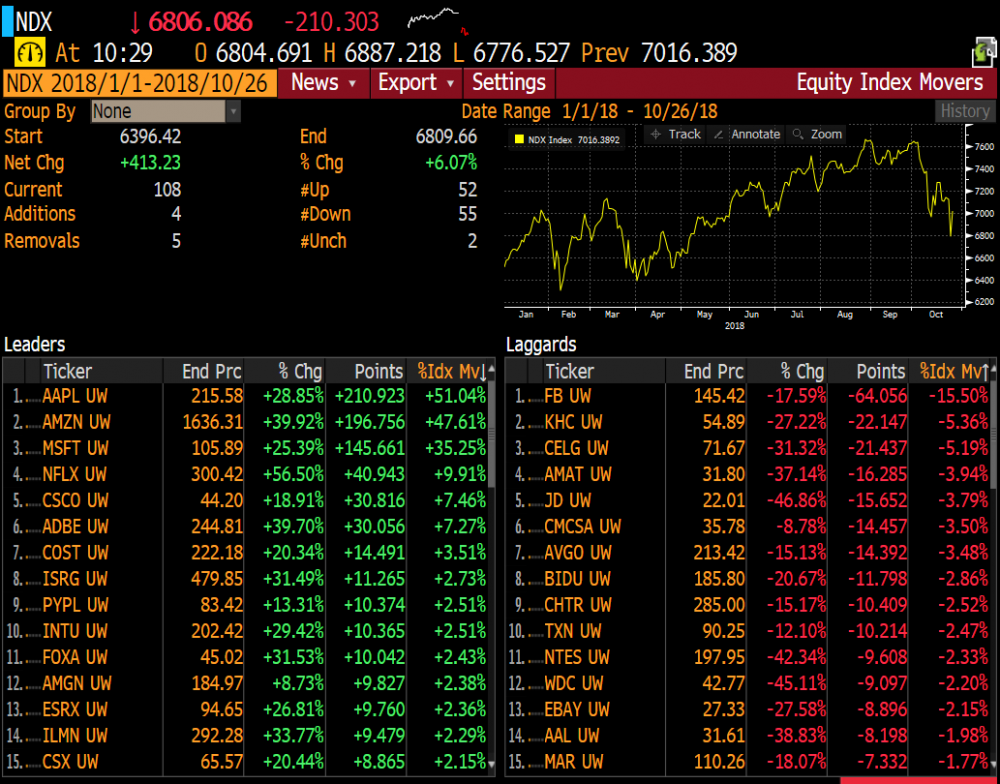
Two of the mega cap Nasdaq 100 stocks reported last night and one really missed (Amazon) and one was just OK (Alphabet). Amazon has been the largest attribute in the Nasdaq 100 year to date as well from the last good low back in February 2016. Since the lows in 2009, the Nasdaq 100 has been led by five stocks Apple, Amazon, Microsoft, Facebook and Alphabet attributing to 50% of the total gain. The one big difference this year is how much Amazon has over attributed vs historical
ranges. Back in October 2007, Apple attributed 23% of the YTD gain and then I was quite concerned (ranting) about it within my hedge fund. Amazon reached 30% of the YTD attribution this year. Short interest has been very low, it's a crowded long so when then missed on several metrics (mentioned on yesterday's note) last night the out sized drop was no surprise. A month ago Morgan Stanley put out a great note warning of a top in data center spending and that told me the growth in tech (cloud) was topping. The custom index I created with all of their names has now given back the entire YTD gains in a month! The fact is that there is a lot of cloud capacity out there now with Amazon and Microsoft as the two clear leaders (MSFT missed slightly on Azure btw too). Semi names like AMD and Nvdia, disk drives like Western Digital and Seagate are all getting crushed due to this top in data center spending. I believe Amazon trade sideways to down for years to come unless they move into a new business space that produces earnings.
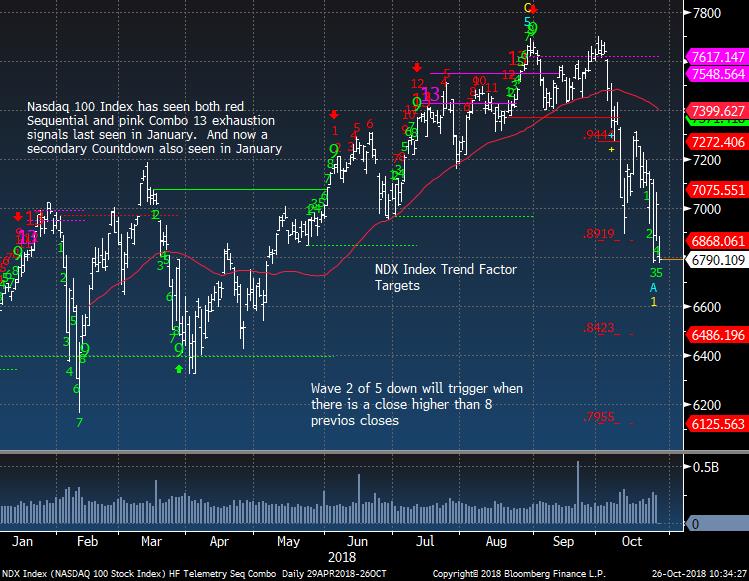
I've had a lot of people ask "Where is the bottom?" or what levels would I buy. As you know, I started buying a few days ago covering quite a bit, raising cash and flattening exposure believing a lower high bounce would develop soon. The steepness of the drop and the continued downside DeMark Countdowns have not given me confidence to send an all clear. Furthermore, this first down move is wave one of five on the downside. Can you exploit some upside moves? Yes, but let's wait to see Apple earnings next week. My view is that people have been too quick to want to buy as seen yesterday and by the bounce intraday today. This has been too orderly without panic
and absent of capitulation.
Have a great weekend and thank you for all your support. And as a reminder, trials will end soon and if you want to soothe my pain of being an LA Dodger fan who has to go to Boston this weekend, you can sign up as a client to Hedge Fund Telemetry today
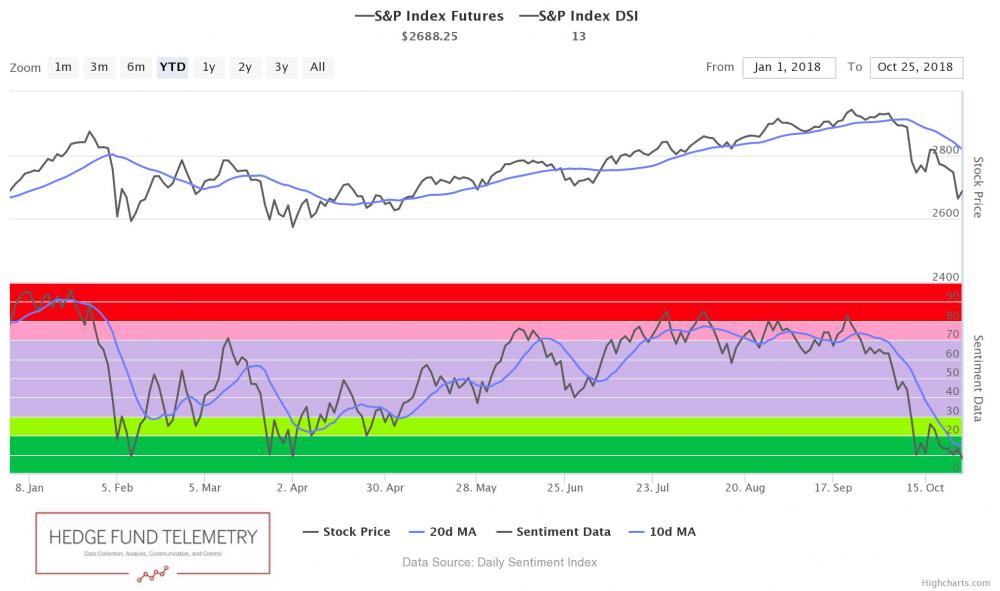
- US Markets - Sentiment remains low, some oversold conditions are present. Attribution remains narrow. Everything has been in first down wave of five so a lower high bounce is expected
- Hedge Fund Telemetry Trade Ideas - TSLA stopped out at 325 +11.66% gain
- US Total Market and World Ex US ETF's Update
- Amazon - When Good Stocks Go Bad
- Credit Spreads Update
- US Total Market Cap Index -
Downside DeMark exhaustion signal
- PPO Monitor - Percentage Price Oscillator Force Ranked Sector Rotation - Good look at intraday reversal
- Bloomberg Technical Pattern Recognition Screen
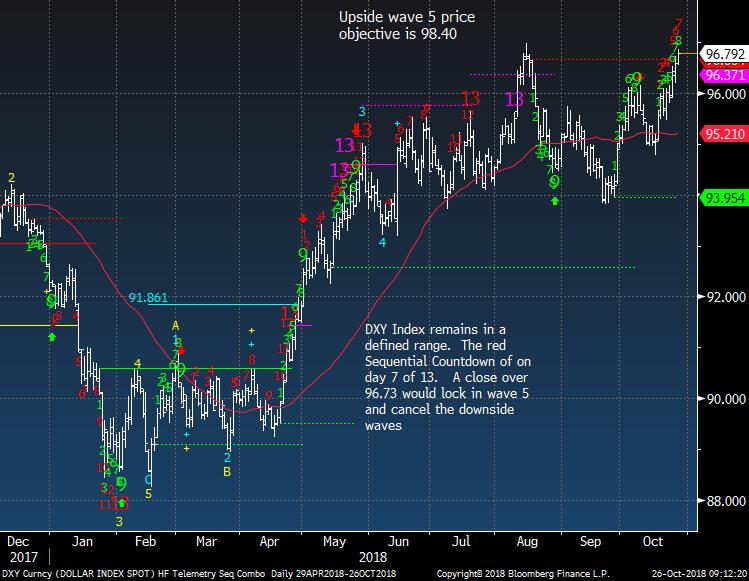
- Currency Update - Still expect higher USD
- European Market
Update - New lows but bounced off lows. UK is near downside exhaustion
- Asian Market Update - Still looks risky in Japan, India, and especially Korea
- Crude Update - Holding support for now
- Gold Update - Slightly up today
- Bond Update - New lows in yields today as expected
- DeMark Screens - Daily, Weekly, Monthly upside/downside exhaustion signals within the S&P 500 and Euro Stoxx 600
- Sold today's QQQ expiration puts added yesterday for a nice gain and holding the others through next week at least.
|
|
|
|
|
Here's a link to the Hedge Fund Telemetry market sentiment page with 40 charts of sentiment including equities, bonds, currencies, and commodities updated each day. When the new website launches we will be adding new charts and historical sentiment data for Euro Stoxx 50, UK FTSE 100, German DAX, French Cac 40. We will be adding Japanese Bonds, German Bunds, and a few more.
SPX bullish sentiment is at 13%
|
|
|
|
|
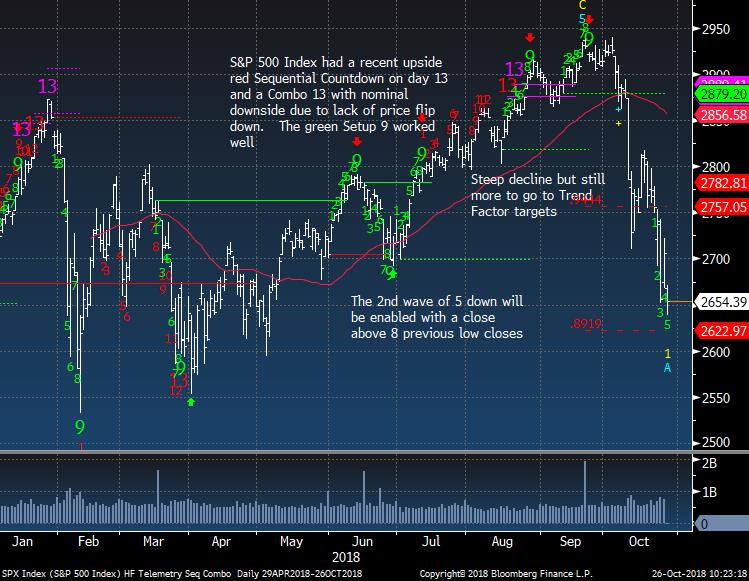
SPX daily very steep and nearing downside Trend Factor target that also retraced the same amount in February
|
|
|
|
|
SPX YTD attribution shows the top 3 stocks AAPL, AMZN, MSFT still have done the majority of the work.
|
|
|
|
|
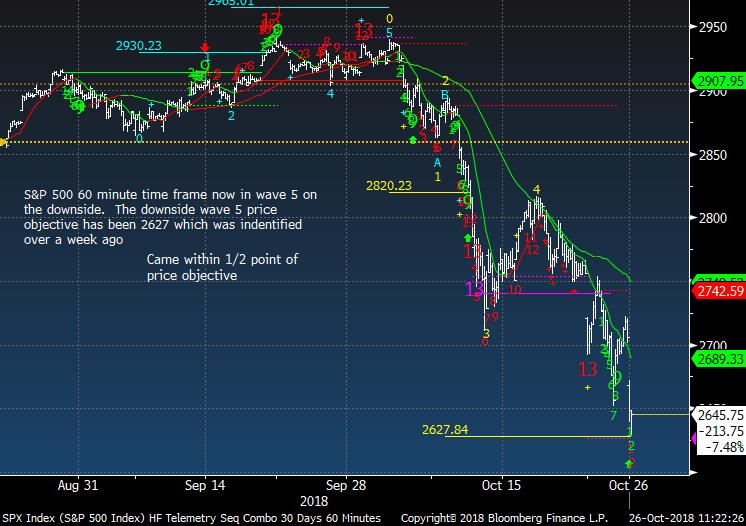
SPX 60 minute tactical time frame reached the downside wave 5 target
|
|
|
|
|
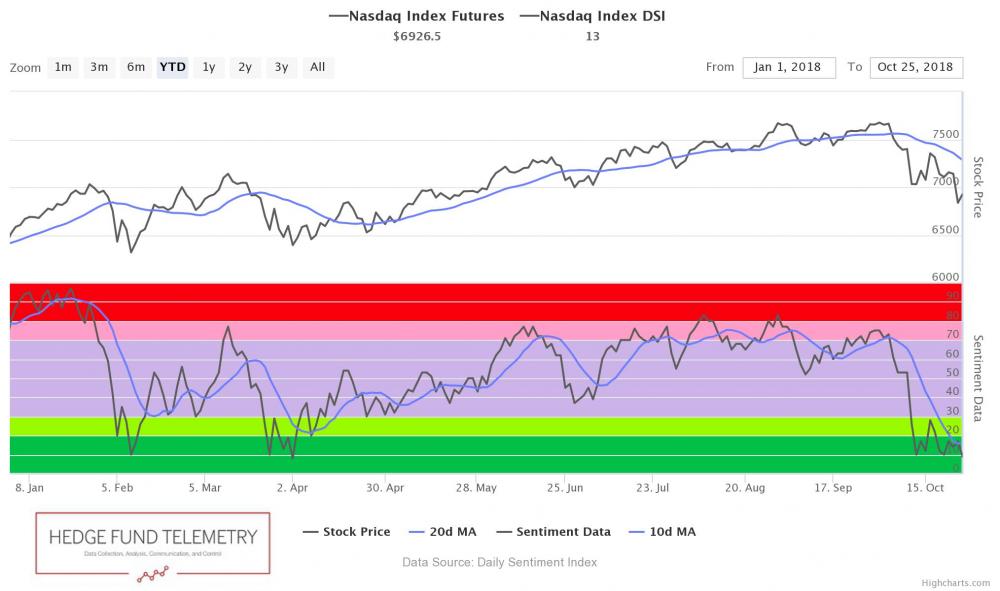
Nasdaq bullish sentiment is at 13%
|
|
|
|
|
NDX Index has been much worse than SPX
|
|
|
|
|
The NDX also shows the same three but an even more out sized attribution concentration
|
|
|
|
|
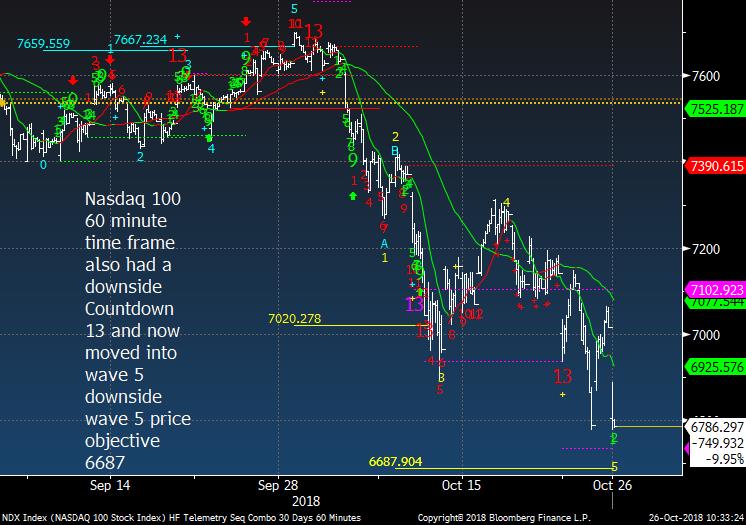
NDX 60 minute tactical time frame bounced intraday after I grabbed this chart
|
|
|
|
|
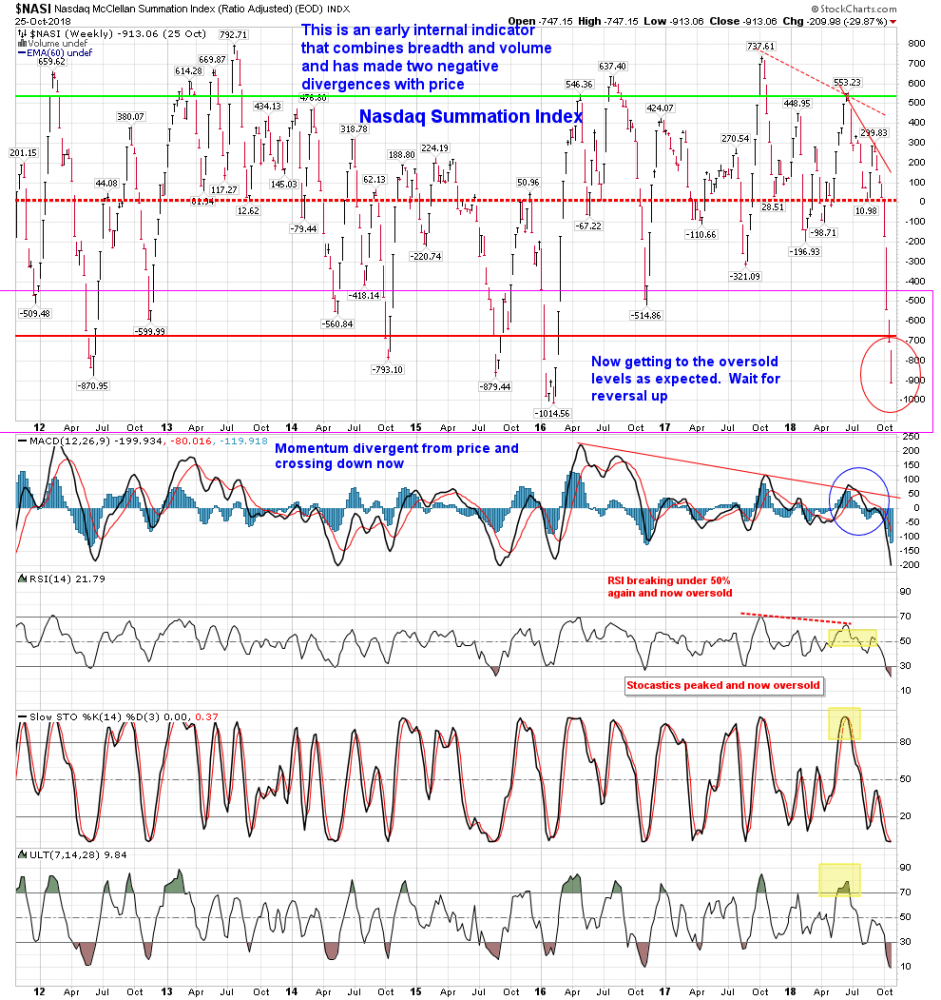
Nasdaq Summation Index has been going down for weeks while most people had no clue but we did!! Now it's oversold so lets see if next week it can bounce
|
|
|
|
|
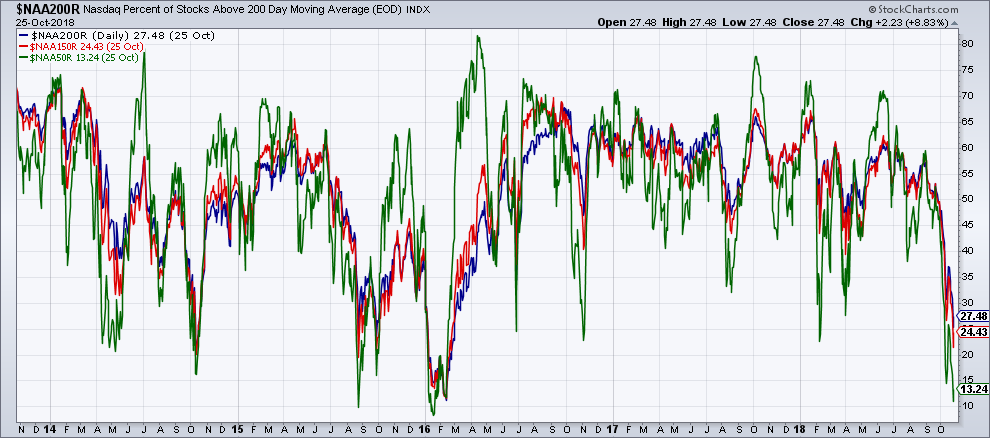
Nasdaq % of stocks above the 50, 150 and 200 day is pretty oversold. I could see a 2015/2016 bounce then drop back lower
|
|
|
|
|
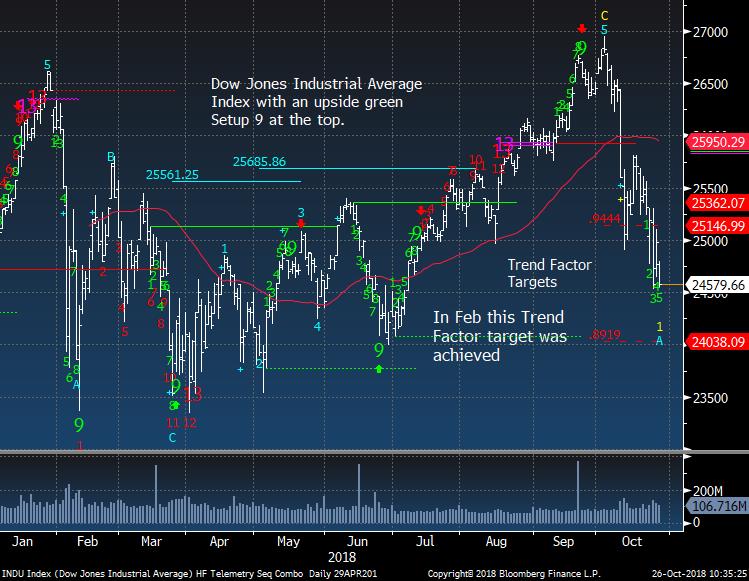
Dow Jones Industrial Average
|
|
|
|
|
IWM Russell 2000 has a Combo 13 today and could bounce
|
|
|
|
|
|
|
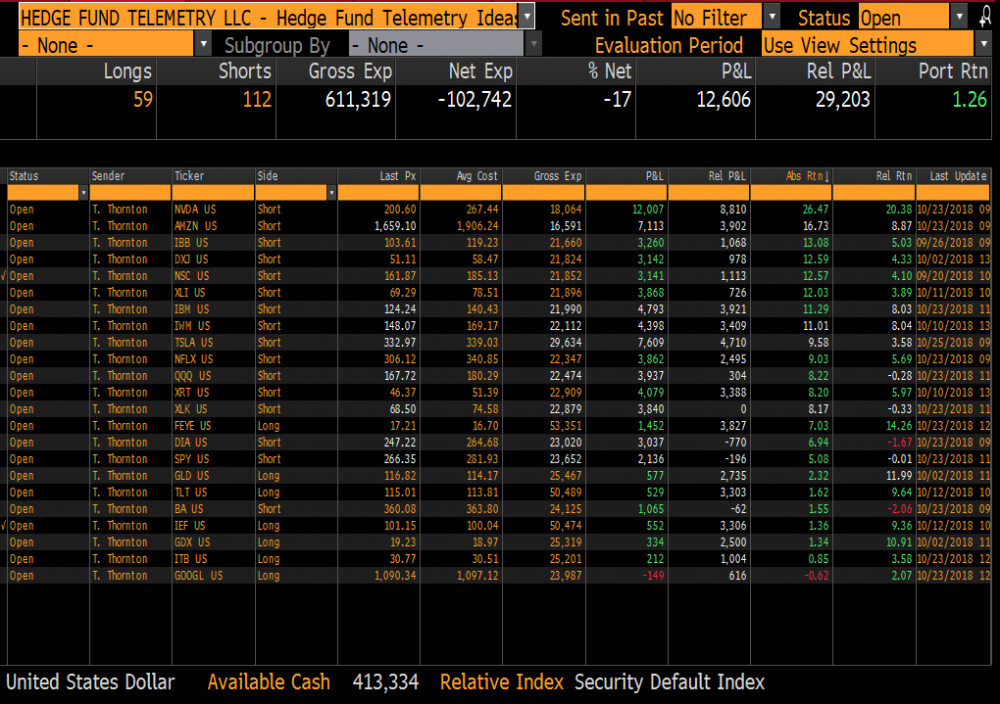
Hedge Fund Telemetry Trade Ideas
|
|
|
Trade Ideas Sheet - Long and short US equity ideas including ETF's. We will be overhauling the Trade Ideas Sheets for long only, short only, ETF's when the new website rolls out soon. There will also be a clearer email distribution with changes.
Trade Ideas Changes: STOPPED ON TSLA AT 325 +11.66% GAIN
Stops on everything. GDX 17.35 , FEYE 16.00, NVDA 235, QQQ 179, XLK 75, SPY
285, XLY 113, XRT 50, IWM 163, NSC 173, DIA 260, XLI 77 IBB 116, AMZN 1860 DXJ 56 , GLD 111, IEF 98 TLT 112 , BA 370, IBM 140, NFLX 345 (RECENTLY ADJUSTED STOPS) GOOGL 1000, ITB 28
|
|
|
|
|
|
|
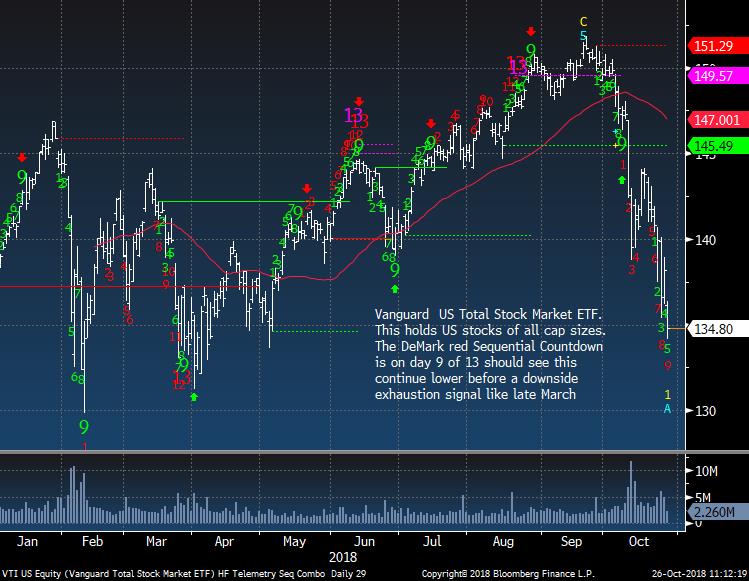
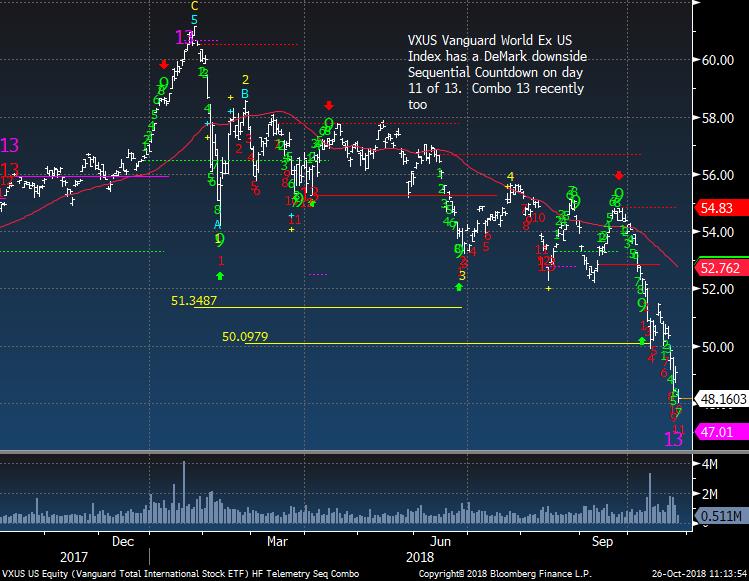
US Total Market and World Market Ex US
|
|
|
US Total Market still has a downside DeMark Countdown
|
|
|
|
|
World Ex US has a Combo 13 and red Sequential getting closer
|
|
|
|
|
|
|
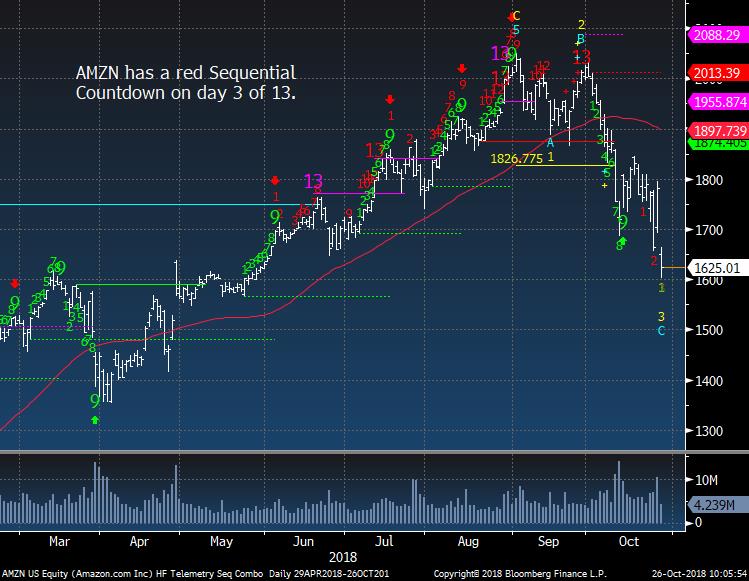
Amazon - When Good Stocks Go Bad
|
|
|
Amazon still has a downside DeMark Countdown in progress and is on wave 3 of 5
|
|
|
|
|
|
|
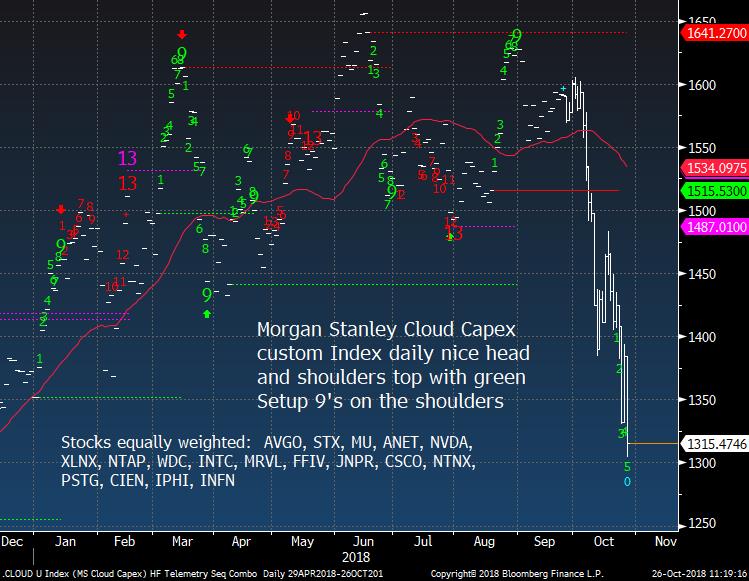
Morgan Stanley Cloud Capex Custom Index
|
|
|
When I built this chart in September I expected this to drop but perhaps not to give back the ENTIRE YTD gains!
|
|
|
|
|
|
|
|
|
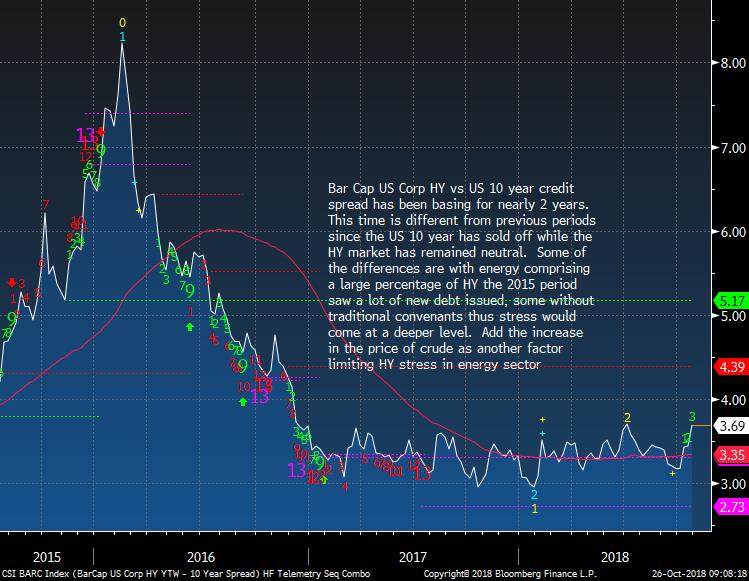
Still knocking on recent wides
|
|
|
|
|
|
|
|
|
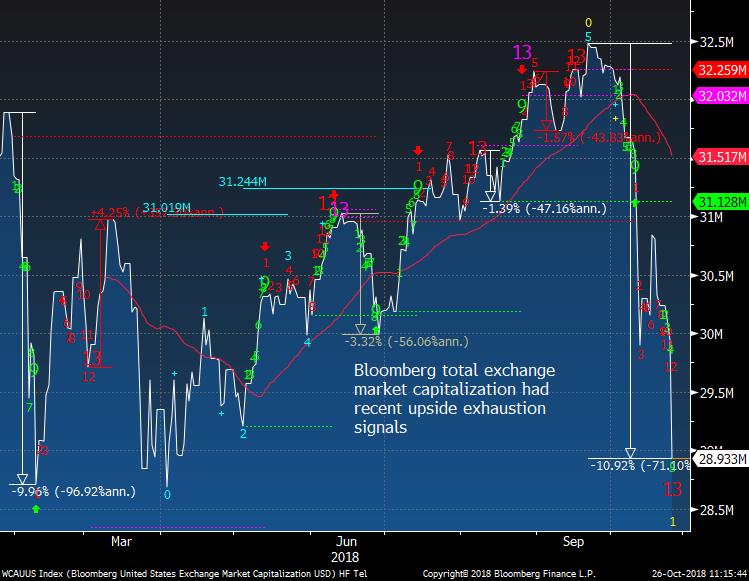
Nearly 11% has been trimmed off the US total market cap from the highs when I showed the upside DeMark Countdowns. There is now one on the bottom so perhaps a bounce is near
|
|
|
|
|
|
|
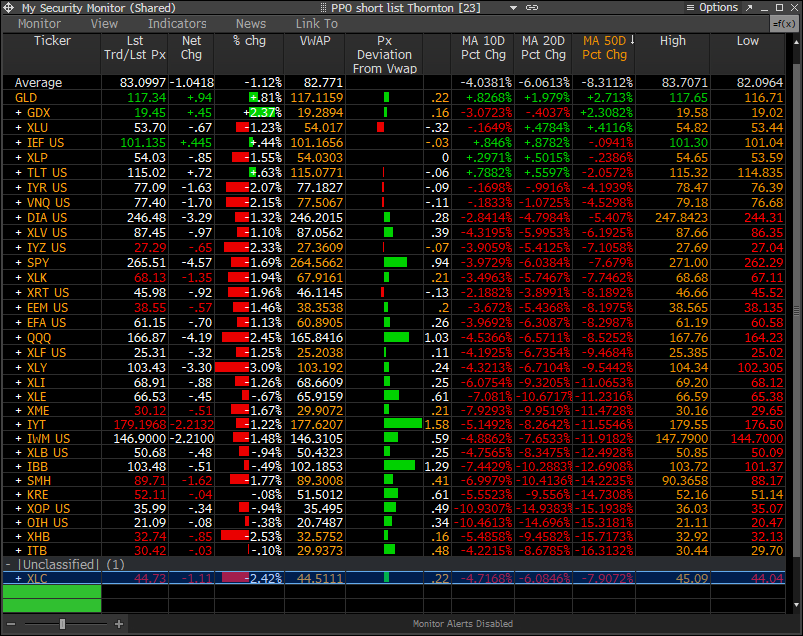
PPO Monitor - Percentage Price Oscillator
|
|
|
The PPO Monitor is a proprietary monitor developed to force rank Indexes, Sectors, and Stocks. It ranks top down by strongest to weakest by percentage above/below the 50 day moving average. Shorter term signals can be seen when the 10 and 20 day moving averages turn up (green) or down (red) which often are followed by the 50 day moving average. This is useful to watch for historically overbought/oversold percentage above/below the 50 day moving average. It is
non correlated with the DeMark Indicators however we have found upside/downside exhaustion signals often occur when something rises to the top or drifts to the bottom of the monitor - increasing the timing aspect. We share this monitor with clients with Bloomberg Terminals. An added feature is that each market/ETF can be expanded with each component force ranked in the same way. A couple other features include price deviation from intraday VWAP (useful for intraday reversals) and new 20 day highs/lows on right side. Please inquire if you would like to be permissioned to use the PPO Monitor.
Today's highlights: This was taken a little early in the day but it shows how red the indexes were while they were over today's VWAP illustrating how a bounce was happening early on
|
|
|
|
|
|
|
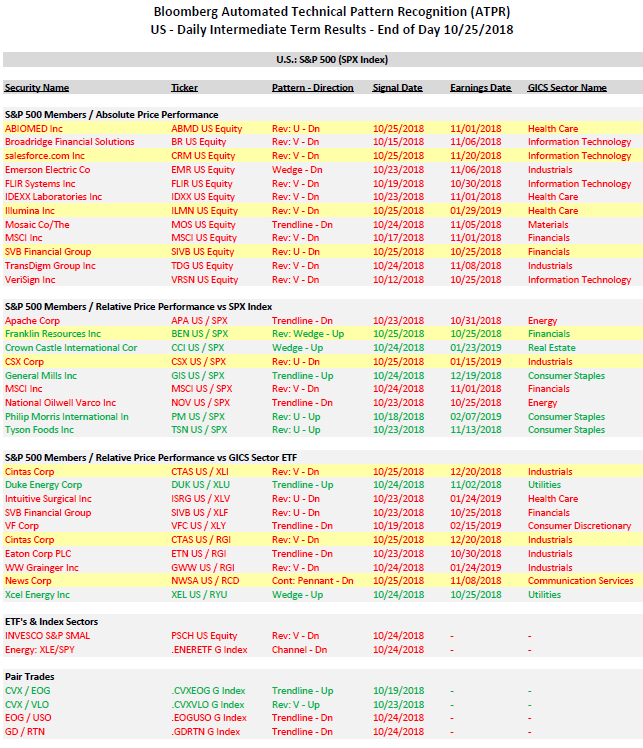
Bloomberg Automated Technical Pattern Recognition Screens
|
|
|
S&P 500 Members/Absolute Price Performance and Relative Price Performance vs S&P 500 and Sector ETF's. ETF's vs Index Sectors. Pair Trades. Long side is first symbol, short side is second symbol. If you would like a PDF from Bloomberg with full details of how this is formulated, please email. We will be doing a webinar in the coming weeks specifically on this system.
|
|
|
|
|
|
|
|
|
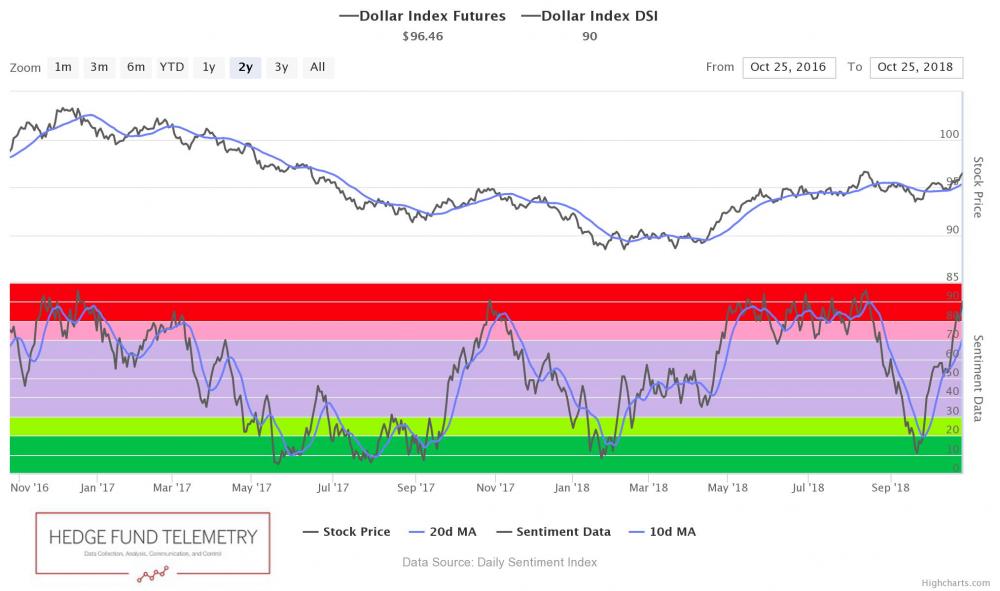
US Dollar bullish sentiment is at 90% and extreme
|
|
|
|
|
US Dollar Index has been back and forth in the green today. It still needs to close oover 96.73 to revert back to wave 5
|
|
|
|
|
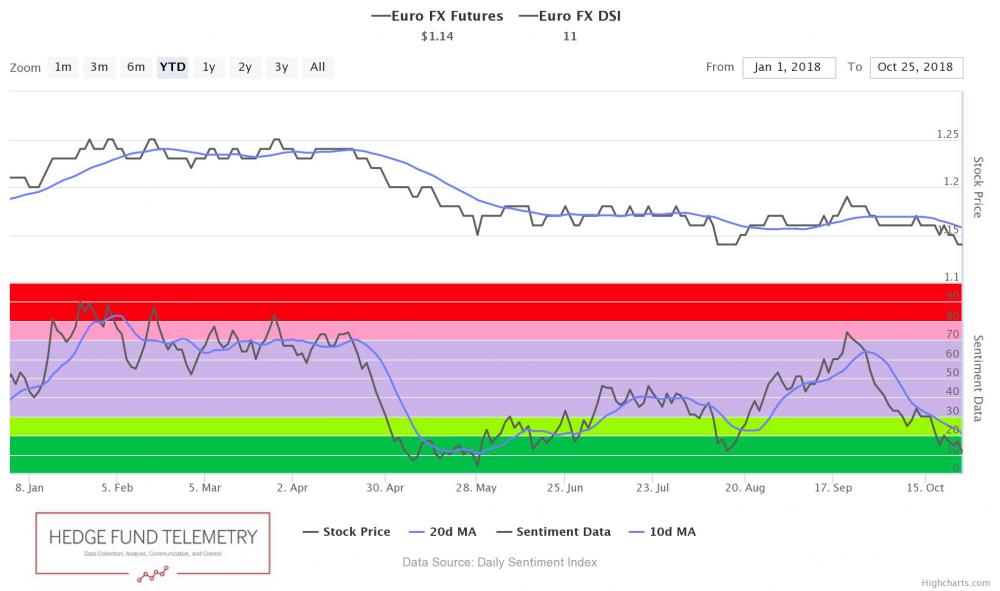
Euro bullish sentiment is at 11%. As you see it can and might stay in the green zone for months
|
|
|
|
|
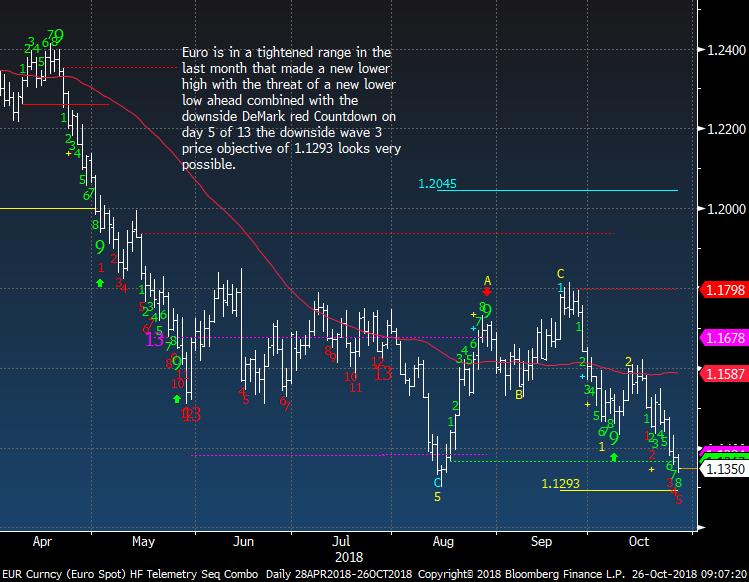
Euro Spot still looks lower
|
|
|
|
|
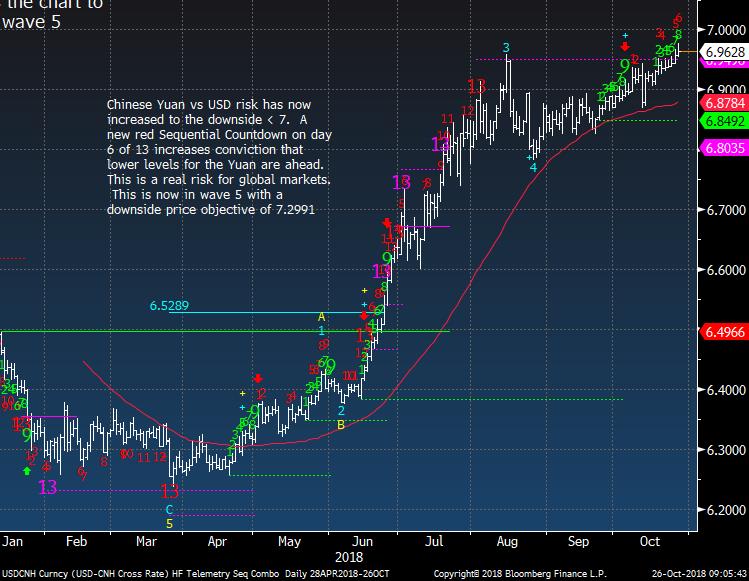
Yuan nearing the 7 level. I expect it to break below soon
|
|
|
|
|
|
|
|
|
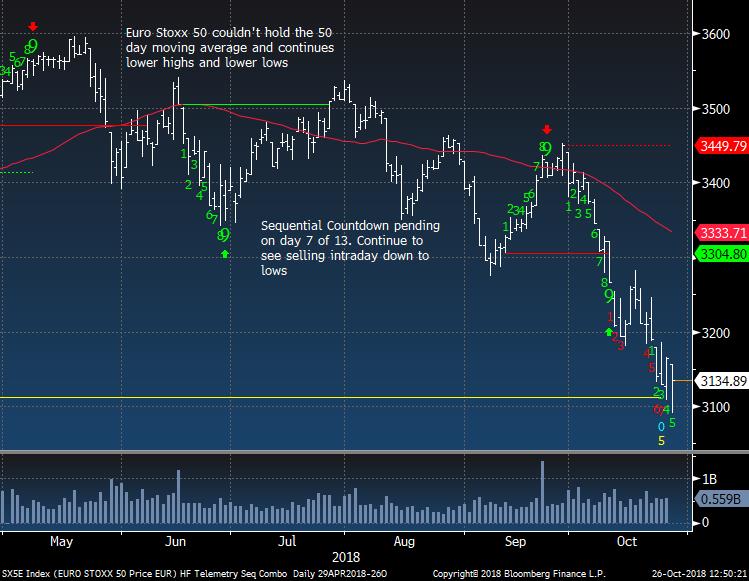
Euro Stoxx 50 hit a new low but bounced off low
|
|
|
|
|
European Banks getting closer to downside DeMark exhaustion signal
|
|
|
|
|
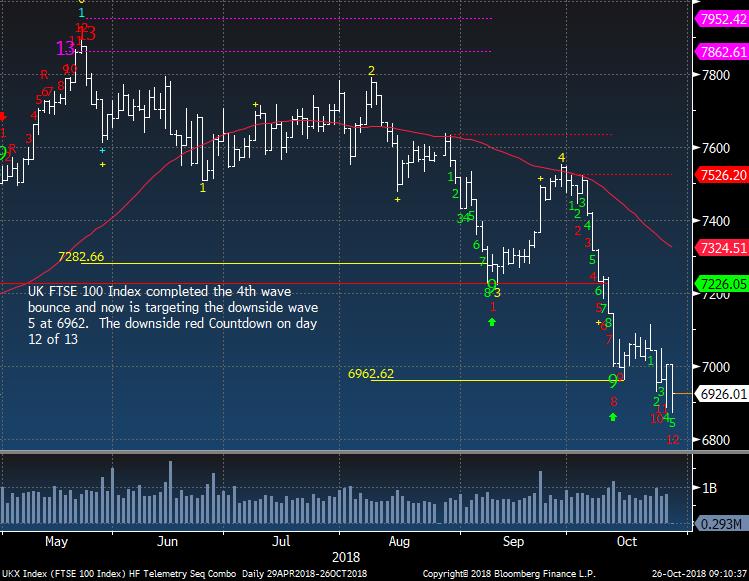
UK FTSE should have a downside exhaustion on Monday
|
|
|
|
|
|
|
|
|
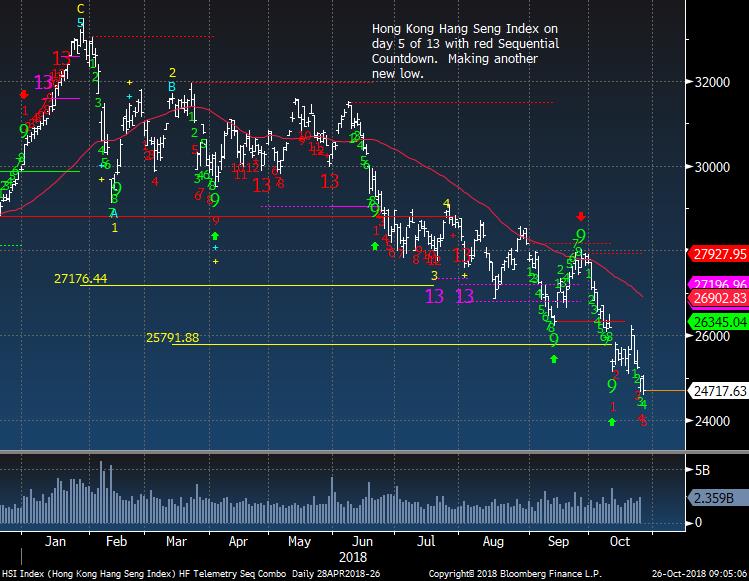
Hong Kong another new low
|
|
|
|
|
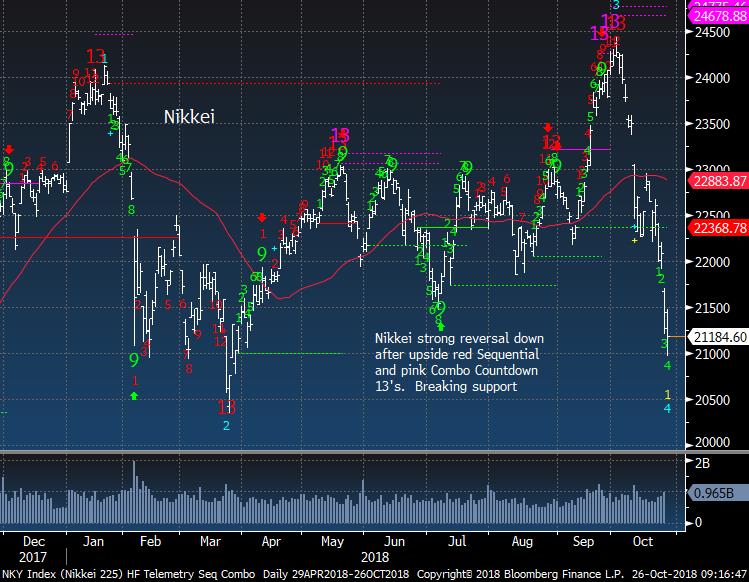
Nikkei really had a good reaction at the upside exhaustion signals.
|
|
|
|
|
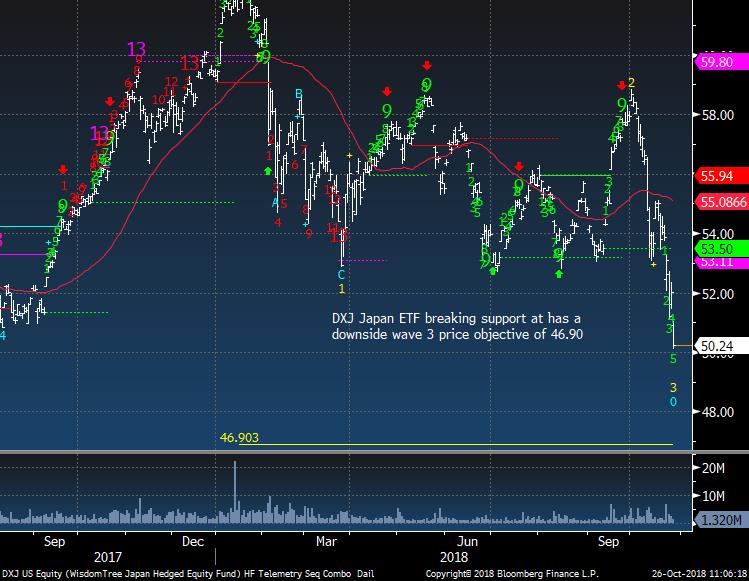
DXJ Japan ETF is down 12% on the Trade Ideas Sheet
|
|
|
|
|
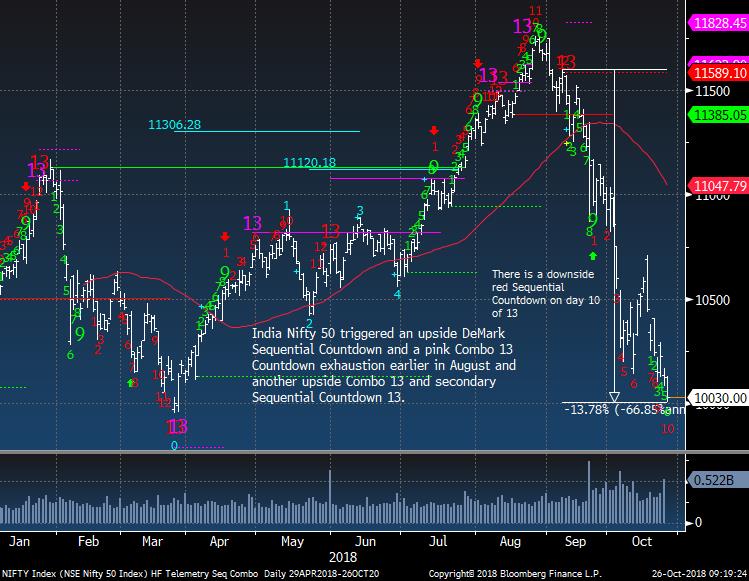
India is getting closer to a level to bounce
|
|
|
|
|
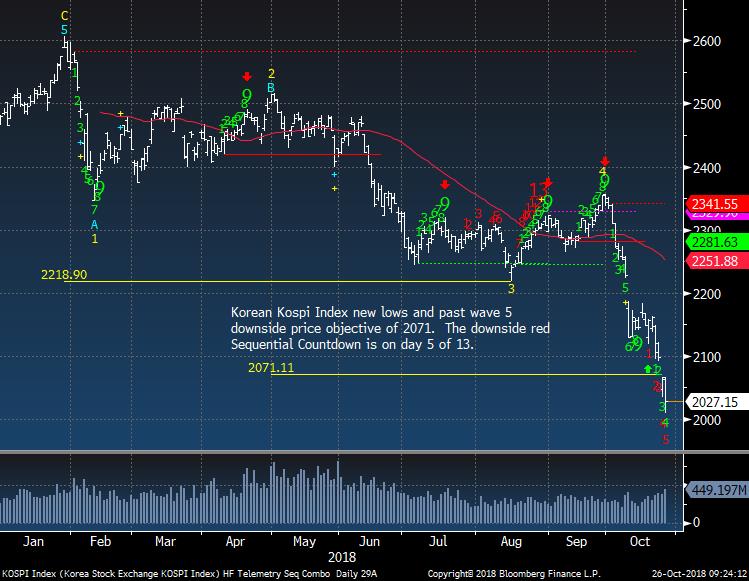
Korea really looks dangerous still with a downside Countdown in progress
|
|
|
|
|
|
|
|
|
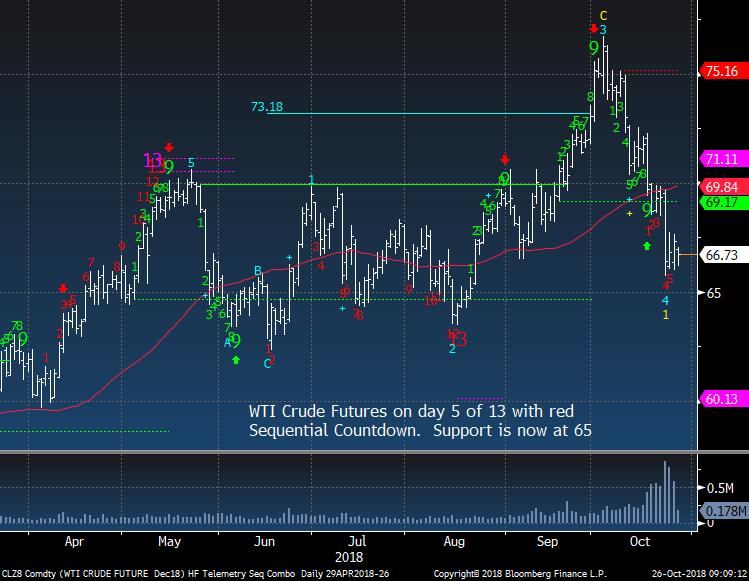
Crude bullish sentiment is at 63% and WTI Crude Futures continues to hold support
|
|
|
|
|
|
|
|
|
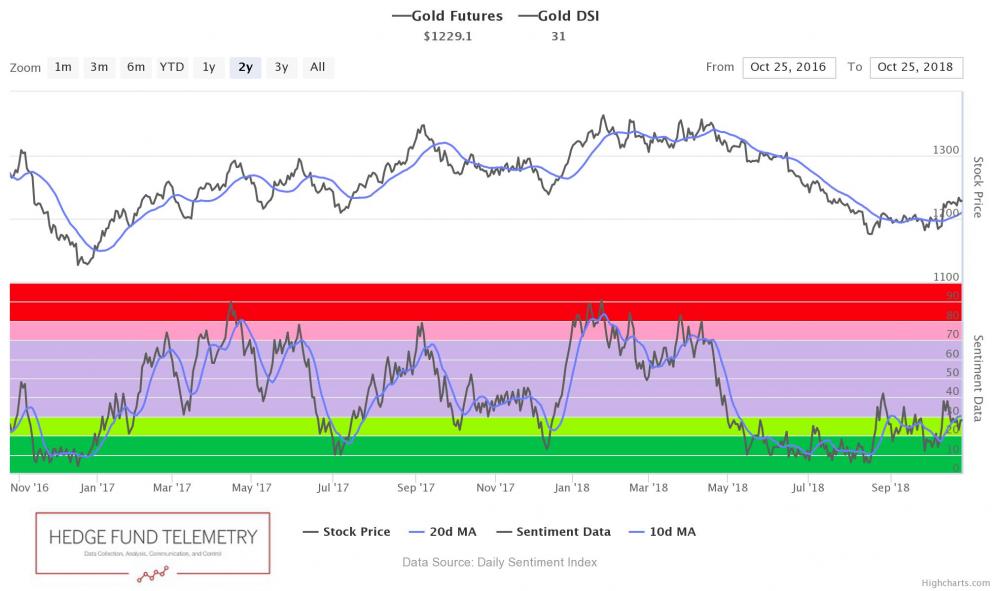
Gold bullish sentiment is at 31%
|
|
|
|
|
|
|
|
|
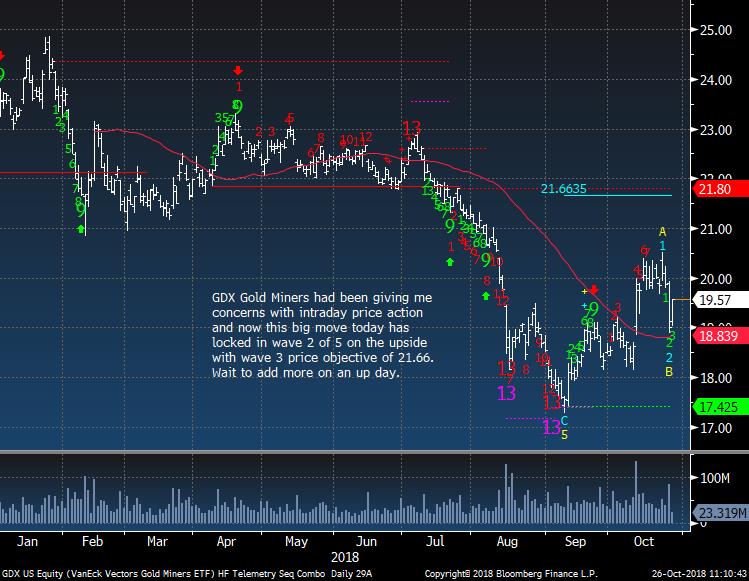
Gold Miners GDX ETF bouncing after yesterday's slam
|
|
|
|
|
|
|
|
|
Bond bullish sentiment is at 53% and could continue higher. TLT still slowly working higher
|
|
|
|
|
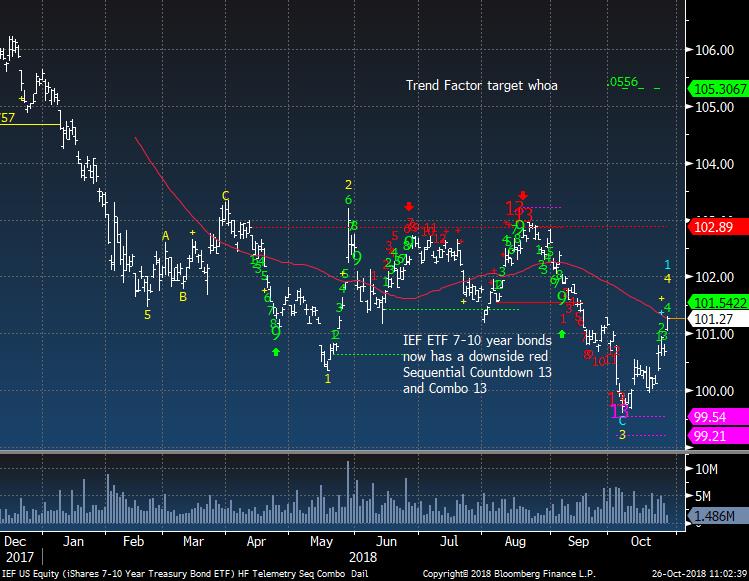
IEF ETF also slowly working higher. The upside Trend Factor target is surprisingly high
|
|
|
|
|
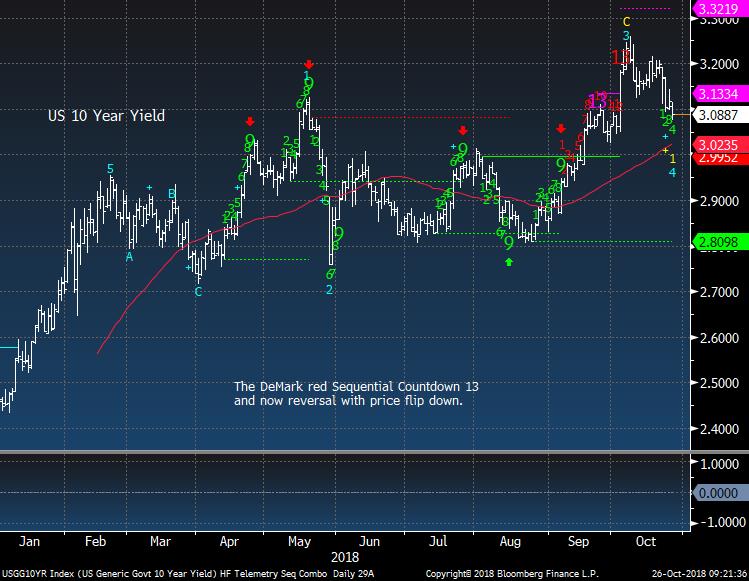
US 10 Year Yield made a 1 month low today
|
|
|
|
|
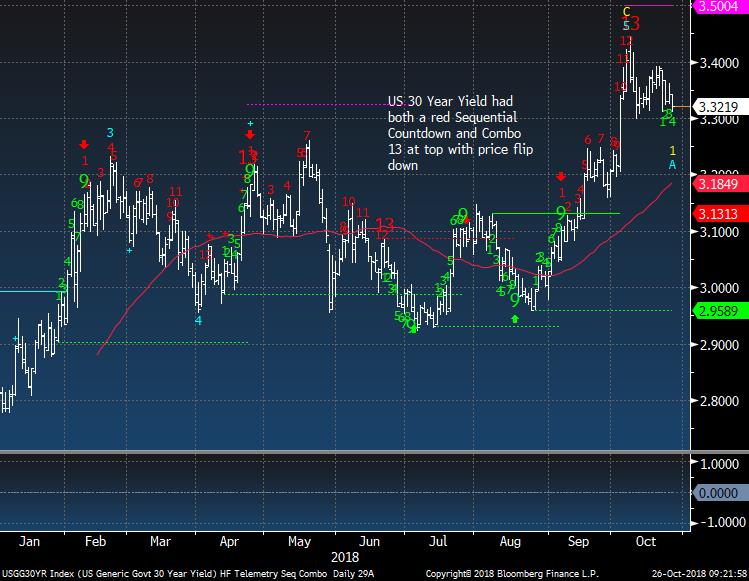
US 30 Year Yield has support at 3.30%
|
|
|
|
|
|
|
DEMARK SCREENS - Daily, Weekly, Monthly Upside/Downside Exhaustion Signals
|
|
|
Daily/Weekly DeMark upside/downside exhaustion signals (Sequential) updated daily, Weekly signals on Monday's and monthly on the first day of the new month. Price flips occur when a stock closes higher/lower than four previous closes and increases conviction of a price turn.
The upside 13's are sell signals and downside 13's are buy signals. Price flip's are confirmation signals that increases potential for a price trend change. For example, if you are long a stock and there is an upside 13, you will want to take cautious action by selling down or out of a position. If initiating a short sale with the upside 13's, we tend to start with a 1/2 size and add with the downside price flip. The opposite is true for when there are downside 13's. Take a 1/2 size position
and add with the upside price flip. The DeMark Indicators are designed to assist the user with buying into weakness and selling into strength to anticipate trend exhaustion. Selling into a rally and buying into a decline often afford the opportunity to exit a trade without too serious a loss if wrong.
S&P 500 Universe:
DAILY UPSIDE 13: CLX, WMT, XLNX
DAILY DOWNSIDE 13: ABBV, AKAM, FB, NKTR, PSX, WDC
DAILY UPSIDE WITH PRICE FLIP REVERSAL DOWN: CHD, CLX, EXC, HYS, MKC
DAILY DOWNSIDE WITH PRICE FLIP REVERSAL UP: BXP, LEG, PHM, RHT, UAA
Updated: 10/22/18
WEEKLY UPSIDE 13: NONE
WEEKLY DOWNSIDE 13: COTY, IRM, VNO
Updated: 10/1/18
MONTHLY UPSIDE 13: ADSK, ALL, CCI, CME, DE, DLR, DTE, ETN, GLW, HPQ, INTU, PH, TPR, TXT, UPS, XLNX
MONTHLY DOWNSIDE 13: NONE
Euro Stoxx 600 Universe:
DAILY UPSIDE 13: BT/A LN
DAILY DOWNSIDE 13: CARLB DC, INVEB SS, ITV LN, ONTEX BB, PRY IM, SDF GR, STM IM, STMN SW
DAILY UPSIDE WITH PRICE FLIP REVERSAL DOWN: BT/A LN, ETL FP, RRS LN
DAILY DOWNSIDE WITH PRICE FLIP REVERSAL UP: CON GR, HEI GR, KGX GR, NXT LN, RXL FP, SMIN LN, VOLVB SS
Updated: 10/22/18
WEEKLY UPSIDE 13: MUV2 GR
WEEKLY DOWNSIDE 13: BAS GR, FHZN SW, FRA GR, IMB LN, JMT PL, ONTEX BB, OSR GR
Updated: 10/1/18
MONTHLY UPSIDE 13: BNZL LN, EXPN LN, FPE3 GR, SBMO NA, SECUB SS, SWEDA SS
MONTHLY DOWNSIDE 13: BAYN GR, HMB SS, TEF SM
|
|
|
Unsubscribe me from Hedge Fund Telemetry
Hedge Fund Telemetry LLC, P.O. Box 4675, Greenwich, CT 06861, United States
CONFIDENTIALITY NOTE and DISCLAIMER: This message is for the named person's use only. It may contain confidential, proprietary or legally privileged material. No confidentiality or privilege is waived by any accidental or unintentional transmission. If you receive this message in error, please immediately delete it and all copies of it from your system, destroy any hard copies and notify the sender. You must not, directly or indirectly, use, disclose,
distribute, print or copy any part of this message if you are not the intended recipient. Hedge Fund Telemetry LLC. cannot guarantee the confidentiality of the material transmitted; therefore, information of a sensitive or confidential nature should not be transmitted. There is risk in trading markets. Hedge Fund Telemetry LLC reports are based on information gathered from various sources and believed to be reliable, but are not guaranteed as to accuracy and completeness. The information is subject to change without notice and Hedge Fund Telemetry LLC has no obligation to provide any updates or changes. Hedge Fund Telemetry LLC is providing this data for informational and educational purposes and does not believe that it is sufficient to base an investment decision on. This information should not be regarded as a solicitation or recommendation of any particular security or to engage in any trading strategy. One should always check with your licensed financial
advisor to determine suitability of any investments.
|
|
|
|
|